EDUC 816 Trend Chart and Bar Graph Assignment Instructions Overview Surveys used in applied research generate information that is precise, expedient, and easy, as compared to other forms of data colle
EDUC 816
How to Create Charts and Graphs
Instructions
For the Trend Chart and Bar Graph Assignment, you will use these instructions to create a trend chart and bar graph. You must use these instructions to complete these two items.
Creating a Trend Chart
A Trend Chart displays data over time. Let’s create a trend chart showing the test scores of students from the given data set.
Step 1. Given a data set with test scores and year.
| Year | Scores |
| 2016 | 98 |
| 2017 | 90 |
| 2018 | 92 |
| 2019 | 89 |
| 2020 | 87 |
Step 2. Find the Excel software program on your computer and open a spread sheet.
Step 3. Enter the column headings in cells A1 and B1.

Step 4. Enter the Year and test Scores in cells A2 and B6.

Step 5. Using your mouse, highlight cells A1 to B6.

Step 6. Now pick the Insert Tab then Recommended Charts.


Step 7. Pick the Trend Chart icon.

Step 8. Pick the OK.

Step 9. Select the figure then copy and paste.

Creating a Bar Graph
A bar graph displays data with either rectangular or horizontal bars of various lengths to show proportional differences between groups or categories. One axis of the chart shows the specific categories or group while the other axis represents a measured value. Let’s create a bar graph showing the average heights of males and females from the given data set.
Step 1. Given a data set, calculate the average for each group.
| Males | Females | |
| 69 | 68 | |
| 72 | 61 | |
| 70 | 64 | |
| 68 | 64 | |
| 66 | 67 | |
| Average | 69 | 65 |
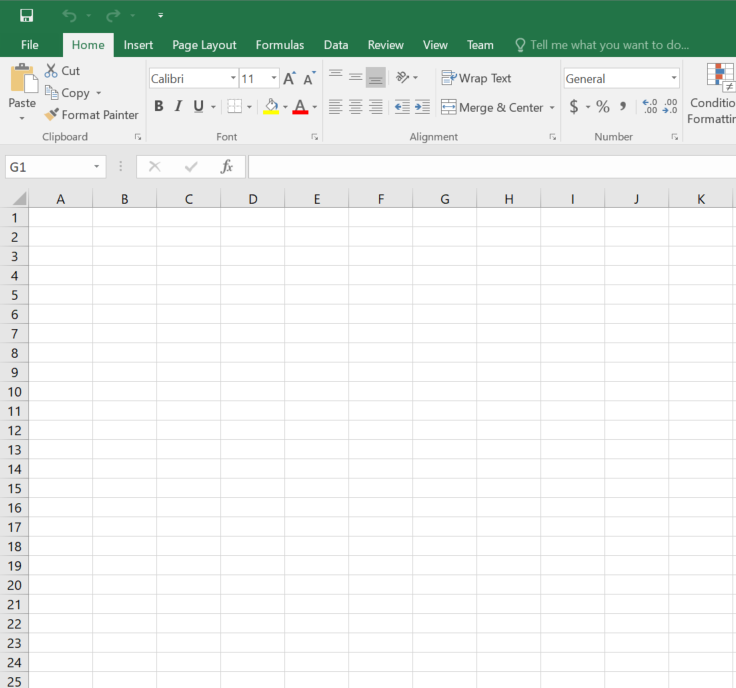
Step 2. Find the Excel software program on your computer and open a spread sheet.
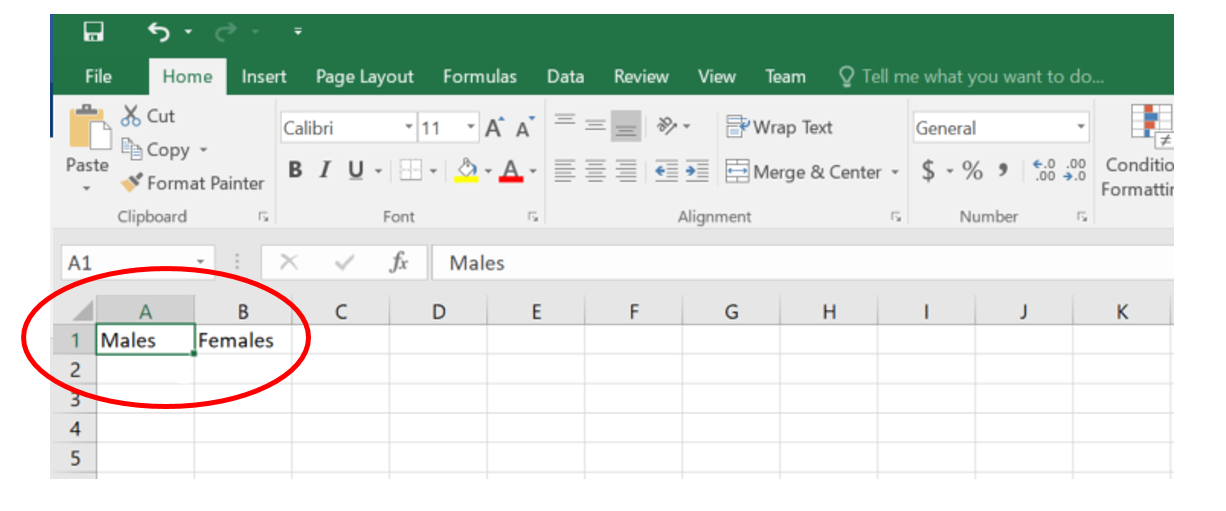
Step 3. Enter the column heading for each group in cells A1 and B1.
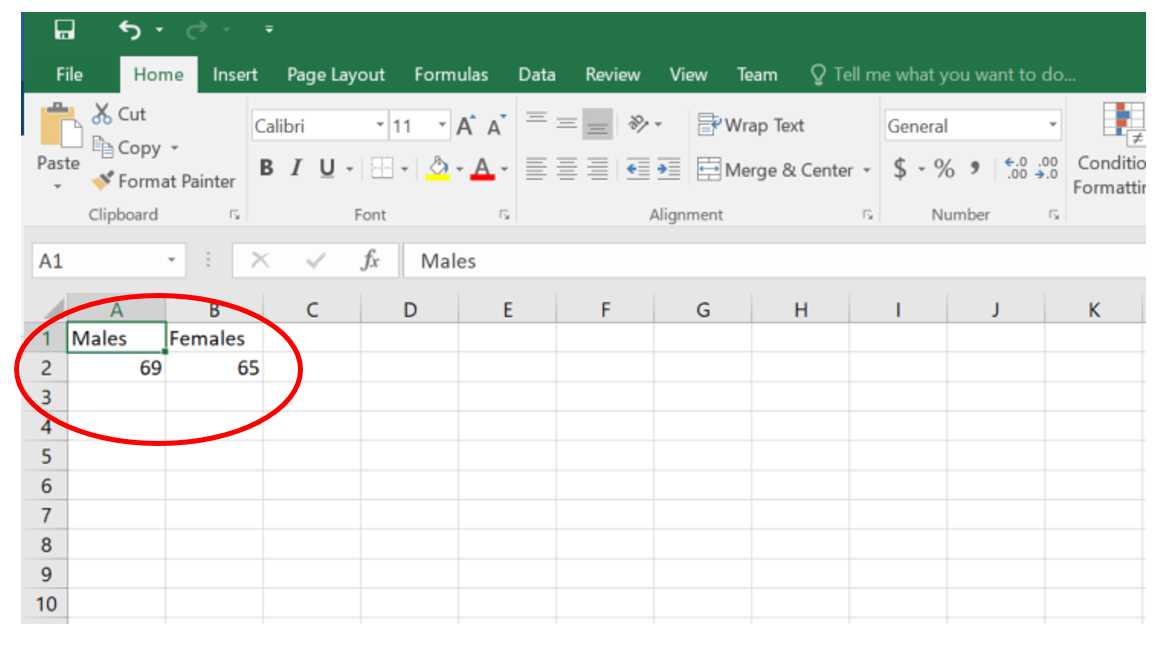
Step 4. Enter the Averages for each group in cells A2 and B2.
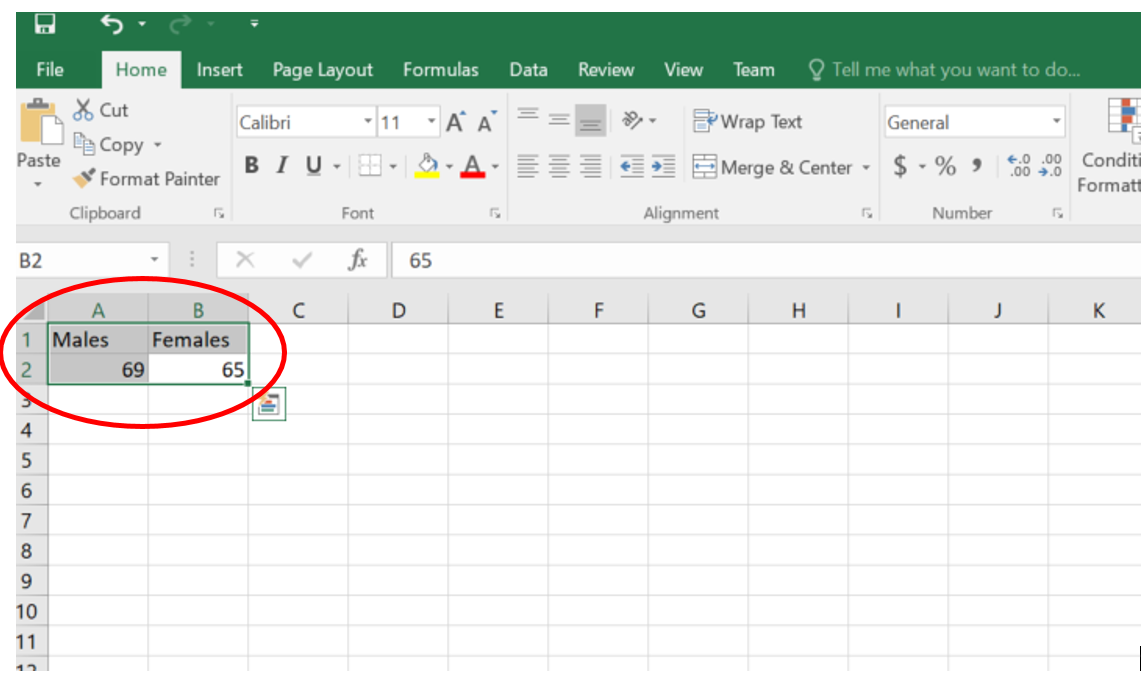
Step 5. Using your mouse, highlight cells A1 to B2.
Step 6. Now pick the Insert Tab then Recommended Charts.

Step 7. Pick the Bar Chart icon.

Step 8. Pick the OK.
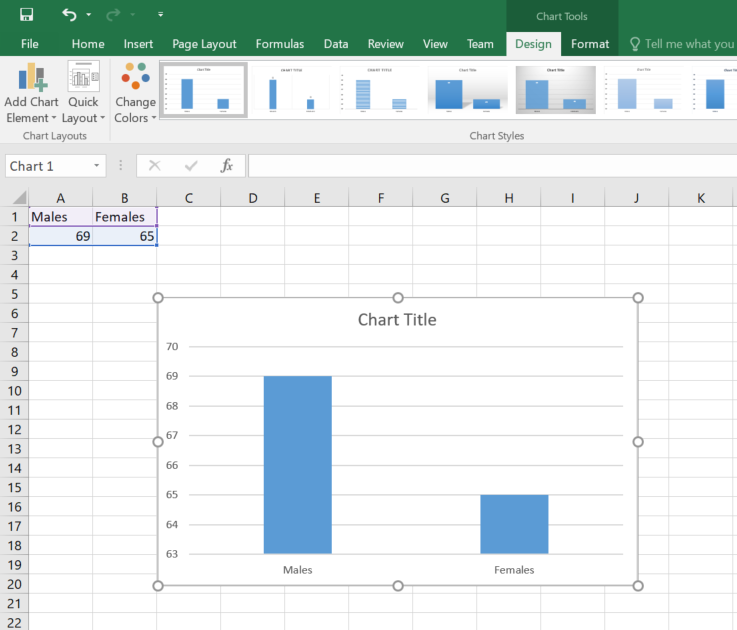
Step 9. Pick the Chart Title and type in the name Average Height.
Step 10. Now select the figure then copy and paste.


