This exercise includes installation instructions, data, and a tutorial. The tutorial requires students to work with the County Health Ranking dataset and assess the proportion of uninsured in CA count

THE COLLEGE OF ST. SCHOLASTICA - Duluth, Minnesota

Department of Health Informatics and Information Management

HIM 2111 HIM Technologies in Practice
Unit 7 – Data Visualization

Please read this document slowly and carefully. You will find what you need here. If you have any technical difficulties, please let me know.

In this document you will find:

  • Instructions to download the needed software/data file

  • Unit assignment with all instructions

  • Three questions to answer/submit for full credit (scroll to the bottom)

Download Instructions for Tableau Public (Free version of the software)- Mac and PC Users

  1. Visit: https://public.tableau.com/s/

  2. Scroll down and click on Tableau Public.

  3. Enter your e-mail address and select “Download App”

This exercise includes installation instructions, data, and a tutorial. The tutorial requires students to work with the County Health Ranking dataset and assess the proportion of uninsured in CA count 1

  1. The download will automatically start! The downloaded file will likely save to your downloads folder. The name of the file will be “TableauPublic”. A version may also be included in the name, but may vary depending on the date of your download. This tutorial was constructed using v10.0.0.

  2. It will likely ask to install on your computer and accept the agreement. Follow the prompts.

  3. Look for an icon on your desktop or in your download folder.

Download data file from the course

  1. Go to the Bb course.

  2. Learning activities>Unit 7>Unit 7 Assignment: Tableau

  3. Click on the attached file named: 2016CHR_CSV_Analytic_Data_v2.csv

  4. Save to your computer for this assignment (suggested area – desktop/easy to find area)

Assignment: Task: Compare the Proportion of People that are Uninsured across CA counties

  1. Go to Tableau Public on your computer. When you launch/open Tableau Public, you can import data from an Excel, Text, or Statistical file. The data we will be using is from a CSV file, which is considered a Text file. Therefore, click the “Text file” option to import the data.


This exercise includes installation instructions, data, and a tutorial. The tutorial requires students to work with the County Health Ranking dataset and assess the proportion of uninsured in CA count 2

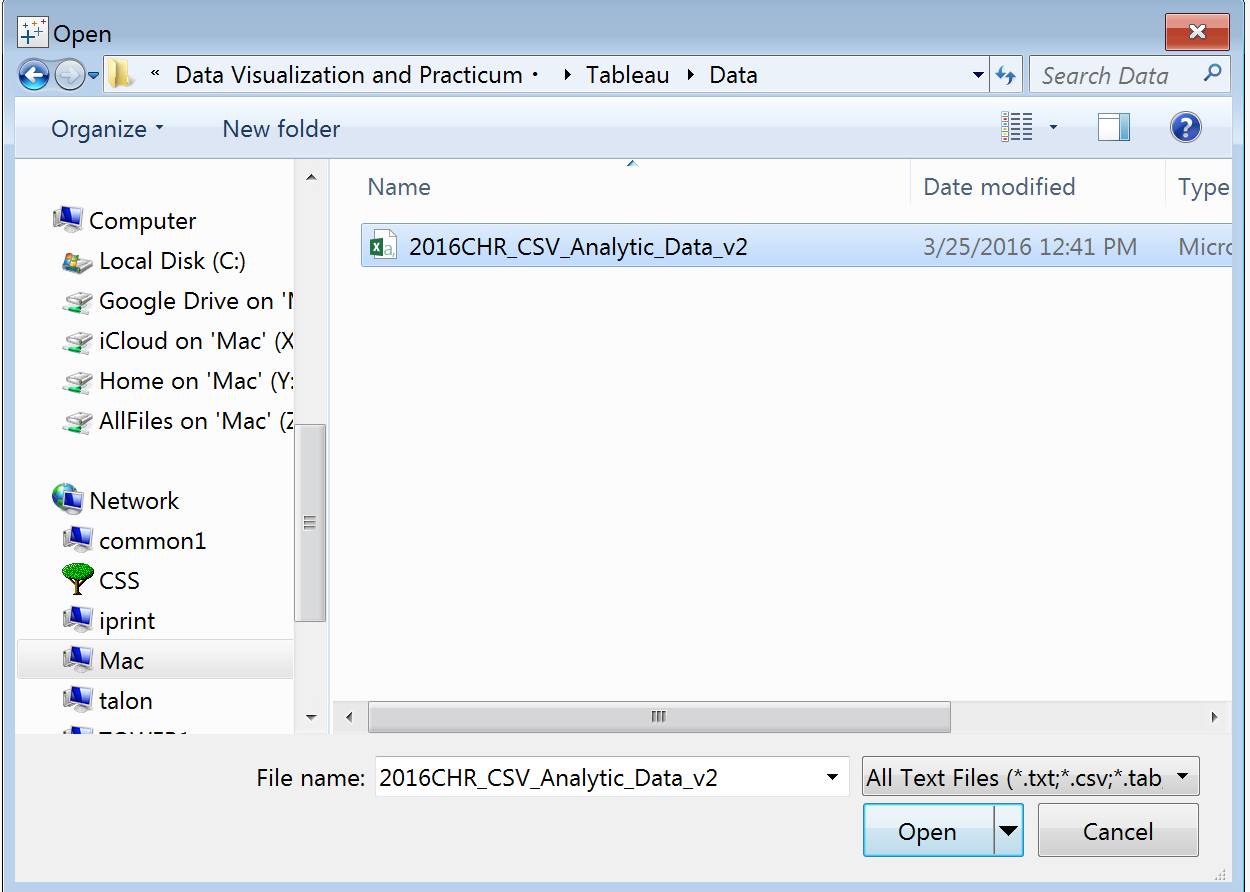
The data to import can be downloaded is from the course page that you just loaded onto your computer. The name of the file is “2016CHR_CSV_Analytic_Data_v2.csv”. Make sure that you download the data from the course page and save it somewhere onto your computer. In the window that appears after selecting to import a text file, you will have to find the dataset that you downloaded from the course page, select that dataset, and click Open.

This exercise includes installation instructions, data, and a tutorial. The tutorial requires students to work with the County Health Ranking dataset and assess the proportion of uninsured in CA count 3


This exercise includes installation instructions, data, and a tutorial. The tutorial requires students to work with the County Health Ranking dataset and assess the proportion of uninsured in CA count 4


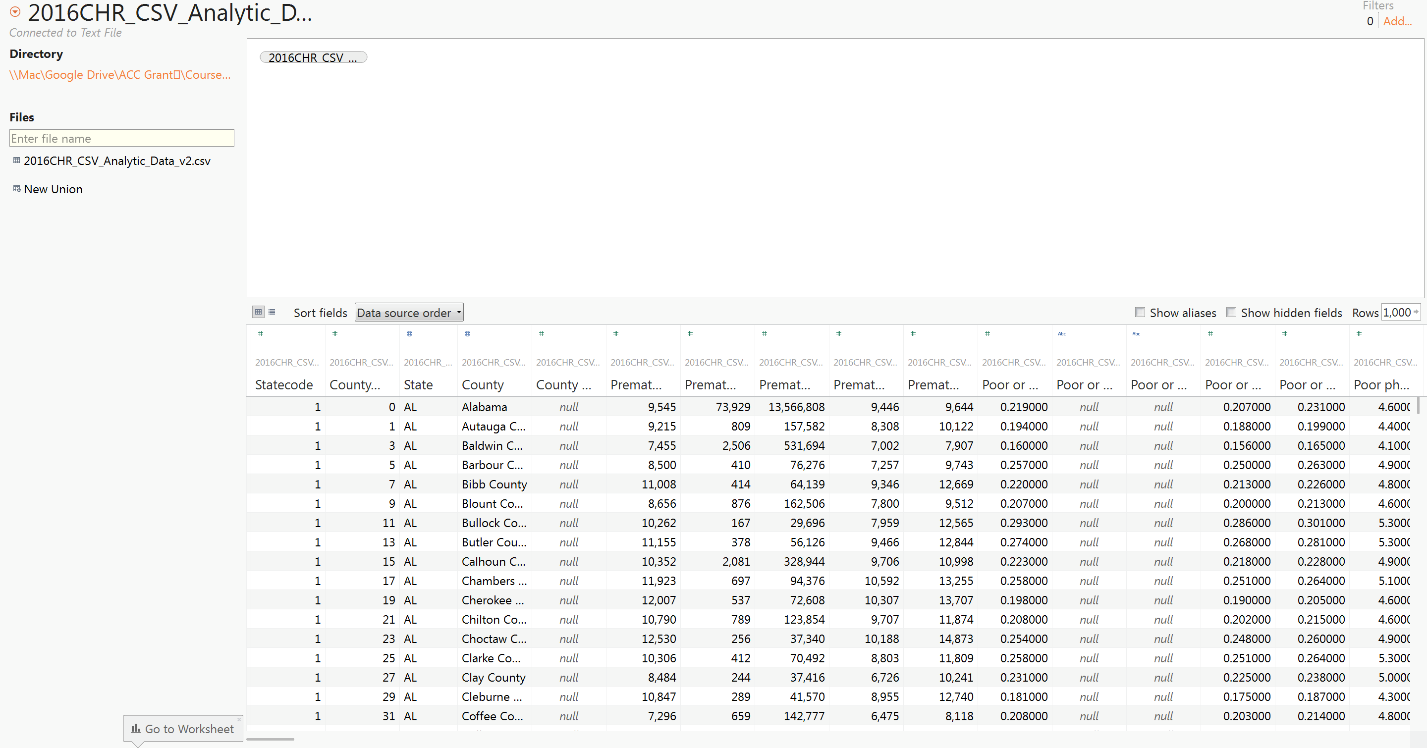
  1. It will take several moments for the data to load into Tableau. You’ll know that the data is loaded when you see the spreadsheet viewed on the screen.

This exercise includes installation instructions, data, and a tutorial. The tutorial requires students to work with the County Health Ranking dataset and assess the proportion of uninsured in CA count 5

This exercise includes installation instructions, data, and a tutorial. The tutorial requires students to work with the County Health Ranking dataset and assess the proportion of uninsured in CA count 6


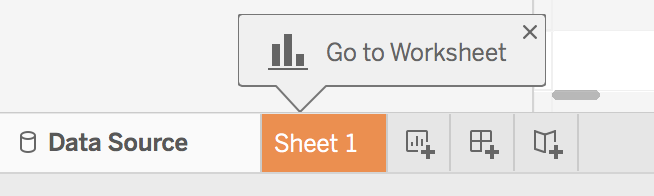
  1. After you import the data into Tableau Public, a new sheet named “Sheet1” will appear as a tab on the bottom of the screen. Click that tab.

This exercise includes installation instructions, data, and a tutorial. The tutorial requires students to work with the County Health Ranking dataset and assess the proportion of uninsured in CA count 7


This exercise includes installation instructions, data, and a tutorial. The tutorial requires students to work with the County Health Ranking dataset and assess the proportion of uninsured in CA count 8


  1. Tableau works similar to a PivotTable in MS Excel. There are columns, rows, and values. We begin by always adding our row variable first. This will generate a list of unique values from a selected field listed under “Dimensions”. In this case, we will select “County” as the row variable.


To do this, look for “State, County” listed under “Dimensions” in the left toolbar. Click the small dropdown icon to select just the “County” variable.

This exercise includes installation instructions, data, and a tutorial. The tutorial requires students to work with the County Health Ranking dataset and assess the proportion of uninsured in CA count 9

  1. With your left click on your mouse, click and hold down, drag the “County” variable over the “Drop field here” text listed on the left side of the open middle window pane labeled “Sheet 1”. Release the left click button.

This exercise includes installation instructions, data, and a tutorial. The tutorial requires students to work with the County Health Ranking dataset and assess the proportion of uninsured in CA count 10

This exercise includes installation instructions, data, and a tutorial. The tutorial requires students to work with the County Health Ranking dataset and assess the proportion of uninsured in CA count 11

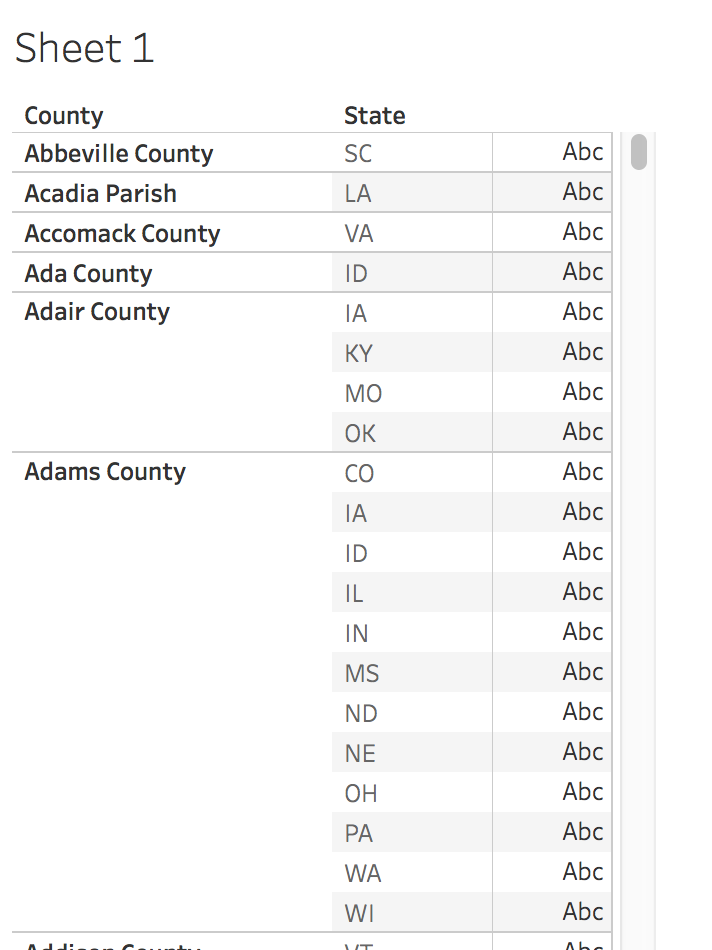
  1. After releasing the left click button, a list of unique county names will be shown.
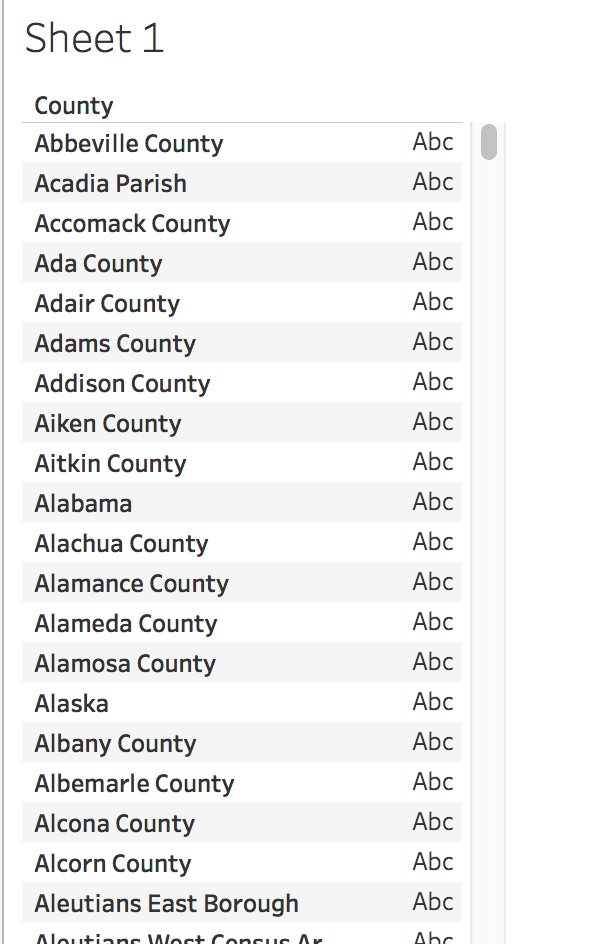
This exercise includes installation instructions, data, and a tutorial. The tutorial requires students to work with the County Health Ranking dataset and assess the proportion of uninsured in CA count 12

This exercise includes installation instructions, data, and a tutorial. The tutorial requires students to work with the County Health Ranking dataset and assess the proportion of uninsured in CA count 13

  1. Next, we are going to limit the counties to only those located in the state of California. To do this, click and drag the variable “State” listed under the “Dimensions” as another Row variable”.

This exercise includes installation instructions, data, and a tutorial. The tutorial requires students to work with the County Health Ranking dataset and assess the proportion of uninsured in CA count 14

This exercise includes installation instructions, data, and a tutorial. The tutorial requires students to work with the County Health Ranking dataset and assess the proportion of uninsured in CA count 15

  1. For each county, the state where the county is located will now be revealed.

This exercise includes installation instructions, data, and a tutorial. The tutorial requires students to work with the County Health Ranking dataset and assess the proportion of uninsured in CA count 16

This exercise includes installation instructions, data, and a tutorial. The tutorial requires students to work with the County Health Ranking dataset and assess the proportion of uninsured in CA count 17

  1. At the top-middle of the screen, you’ll see the label “Columns” and below that “Rows”. In the “Rows” bin you’ll find “County” and “State” listed. You can add a filter to the “State” variable by selecting the dropdown after clicking on “State” and choosing “Filter”.
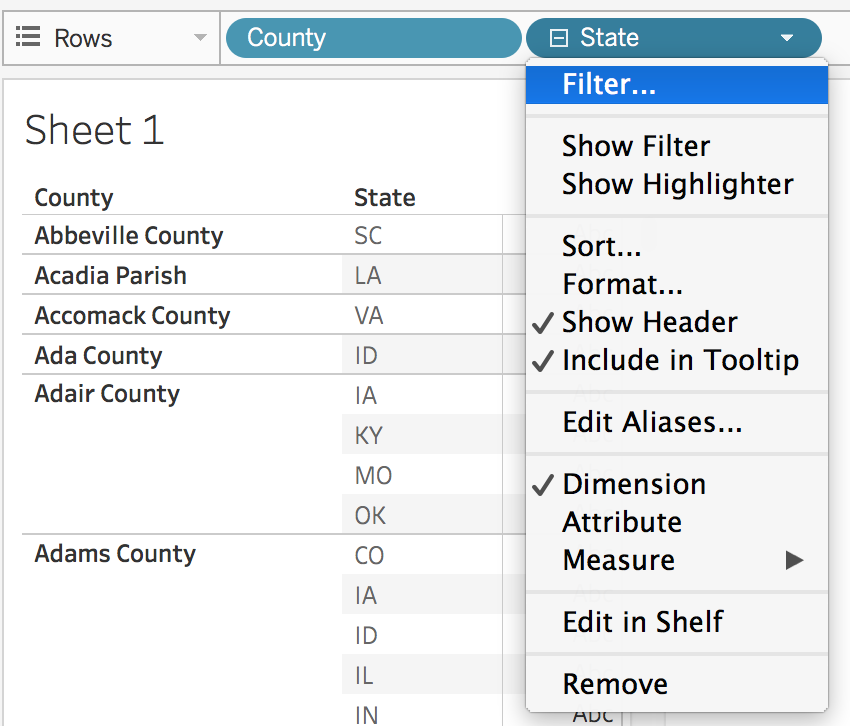
This exercise includes installation instructions, data, and a tutorial. The tutorial requires students to work with the County Health Ranking dataset and assess the proportion of uninsured in CA count 18

This exercise includes installation instructions, data, and a tutorial. The tutorial requires students to work with the County Health Ranking dataset and assess the proportion of uninsured in CA count 19

  1. A window will appear where you can select specific states. Select the button “None” to clear the checkboxes. Next, only check the box next to “CA”. Click OK.
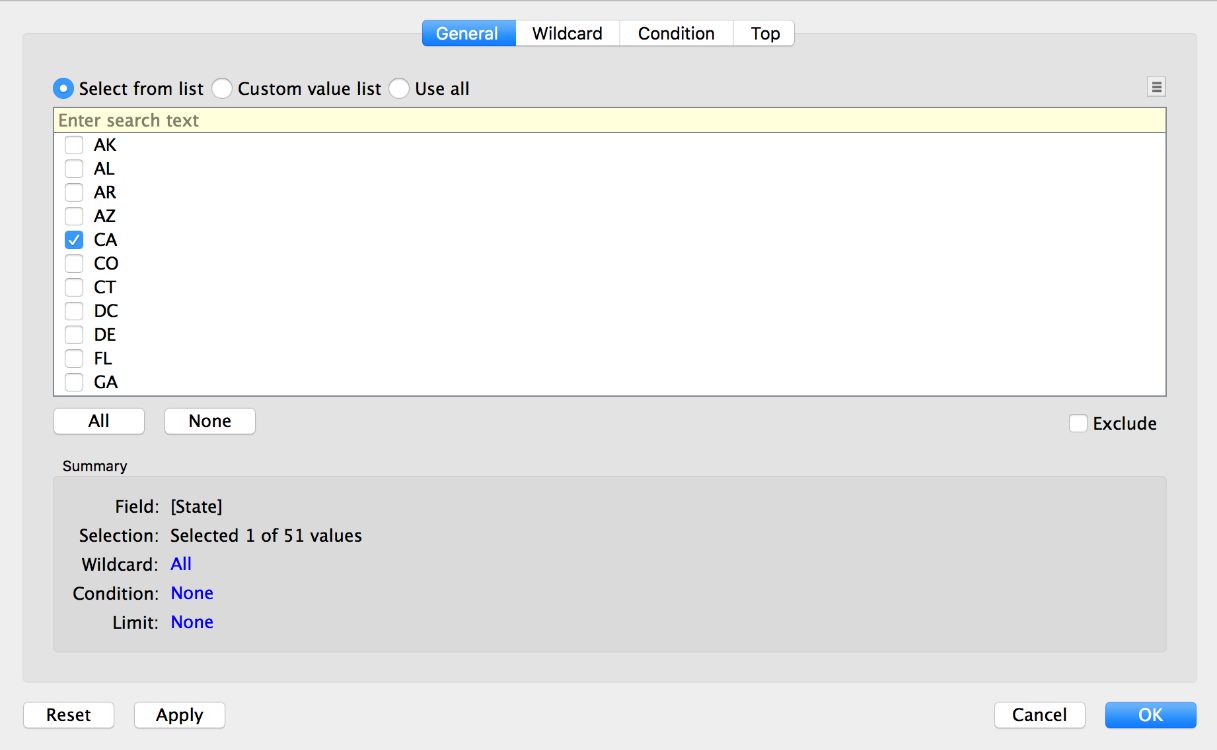
This exercise includes installation instructions, data, and a tutorial. The tutorial requires students to work with the County Health Ranking dataset and assess the proportion of uninsured in CA count 20

This exercise includes installation instructions, data, and a tutorial. The tutorial requires students to work with the County Health Ranking dataset and assess the proportion of uninsured in CA count 21

  1. Now, only counties in the state of CA are presented.
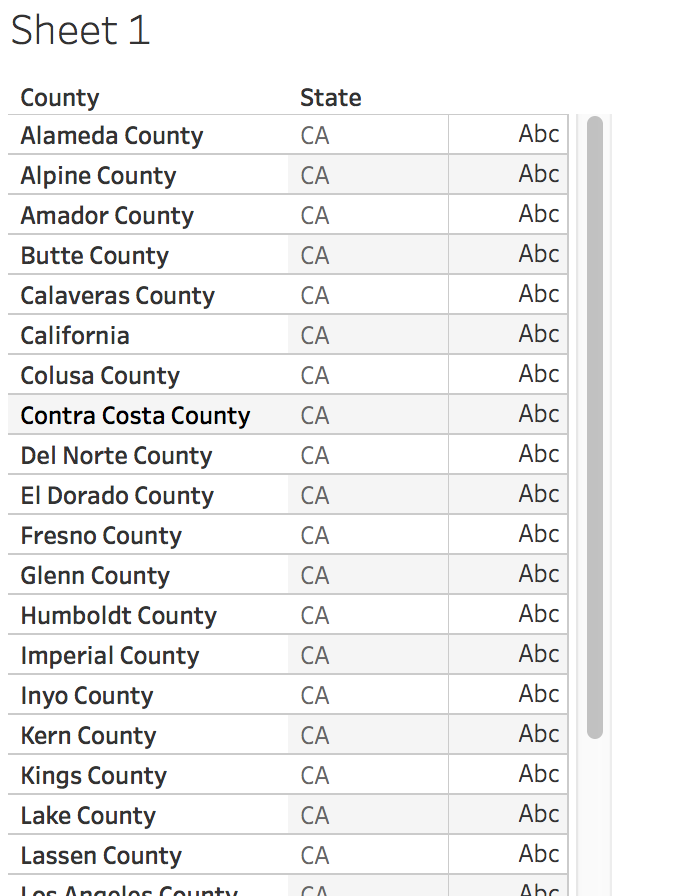
This exercise includes installation instructions, data, and a tutorial. The tutorial requires students to work with the County Health Ranking dataset and assess the proportion of uninsured in CA count 22

This exercise includes installation instructions, data, and a tutorial. The tutorial requires students to work with the County Health Ranking dataset and assess the proportion of uninsured in CA count 23

  1. Next, we will add the measure for the proportion of uninsured individuals in each county. In the left toolbar listed under “Measures” find the field “Uninsured Value”.
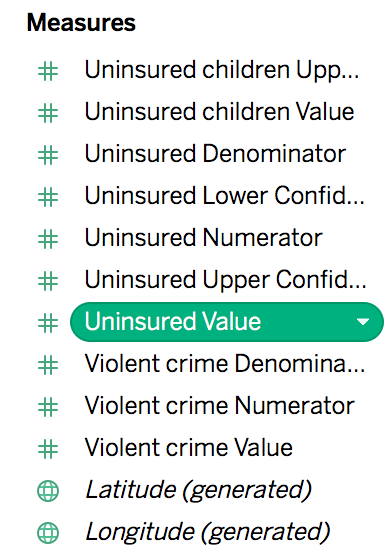
This exercise includes installation instructions, data, and a tutorial. The tutorial requires students to work with the County Health Ranking dataset and assess the proportion of uninsured in CA count 24

This exercise includes installation instructions, data, and a tutorial. The tutorial requires students to work with the County Health Ranking dataset and assess the proportion of uninsured in CA count 25

  1. With the left mouse button, click down and hold, drag the “Uninsured Value” field to “Sheet 1” and drop the field on the row with the text “Abc”.

This exercise includes installation instructions, data, and a tutorial. The tutorial requires students to work with the County Health Ranking dataset and assess the proportion of uninsured in CA count 26

  1. A list of values for the proportion of uninsured in each county will be revealed.

This exercise includes installation instructions, data, and a tutorial. The tutorial requires students to work with the County Health Ranking dataset and assess the proportion of uninsured in CA count 27

This exercise includes installation instructions, data, and a tutorial. The tutorial requires students to work with the County Health Ranking dataset and assess the proportion of uninsured in CA count 28

  1. Although there should only be one value for each county in the state of CA, in case there may be two values, rather than presented the data as a SUM of the proportion of uninsured, a better method is to present the data as an AVERAGE. Currently, the data is added as a SUM. To change this option, select the “SUM(Uninsured Value)” field listed under “Marks”, scroll down to “Measure (Sum)”, and in the submenu select “Average”

This exercise includes installation instructions, data, and a tutorial. The tutorial requires students to work with the County Health Ranking dataset and assess the proportion of uninsured in CA count 29

This exercise includes installation instructions, data, and a tutorial. The tutorial requires students to work with the County Health Ranking dataset and assess the proportion of uninsured in CA count 30

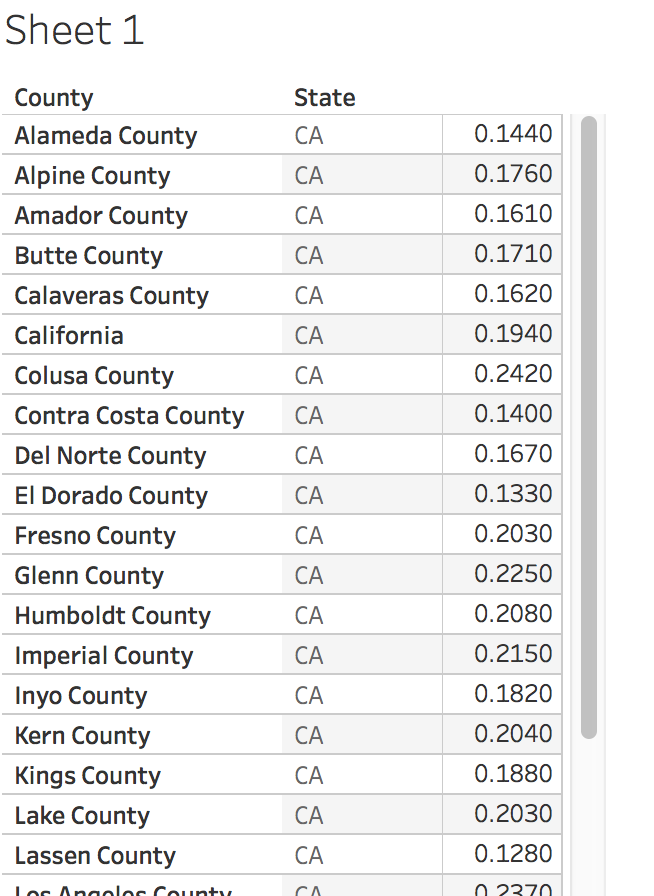
  1. Now the data will display an average of the uninsured rate rather than a sum for each county in CA.

This exercise includes installation instructions, data, and a tutorial. The tutorial requires students to work with the County Health Ranking dataset and assess the proportion of uninsured in CA count 31

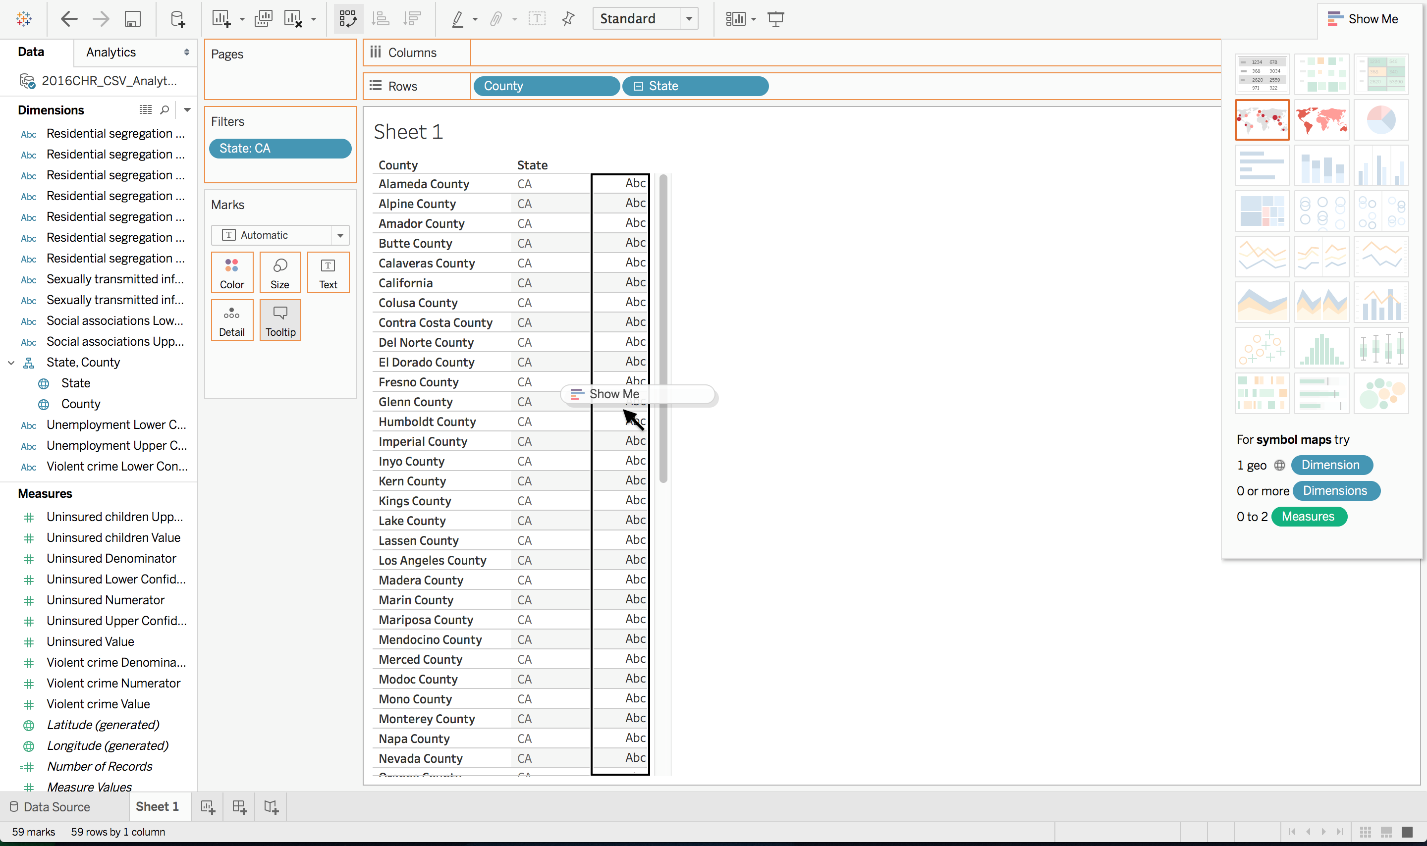
  1. The next step is to formulate a geographic view of the differences by county in the uninsured rate. On the right side of the screen, there are various graphical options to plot the data. Choose the map icon to create a heat map of the uninsured rates for each CA county. If you do not see the graphical options, select the “Show Me” button at the top-right of the screen to display the selections.
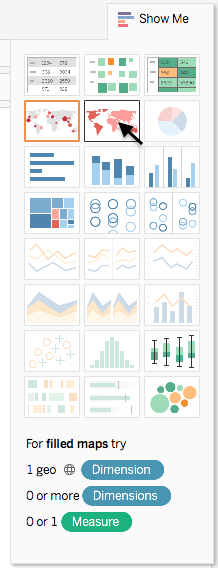
This exercise includes installation instructions, data, and a tutorial. The tutorial requires students to work with the County Health Ranking dataset and assess the proportion of uninsured in CA count 32

This exercise includes installation instructions, data, and a tutorial. The tutorial requires students to work with the County Health Ranking dataset and assess the proportion of uninsured in CA count 33

  1. The middle display entitled “Sheet 1” will now display a heat map to reveal the differences in the uninsured rates between the CA counties. The darker blue is associated with a higher uninsured rate while the lighter blue is a lower uninsured rate. If you scroll your mouse over a county, you will be shown the name of the county with the associated uninsured rate.
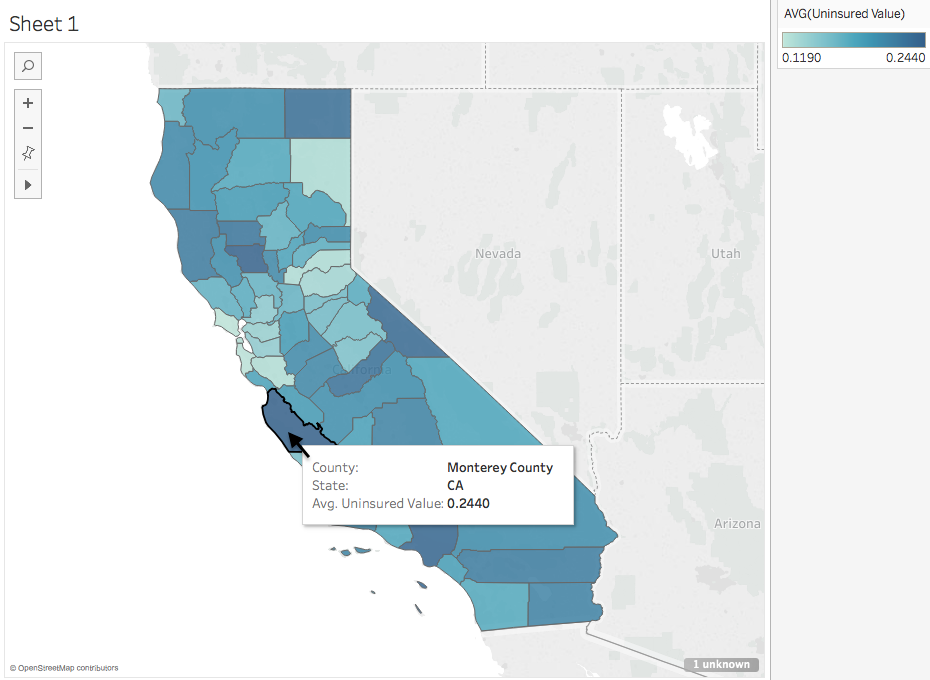
This exercise includes installation instructions, data, and a tutorial. The tutorial requires students to work with the County Health Ranking dataset and assess the proportion of uninsured in CA count 34

This exercise includes installation instructions, data, and a tutorial. The tutorial requires students to work with the County Health Ranking dataset and assess the proportion of uninsured in CA count 35

  1. Now that we have a geographic representation of the data, let’s visualize the data to see discrete differences between counties. To do this, we will first create a new sheet using the same analysis. Therefore, we will want to duplicate the existing “Sheet 1”. Right click the “Sheet 1” tab at the lower left side of the screen, select “Duplicate”. Now, “Sheet 2” should appear as a new tab.


This exercise includes installation instructions, data, and a tutorial. The tutorial requires students to work with the County Health Ranking dataset and assess the proportion of uninsured in CA count 36

  1. Click on “Sheet 2”, and reformat the way the data is presented. There is an option to preview the data using a bar plot. Under “Show Me” there is an icon that appears as a horizontal bar plot. Select this option to present the uninsured rates for each CA county as a bar.
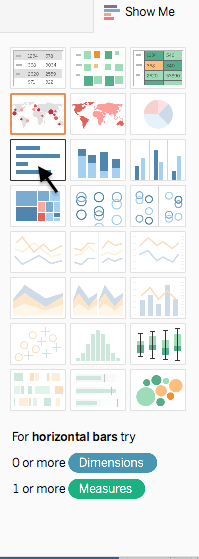
This exercise includes installation instructions, data, and a tutorial. The tutorial requires students to work with the County Health Ranking dataset and assess the proportion of uninsured in CA count 37

This exercise includes installation instructions, data, and a tutorial. The tutorial requires students to work with the County Health Ranking dataset and assess the proportion of uninsured in CA count 38

  1. The data is than displays the graph shown below. Note that there is no particular order of the counties.
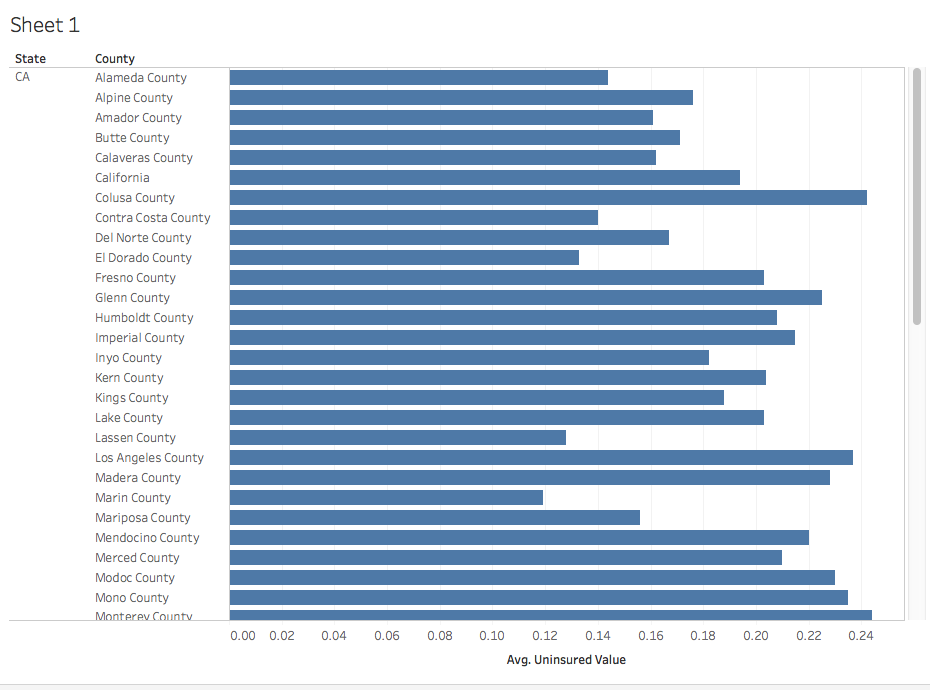
This exercise includes installation instructions, data, and a tutorial. The tutorial requires students to work with the County Health Ranking dataset and assess the proportion of uninsured in CA count 39

This exercise includes installation instructions, data, and a tutorial. The tutorial requires students to work with the County Health Ranking dataset and assess the proportion of uninsured in CA count 40

  1. To alter the view of the bar plot so that the data is presented in ascending or descending order, select the “County” field listed next to the “Rows” bin and choose the “Sort” option in the submenu.
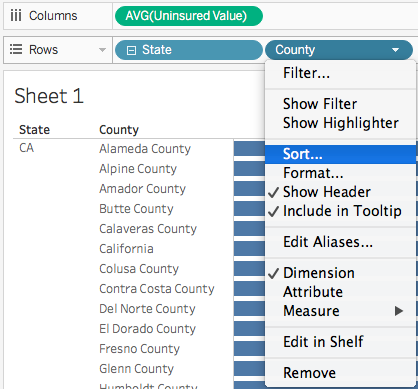
This exercise includes installation instructions, data, and a tutorial. The tutorial requires students to work with the County Health Ranking dataset and assess the proportion of uninsured in CA count 41

This exercise includes installation instructions, data, and a tutorial. The tutorial requires students to work with the County Health Ranking dataset and assess the proportion of uninsured in CA count 42

  1. A window will appear where you can select to sort the counties in descending order based on the “Uninsured Value” field. To do this, select the “Descending” radio button and the “Field” radio button to select “Uninsured Value” from the drop down. Now click OK.
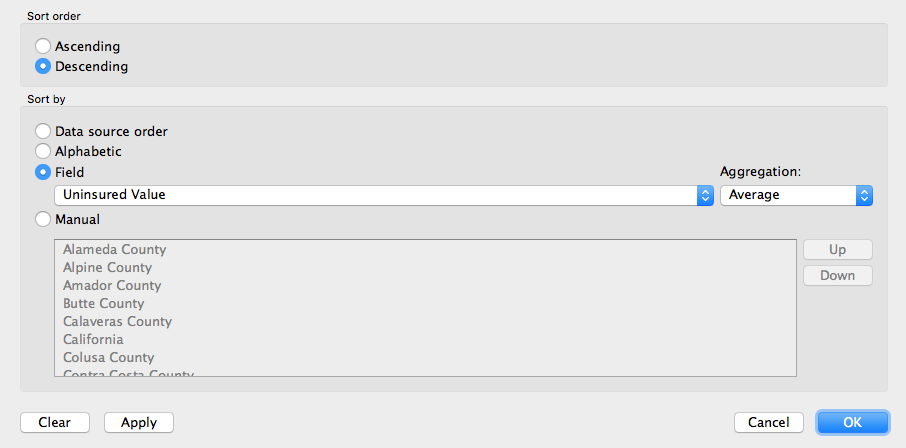
This exercise includes installation instructions, data, and a tutorial. The tutorial requires students to work with the County Health Ranking dataset and assess the proportion of uninsured in CA count 43

This exercise includes installation instructions, data, and a tutorial. The tutorial requires students to work with the County Health Ranking dataset and assess the proportion of uninsured in CA count 44

  1. The data is now presented in descending order.

This exercise includes installation instructions, data, and a tutorial. The tutorial requires students to work with the County Health Ranking dataset and assess the proportion of uninsured in CA count 45

This exercise includes installation instructions, data, and a tutorial. The tutorial requires students to work with the County Health Ranking dataset and assess the proportion of uninsured in CA count 46


  1. Next, we will create a dashboard to visualize both of the plots on the same page. To create a dashboard, click on the new dashboard icon in the lower left side of the screen.

This exercise includes installation instructions, data, and a tutorial. The tutorial requires students to work with the County Health Ranking dataset and assess the proportion of uninsured in CA count 47

This exercise includes installation instructions, data, and a tutorial. The tutorial requires students to work with the County Health Ranking dataset and assess the proportion of uninsured in CA count 48

  1. A new tab will appear at the lower left side of the screen entitled “Dashboard 1”. Click on that tab. You will see on the left side of the screen under “Sheets” the name of the two sheets that you created previously. Drag “Sheet 1” to the open dashboard over the text “Drop sheets here”.

This exercise includes installation instructions, data, and a tutorial. The tutorial requires students to work with the County Health Ranking dataset and assess the proportion of uninsured in CA count 49


This exercise includes installation instructions, data, and a tutorial. The tutorial requires students to work with the County Health Ranking dataset and assess the proportion of uninsured in CA count 50

  1. Next, let’s remove the legend from the dashboard for “Sheet 1”. To do this, click the legend in the upper right corner, and select the “X” in the upper corner to remove the legend.
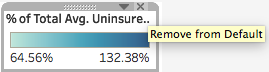
This exercise includes installation instructions, data, and a tutorial. The tutorial requires students to work with the County Health Ranking dataset and assess the proportion of uninsured in CA count 51

This exercise includes installation instructions, data, and a tutorial. The tutorial requires students to work with the County Health Ranking dataset and assess the proportion of uninsured in CA count 52

  1. Next, drag “Sheet 2” and drop it above “Sheet 1” in the dashboard window pane. You should see the bar plot above the map.
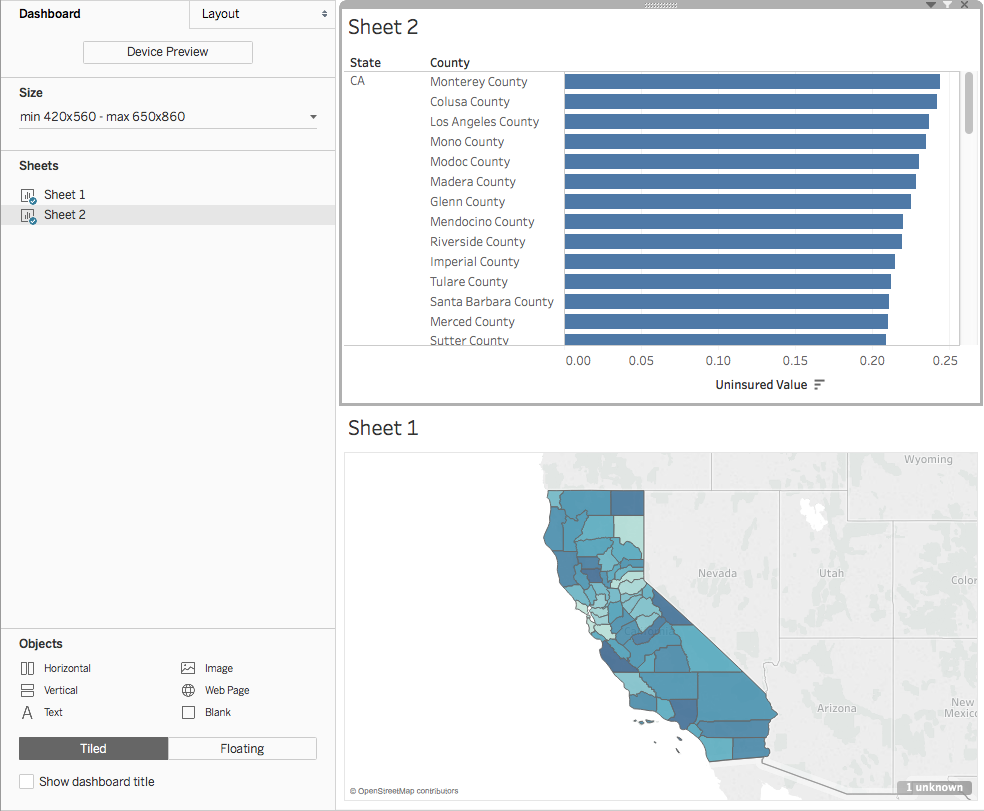
This exercise includes installation instructions, data, and a tutorial. The tutorial requires students to work with the County Health Ranking dataset and assess the proportion of uninsured in CA count 53

This exercise includes installation instructions, data, and a tutorial. The tutorial requires students to work with the County Health Ranking dataset and assess the proportion of uninsured in CA count 54

  1. Change the size of the plot areas by dragging your cursor between the two figures until the cursor turns into a two-sided arrow. Now, you can click and drag upwards to allow for more room for the map and less room for the bar plot.
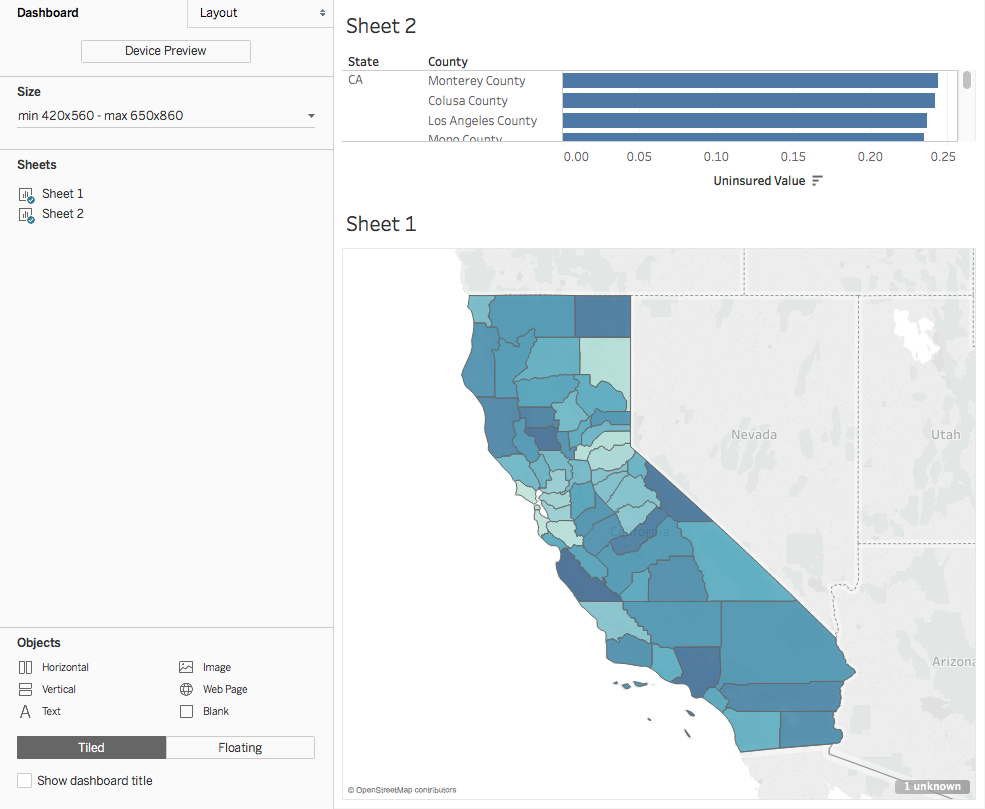
This exercise includes installation instructions, data, and a tutorial. The tutorial requires students to work with the County Health Ranking dataset and assess the proportion of uninsured in CA count 55

This exercise includes installation instructions, data, and a tutorial. The tutorial requires students to work with the County Health Ranking dataset and assess the proportion of uninsured in CA count 56

  1. Now, you will transform the dashboard so that a user can select a county from the bar plot above to reveal just that county in the map. To do this, you need to select the bar plot and in the upper right side of the plot, select the filter icon.
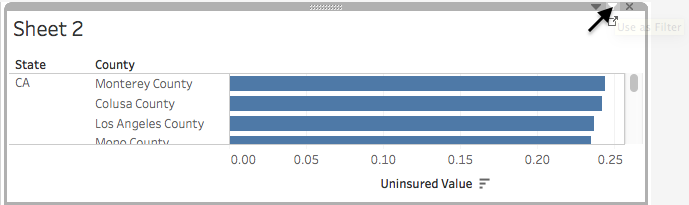
This exercise includes installation instructions, data, and a tutorial. The tutorial requires students to work with the County Health Ranking dataset and assess the proportion of uninsured in CA count 57

This exercise includes installation instructions, data, and a tutorial. The tutorial requires students to work with the County Health Ranking dataset and assess the proportion of uninsured in CA count 58

  1. Now that the filter is turned on(use as a filter), you can select a county, for instance “Monterey County”, from the bar plot and the map will update to only show that county.
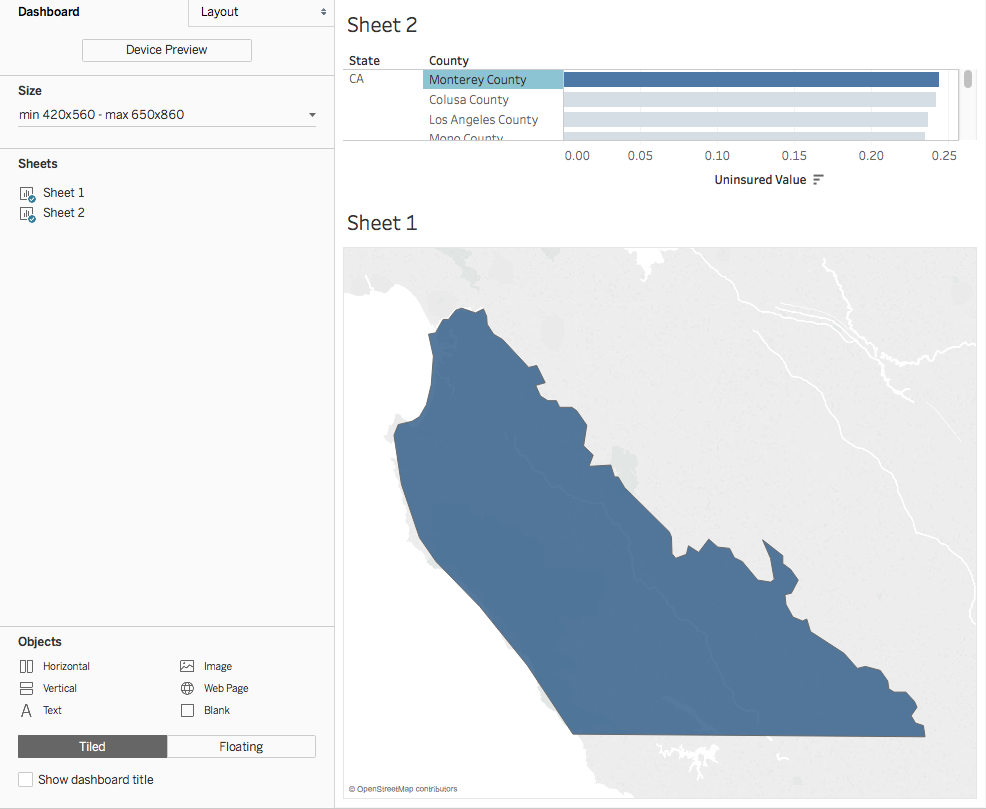
This exercise includes installation instructions, data, and a tutorial. The tutorial requires students to work with the County Health Ranking dataset and assess the proportion of uninsured in CA count 59

This exercise includes installation instructions, data, and a tutorial. The tutorial requires students to work with the County Health Ranking dataset and assess the proportion of uninsured in CA count 60

  1. You can preview all CA counties once again by selecting “CA”, which is listed as the far left column in the bar plot above the map listed under the heading “State”.

This exercise includes installation instructions, data, and a tutorial. The tutorial requires students to work with the County Health Ranking dataset and assess the proportion of uninsured in CA count 61

This exercise includes installation instructions, data, and a tutorial. The tutorial requires students to work with the County Health Ranking dataset and assess the proportion of uninsured in CA count 62

  1. Assume you want to maintain the entire view of CA, and when you click on a county, only that county is highlighted, but the map does not zoom in. To do this, select the map and choose the “Fix map” icon to keep the entire state view static.

This exercise includes installation instructions, data, and a tutorial. The tutorial requires students to work with the County Health Ranking dataset and assess the proportion of uninsured in CA count 63

  1. Now, when you click on a county from the bar plot, this will only highlight the county, but not zoom in. For instance, select “Monterey County”.
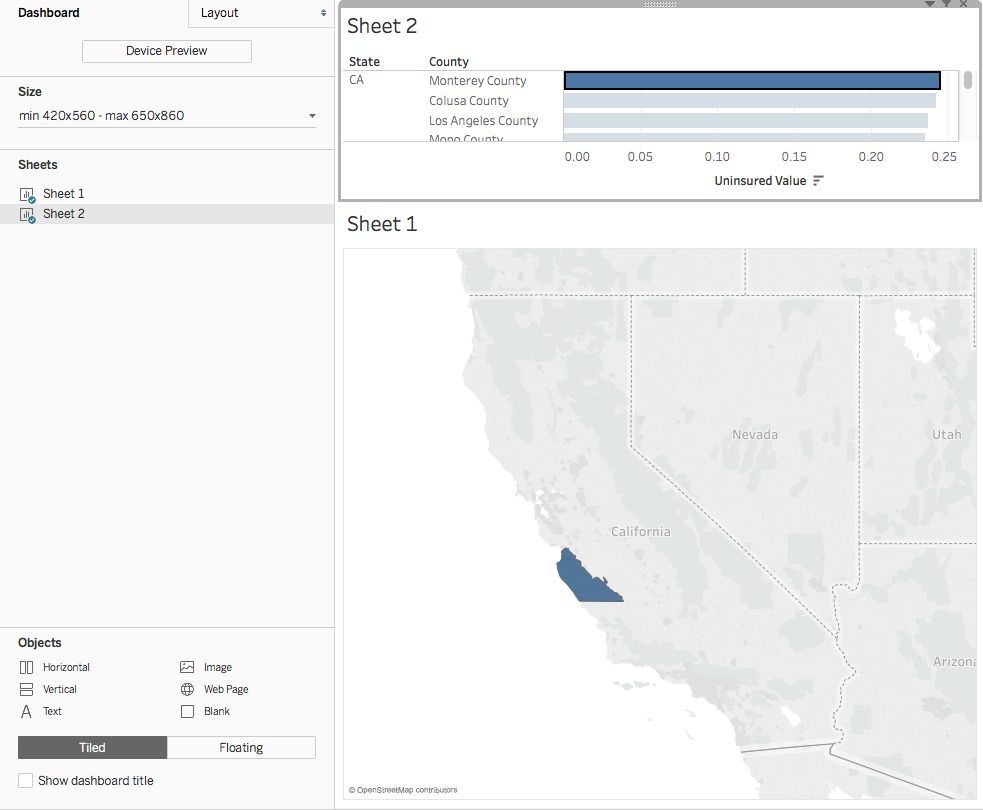
This exercise includes installation instructions, data, and a tutorial. The tutorial requires students to work with the County Health Ranking dataset and assess the proportion of uninsured in CA count 64

This exercise includes installation instructions, data, and a tutorial. The tutorial requires students to work with the County Health Ranking dataset and assess the proportion of uninsured in CA count 65

Submit answers to these questions into the unit assignment area:

  1. Which CA county has the lowest uninsured rate?

  2. What are the names of the three most northern CA county displayed on the map (those at the top of the CA map)?

  3. What is the uninsured rate for San Francisco County?