Portfolio Milestone - Intro to Business Intelligence Data Analysis of United States Data If you selected Option 1 to complete for your Portfolio Milestone in Module 2, be sure to complete this milest
10
United States Data
February 5, 2022
United States Data
Business problem.
A clothing company is planning to establish itself in Boston City. However, to take advantage of the Boston clothing market, the company must ensure that its business products and services align well with the population's needs. Targeting the right customers is one of the key things that will ensure success. Boston has a diverse population in terms of age, gender, level of educational attainment, household/individual income, among other distinguishing factors. As an investment analyst for the company, I am tasked with researching and analyzing the key factors that must be evaluated before investing in Boston city.
Business Questions.
The primary business question is whether it is more feasible for the company to target more male customers than female customers or vice versa. Refining a large market into small market segments is key to ensuring that the company adjusts its marketing and promotion strategies in a way that best attracts its target customers. According to the world population review, the population of Boston in 2021 was 696, 295. Of these, 362, 142 are female, while 332, 153 are male (World Population Review, 2022). Despite this being the case, the organization must feasibly assess and evaluate the population to determine which gender makes the perfect business customer. This will be done by comparing income levels for both genders.
The null hypothesis states that there will be no notable income differences between the male and female gender. The alternative hypothesis states that there will be significant income differences between the male and female genders residing in Boston city. A total of 128 employed participants between the age of 25-65 were randomly selected to participate in the evaluation. Out of these numbers, 64 were males, and 64 were females.
The company will evaluate the potential of each gender being the primary target customer group by studying the distribution of income among study participants. Specifically, the mean, median, and overall income distribution metrics will be assessed.

Fig 1: SAS Program for arriving at the mean salary and standard deviation among males.

Fig 2: Results for the mean salary and standard deviation among males.
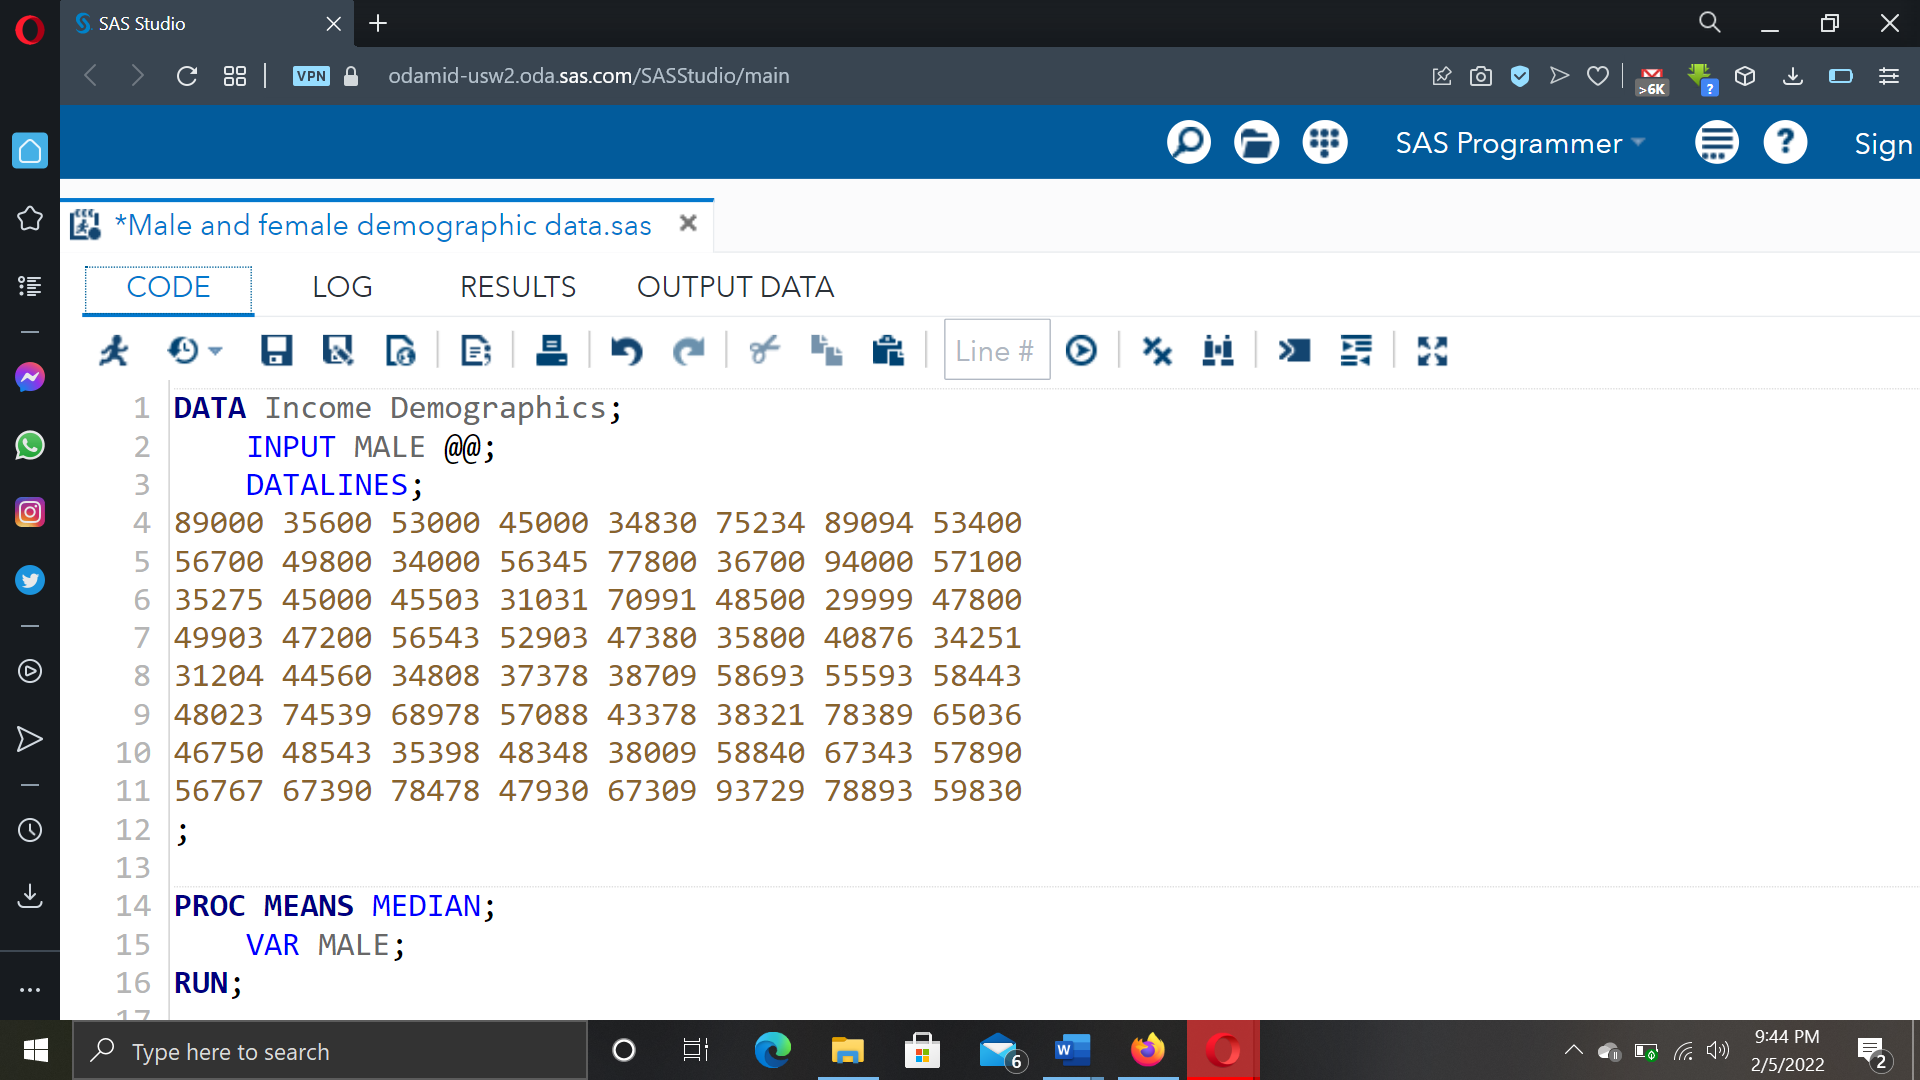
Fig 3: SAS Program for getting the median salary among males.

Fig 4: Result for the median salary for males.

Fig 5: SAS Program for arriving to the mean salary and standard deviation among females.
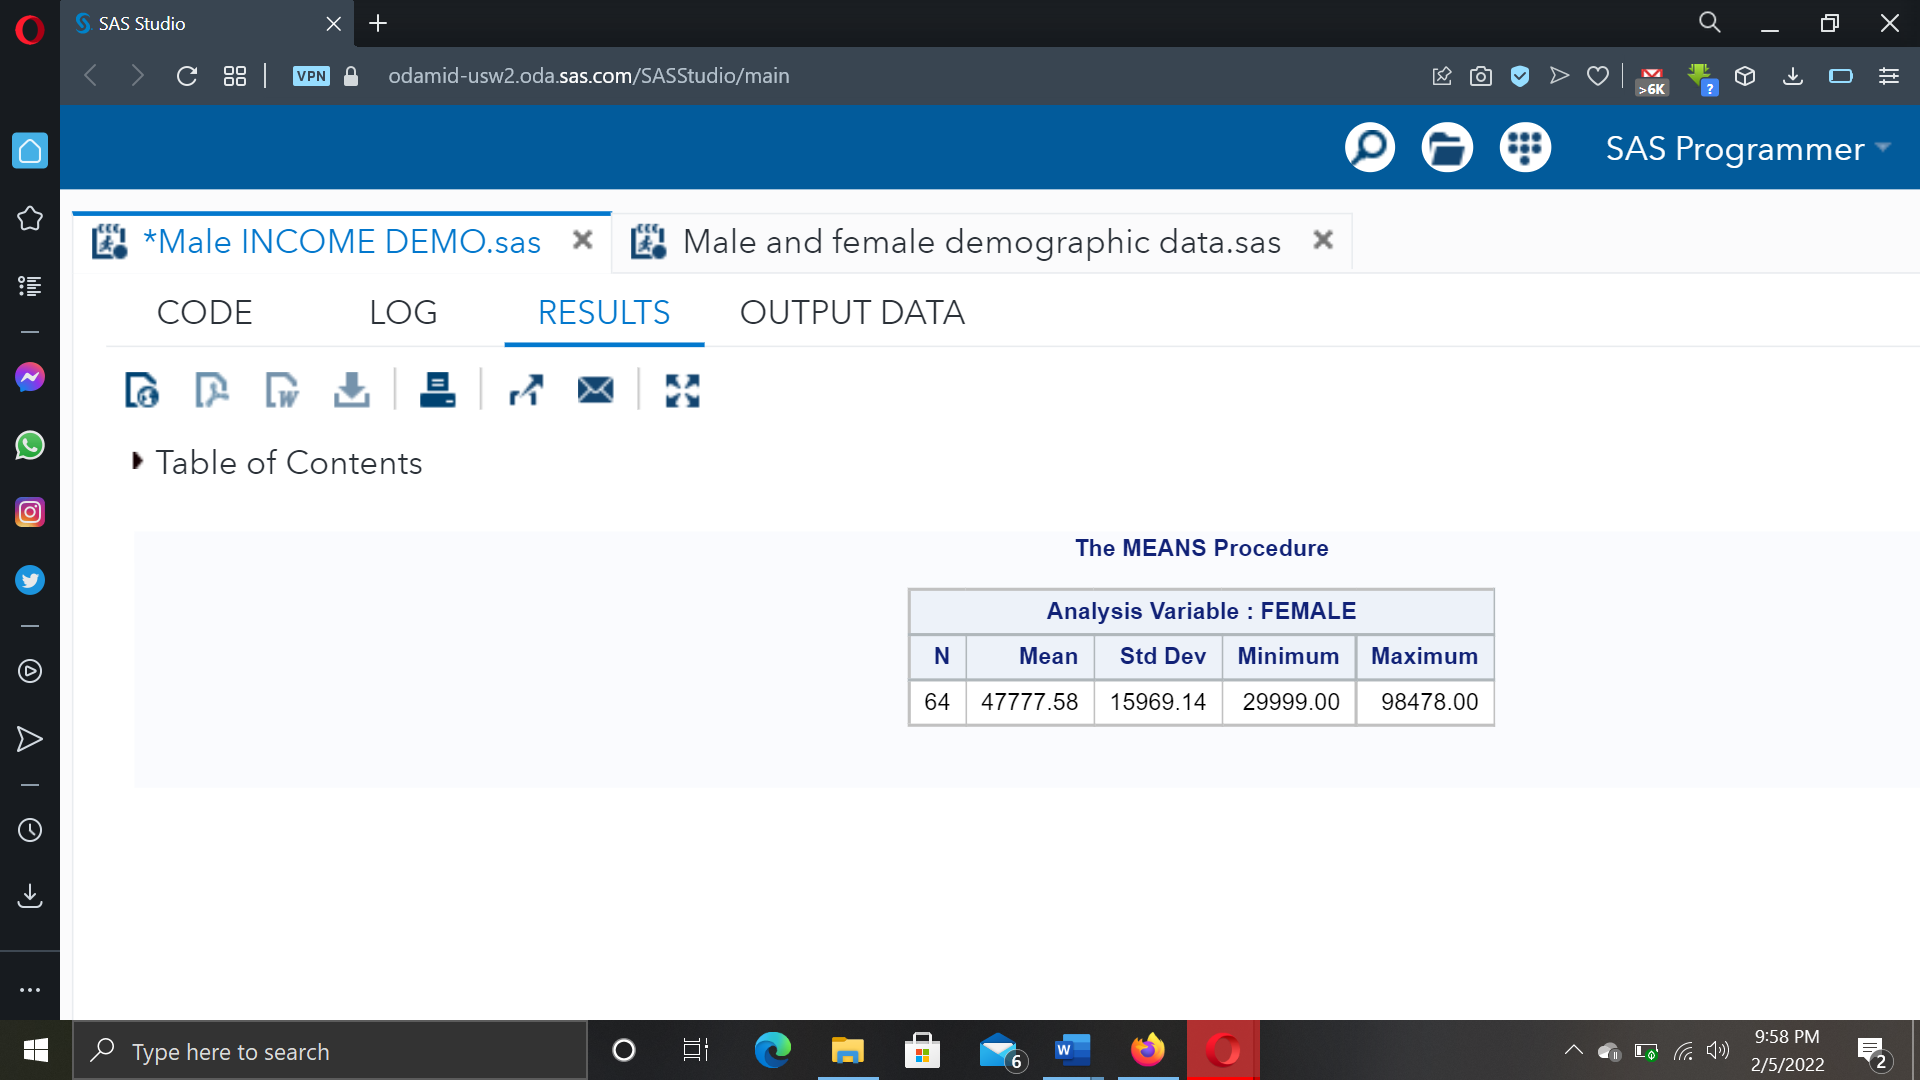
Fig 6: Results for the mean salary and standard deviation among females.

Fig 7: SAS program for arriving at the median salary among females.
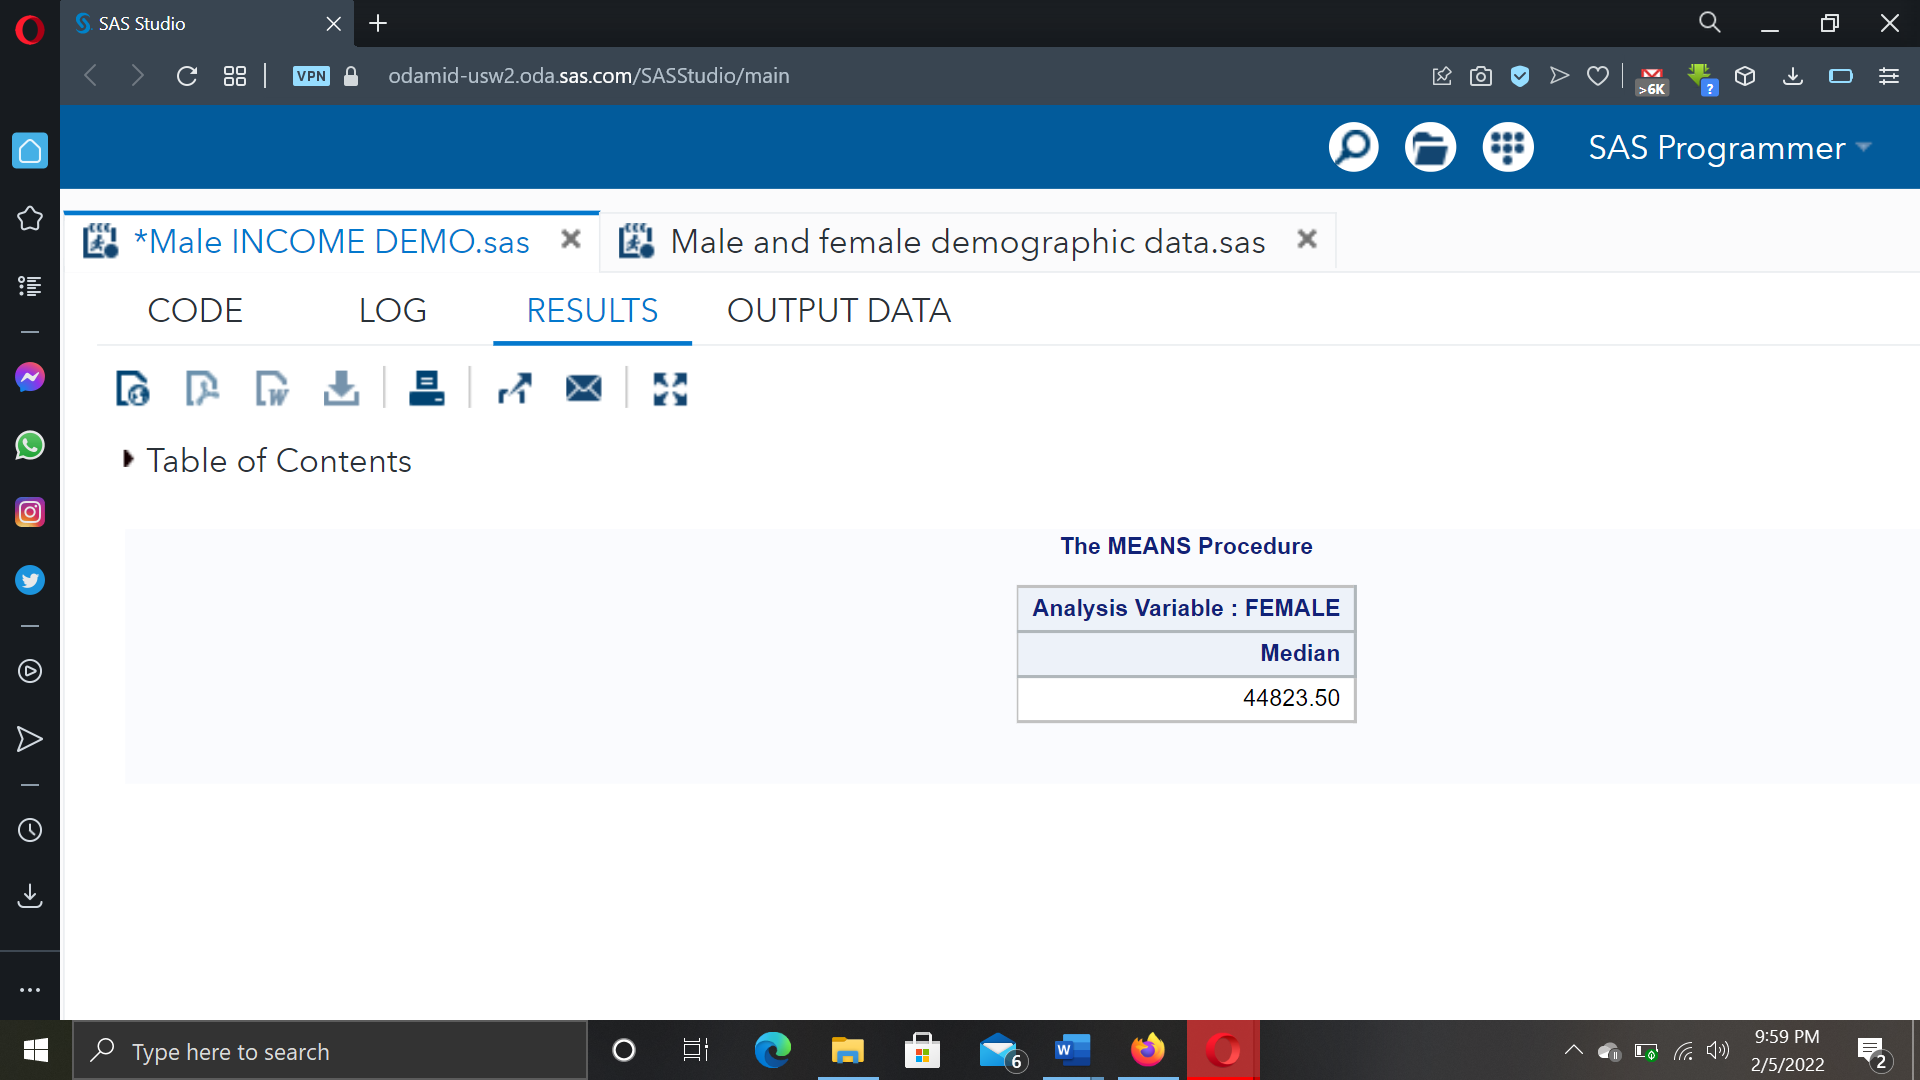
Fig 8: Results for the Median Salary among females.
From evaluation, the average salary among males is $53, 767 while the average salary among females is $47, 777. The median salary among males is $49, 851 while the median salary among females is $44, 823.
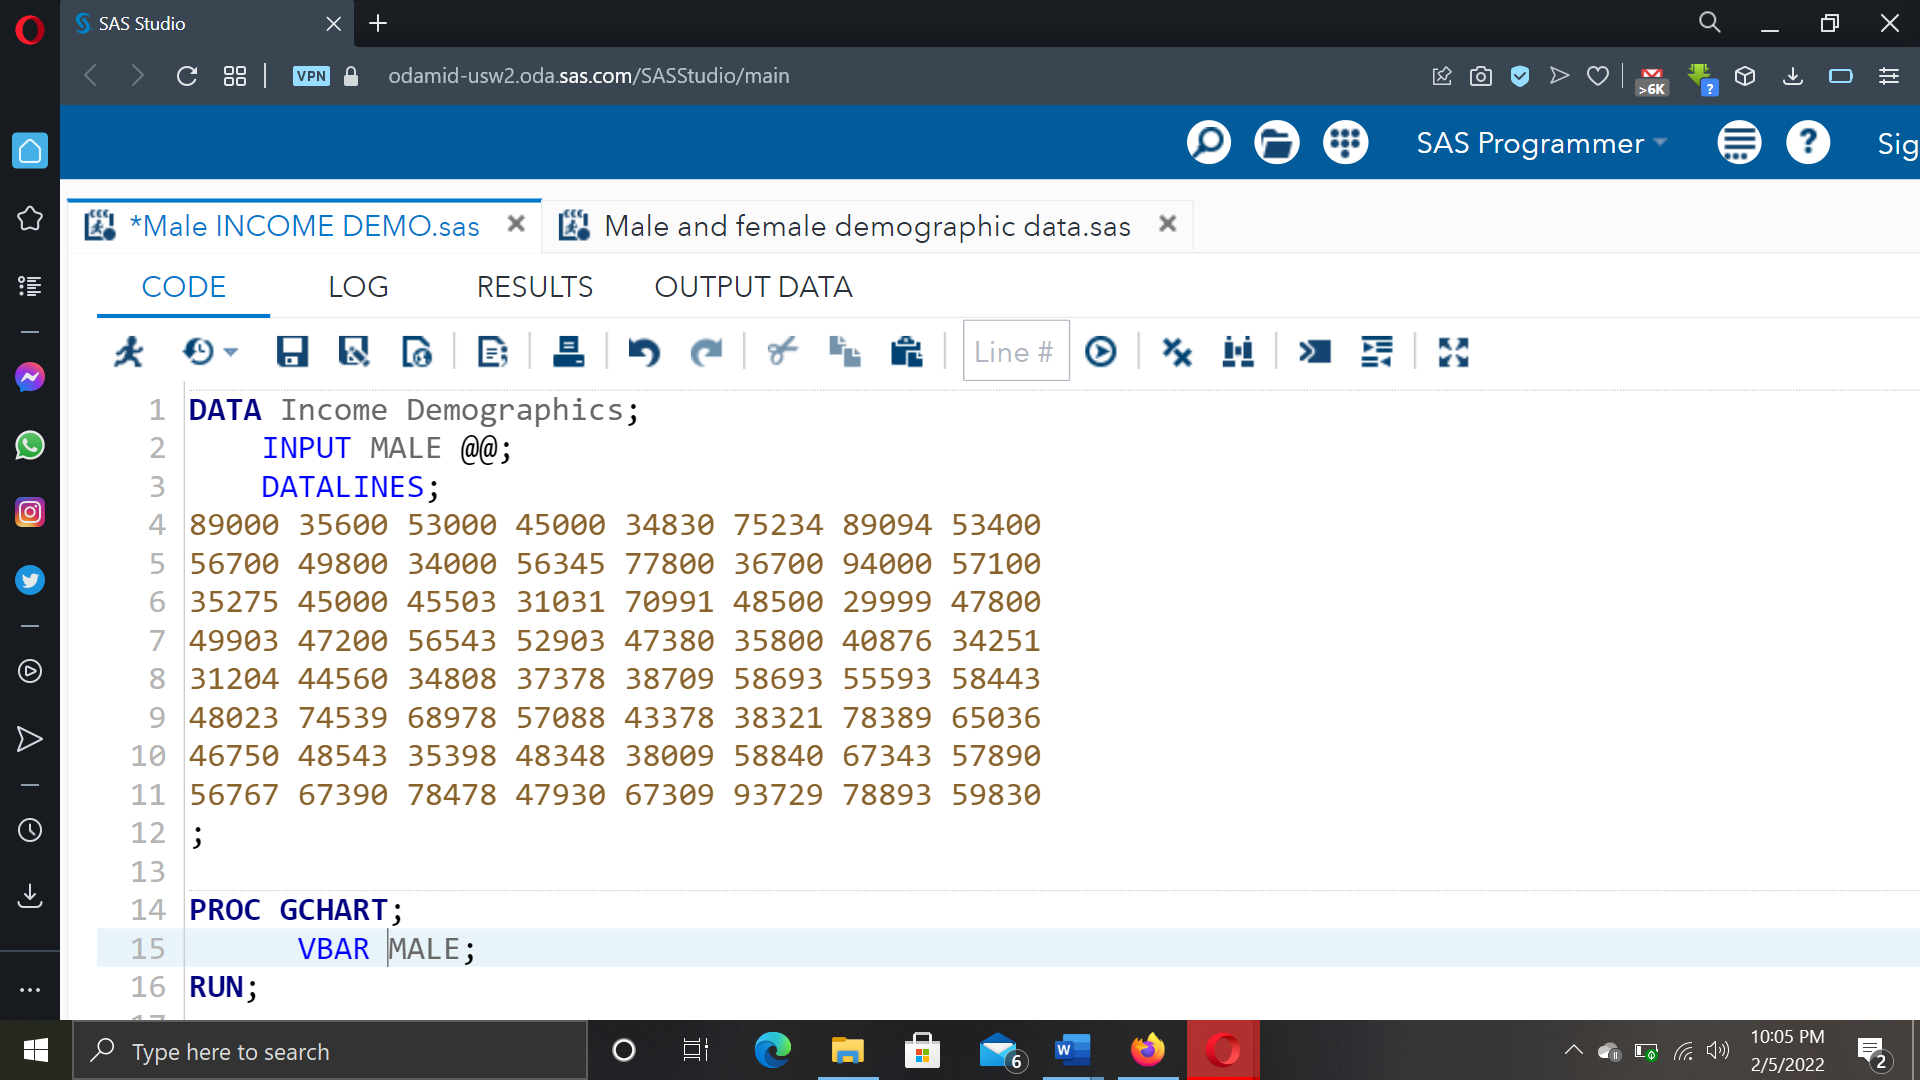
Fig 9: SAS program for the graphical representation of salary distribution among males.

Fig 10: Result shows a graphical salary distribution among the male population.

Fig 11: Results showing a graphical representation of salary among females.
According to the graphical presentation of income among the male and female gender, it is evident that income is unequally distributed among males and females. A significant difference in income distribution is evident. Therefore, the alternative hypothesis states that there will be significant income differences between the male and female genders residing in Boston city is true.
Based on the analysis of mean, median, and overall income distribution among the male and female gender, the company should focus on the male market since it has a higher purchasing power than the female gender. Therefore, business strategies, including marketing and promotion strategies, should be formulated to attract the male gender to the business. Further data analysis should make use of big data categories such as the behavioral and attitudinal categories, which align well with a company's marketing needs.
Reference
World Population Review (2022). Boston, Massachusetts Population 2022. Retrieved February 5, 2022, from https://worldpopulationreview.com/us-cities/boston-ma-population.


