Can someone complete this assignment??
How have the Olympic games athletes changed over time?
Introduction
Business Context. You work for a company that specializes in analyzing data for a variety of clients in the sports industry. Some questions that you frequently encounter include determining if a new player is promising enough to invest money in their development, which teams are the most likely to win certain matches, what events will be the most attractive to advertisers, etc.
Business Problem. As part of one of your projects, you have been asked to perform an exploratory data analysis of historical data to detect patterns in the provenance, physical profile, and other characteristics of the athletes who compete in the Olympic games. The conclusions of your analysis will help the rest of the team prepare a report for a new client who helps sports gear manufacturers find advertising opportunities.
Analytical Context. You have scraped a dataset from the Internet, which contains data for all the Olympic games from Norway 1994 to Rio 2016. It comprises data for 46,533 individual athletes and has 13 columns for each one of them. There are 68,848 rows instead of 46,533 rows in the olympics_data worksheet because some athletes have won multiple medals:
ID: A unique number assigned to each athlete
Name: The athlete's name
Sex: The athlete's sex
Age: The athlete's age at the moment of the games
Height: The athlete's height in centimeters
Weight: The athlete's weight in kilograms
Team: The athlete's team (country)
Year: The year
Season: The season
City: The host city
Sport: The sport the athlete competed in
Medal: The medal that the athlete won, if any (can be Gold, Silver, Bronze, or NA)
Won medal?: 1 if the athlete won a medal, 0 otherwise
The dataset can be downloaded from this link.
Note: Please write all your formulas in the calculations worksheet unless explicitly asked to do it in another sheet, clearly indicating the exercise they belong to. You will need to submit the Excel file along with this notebook.
Height, weight, and age
Exercise 1
1.1
Calculate the average height, weight, and age of athletes in Rio 2016 across all sports.
Answer.
1.2
Repeat Exercise 1.1 but for Sydney 2000. Have the averages changed noticeably?
Answer.
Geographic representation
Exercise 2
This is a chart of the number of countries that participated in the games from 1998 to 2016. What can you conclude from it?
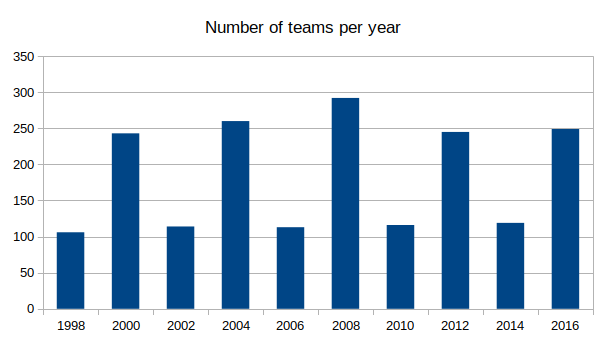
Hint: Keep in mind that Summer and Winter games are not held in the same year. In the Winter games, the number of teams is typically lower than in the Summer games.
Answer.
Exercise 3
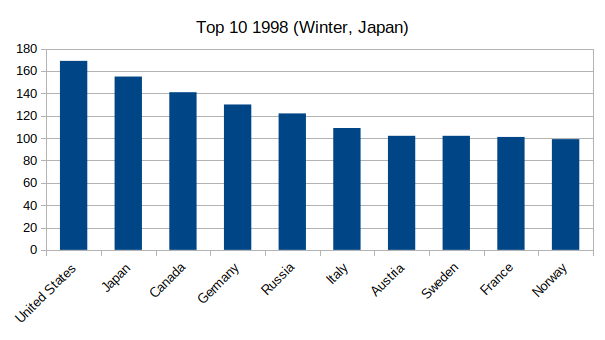
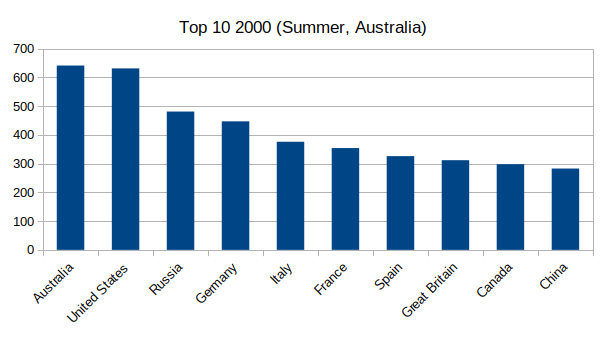
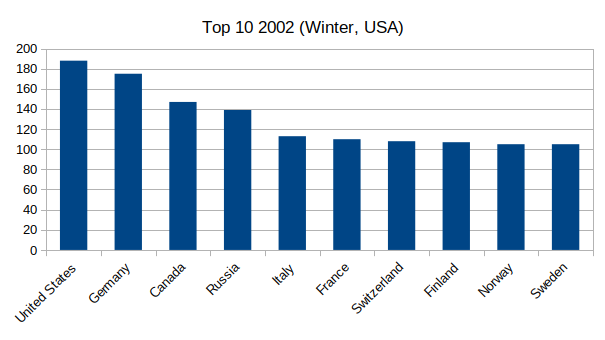
These are the top 10 countries by number of athletes sent for all the games between 1998 and 2016. What patterns can you spot?
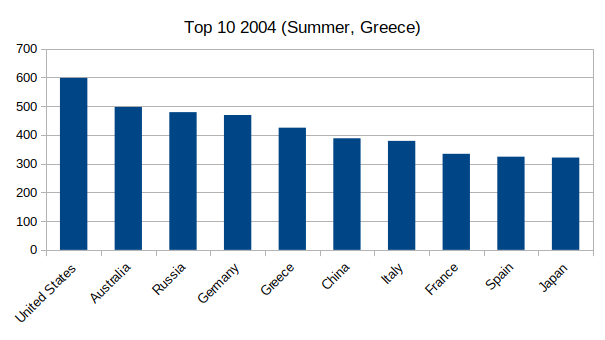
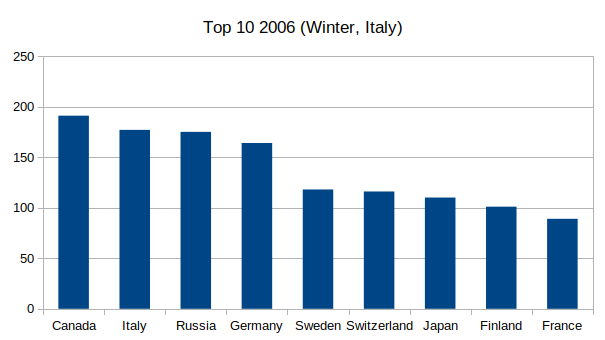
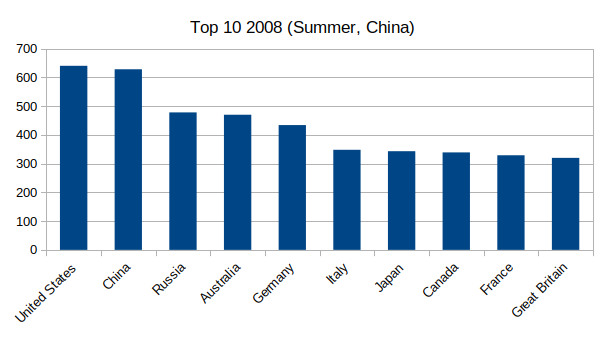
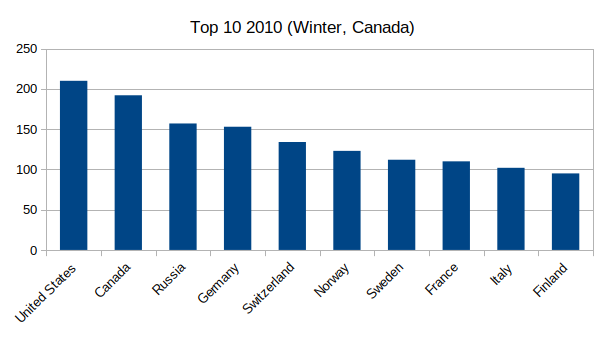
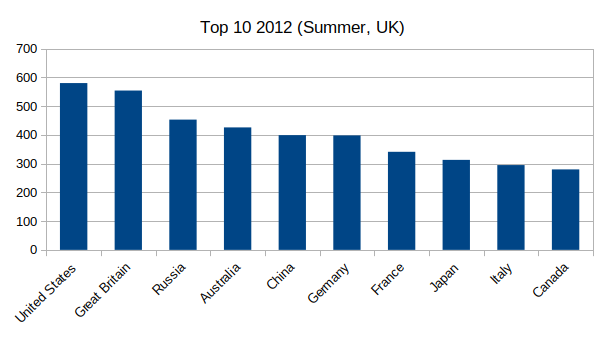
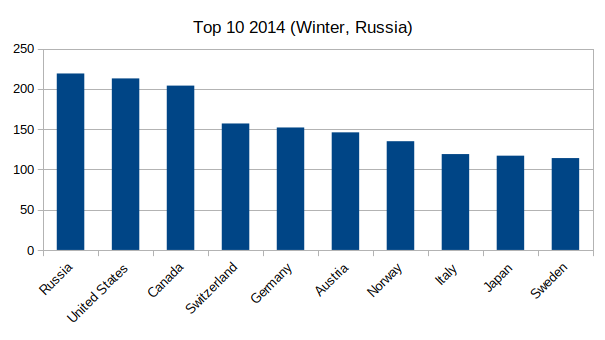
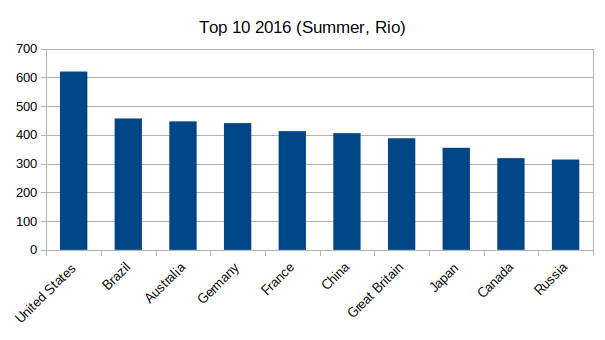
Answer.
Athletes by gender
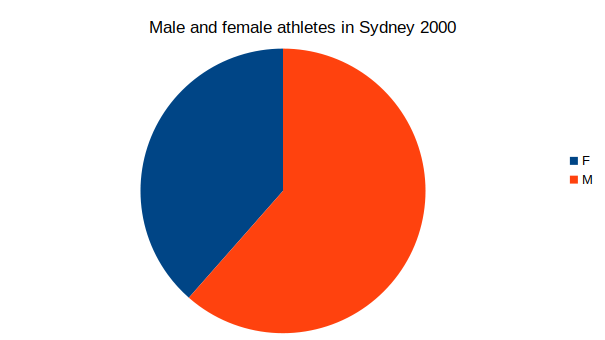
These pie charts show the number of athletes by gender in Sydney 2000 and Rio 2016:
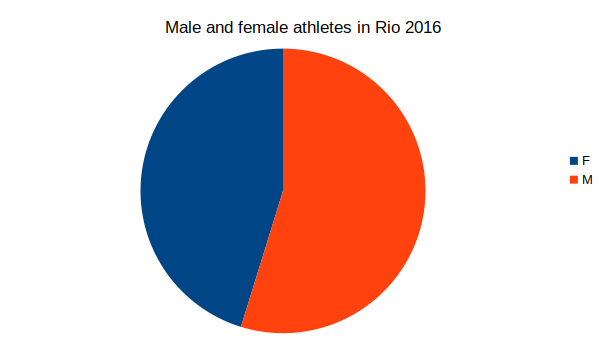
Exercise 4
4.1
We need to put labels on these pie charts. How many male and female athletes were there in Rio 2016 and Sydney 2000?
Hint: You can use the COUNTIF() function to solve this exercise. This function works very similarly to the COUNTA() function, with the difference that it only counts those cells that meet a certain condition. Feel free to look this function up on the Internet!
Answer.
4.2
Use Excel to calculate the ratio of


