Cost of Capital, Capital Structure, and Capital Budgeting Analysis - McKesson Corporation In this project, you are supposed to be a financial manager to apply the knowledge learn from Financial Manage
1.0 – Cover Page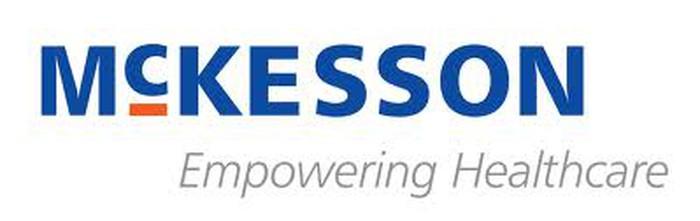
Financial Analysis Report
McKesson Corporation
Financial Management, FINC 6352 - 15408
Prof. Yixi Ning
Friday, July 29, 2022
Group 13
Analyst:
Erica Newman, Vannesa Dickson, & Rita Rhodes-Cotton
source: videoblocks.com

1.1– Table of Contents
1.0 – Executive Summary 2
2.0 – Financial Ratio Analysis 4
4.0 – Weighted Average Cost of Capital (WACC) 14
5.0 – Cash Flow Estimation 19
6.0 – Capital Budgeting Analysis 22
7.0 – Project Recommendation 24
References 25
Appendix 27
1.0 – Executive Summary


McKesson Corporation is one of the oldest and largest healthcare companies in North America offering products and services to the U.S., Canada, and internationally abroad. As a provider of pharmaceutical and medical supplies that serves leading healthcare plans, about 96%, American hospitals, upwards of 50%, and doctors, by over 20%, our team will evaluate McKesson’s business success and provide a detailed business analysis highlighting their estimated cost of debt, cost of preferred stock, cost of common equity, capital structure, and their WACC, weighted average cost of capital.
Key Metrics
Sector Healthcare
Industry Pharmaceutical
Share Price
(06/30/22) $329.53
Target Price $395
Upside +20.69%
52 Week Share $186.61 -
Price Range: $339.94
Exchange Traded NYSE
Ticker MCK
Dividend Yield 0.5763%
Annual Dividend $1.88
# Shares Out 212m
Key Ratio (As of 01 June 2022)
Market Cap 31.35B
EPS $7.23
P/E 41.40
Beta (5-year avg.) 0.66
Peer Companies:
Cardinal Health, Inc. (NYSE:CAH);
AmerisourceBergen
Corporation (NYSE:ABC)
Analysts
Erica Newman
Vannesa Dickson
Rita Rhodescotton
“McKesson operates it business in four segments, U.S. Pharmaceutical, Prescription Technology Solutions (RxTS), Medical-Surgical Solutions, and International” (Mergent, 2022) that role into primary segments of McKesson Distribution Solutions and McKesson Technology Solutions. Founded in 1833 as a Manhattan drugstore and later headquarter in San Francisco through a hostile takeover, McKesson Corporation is now headquartered in Irving, TX. Over the years, McKesson has maintained the continued improvement of its efficient operations through an initiative of cutting costs, divestment of non-essential businesses, establish service agreement partnerships with Walmart while expanding its size in the market through acquisitions between 2016 and 2018, like the acquisition of All Scripts Healthcare Solutions Inc. (Mergent, 2022).
Key investment rational and insights into McKesson’s operational and financial efficiencies, show an overall positive capital structure which is reflective of exceptional stewardship of capital by corporate governance, while also maintaining a strategy of appropriately managing risks in the industry, and using its capital to advance investment in diversified business segments. McKesson’s Market Cap is $46.90 billion as of June 30, 2022,

with a share price that is valued at $329.53 and well under its target share price of $395.00, which is undervalued by 20.7%. With these noted factors, this sets McKesson apart from its competitors as a great buy recommendation for potential investors.
In consideration of taking on a new project, our analysis and evaluation of McKesson made key assumptions upon viewing industry risk, especially considering the impact of Covid 19 on all distribution and supply chain efforts of most industries. With McKesson’s after-tax cost of debt of 0.00% and average cost of equity of 0.00%, we determined a WACC of 0.00% for McKesson. Although McKesson experienced a downturn in growth due to the pandemic in 2020 and 2021, we believe McKesson will sustain its earnings and cash flow growth considering the highly visible demand for healthcare services and products. Withstanding the industry risks we believe investing in a new project would be viable and one that investors should want to buy McKesson as it shows a conservative growth rate of 0.00% (2018-2020) and a 0.00% (2021-2028) that were used to determine its intrinsic value.
1.1 – Company OverviewAs one of Fortune 500’s 9th ranked companies, McKesson Corporation is a leading and global pharmaceutical drug distributor and information technology company. McKesson delivers a comprehensive selection of prescription and generic pharmaceuticals, health and beauty care products, as well as medical supplies and surgical equipment and technology services to customers. (Staff, 2022). Founded in 1833, by John McKesson, and based in Texas with over 30 distribution centers in US, Canada, and Europe, the company has over the year’s diversified it’s healthcare services through strategic growth strategies via acquisitions or business ventures that expanded or complemented their business structure.
Through diversification, 80% of McKesson Corporation’s revenue comes from US Pharmaceuticals, 15% is generated from the international distribution and wholesale services in Europe and Canada, with the remaining 5% generated from Medical-Surgical Solutions and RxTS services (D&B Hoovers, 2022). Of note, sales to McKesson's ten largest customers account for approximately 52% of total revenues. Sales to its largest customer, CVS Health Corporation (CVS), account for approximately 21% of total revenues. McKesson’s overall financial performance reflects an 11% increase in total revenue in 2022 to $264B from 238B in 2021. Bouncing back from a net loss of $4.3B in 2021, mainly due to the impact of Covid on distribution channels and the economy, the company had a remarkable 130% increase in net income to $1.3B in 2022. See Figure 1.1
Figure 1.1McKesson Revenue by Segment & Net Income 
Source: McKesson 10K 2022
2.0 – Financial Ratio Analysis “Financial ratio analysis compares the results in different line items of the financial statements. The analysis of these ratios is designed to draw conclusions regarding the financial performance, liquidity, leverage, and asset usage of a business (Bragg, 2022)”. Ratio analysis are mainly used by business managers to fairly compare between a company and industry across time. The data contained in financial statements, the balance sheet, income statement, and statement of cash flows, are used by managers to gain information from financial ratios to make rational financial decisions that improves financial strength, profitability, efficiency, management effectiveness, and valuation, for the business and influence potential investors. Financial ratio analysis and interpretation is used to evaluate six main areas of interest to managers and investors; liquidity, coverage, solvency, profitability, efficiency, and market prospects (GoCardless, 2021). The results can be compared to industry averages and to the results of benchmark companies, to see how a business is performing in comparison to other organizations (GoCardless, 2021).
Our analysis of McKesson Corporation’s Key financial ratios will review the past 5 years and their most current year for their financial stability and growth while also displaying a comparison to their top two competitors, Amerisourcebergen Corporation (ABC) and Cardinal Health, Inc. (CAH). See Table 2.0.
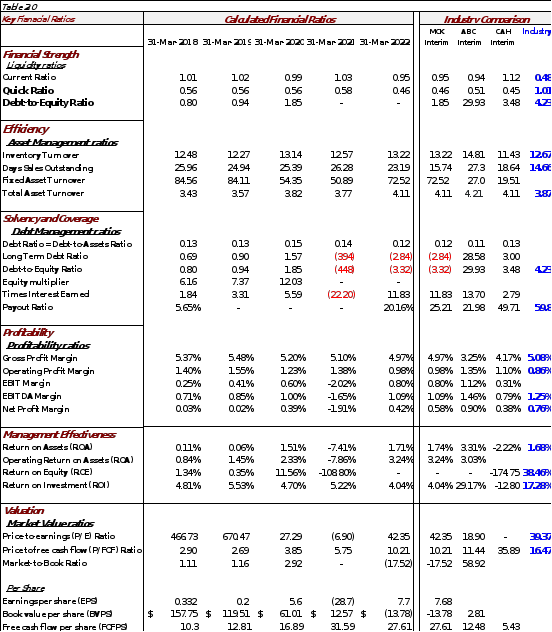
Compared to its industry peers historically, McKesson has consistently held the most growth in profitability and stability. However, with its distribution greatly impacted by the pandemic, McKesson has experienced an extreme decline in ROE and EPS, with similar effects felt by its peers Amerisourcebergen Corporation (ABC) and Cardinal Health, Inc. (CAH) See Figure 2.0 Over a 5year period, McKesson’s revenue growth has lagged 13% behind its peer ABC, but well ahead of CAH with a 27% revenue growth overall. Although ROE was negative for all, McKesson has the largest ROC growth of its peers averaging 119% while it lags behind ABC and CAH in Total Debt / Equity. All hope is not lost as McKesson EPS skyrocket back to its norms with an EPS of 7.23 in 2022. Although slightly outperformed by ABC with and EPS of 8.2, McKesson is doing well as the economy recovers.
Figure 2.0.1 McKesson Peer Industry Benchmarks
Source: D&B Hoovers
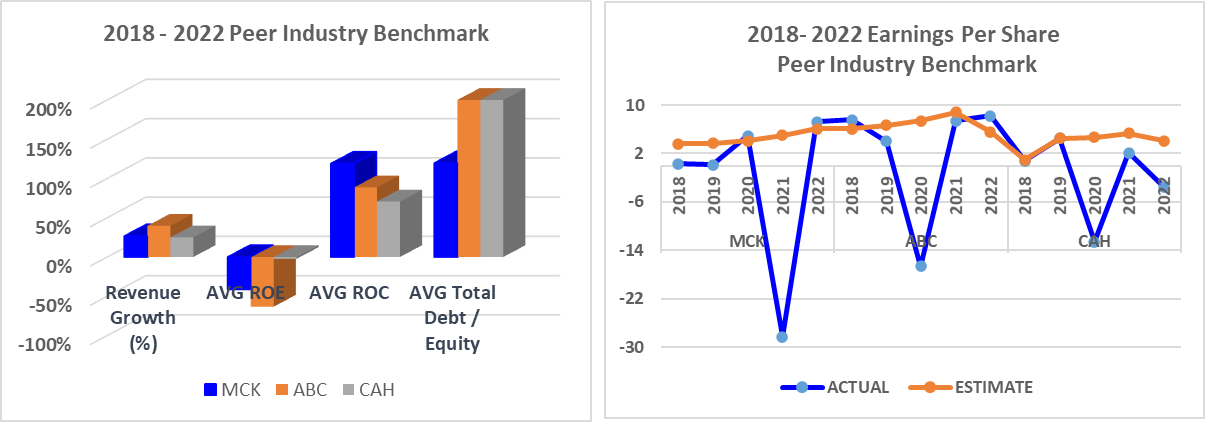
2.1 – Liquidity Ratios“Liquidity analysis is used to analyze a company’s abilities to meet its immediate debt obligations out of its current assets. The two key financial ratios used to analyze liquidity are current ratio and quick ratio (GoCardless, 2021)”. The current ratio is sometimes referred to as the working capital ratio while the acid test ratio is defined as the quick ratio. Each of these ratios use balance sheet line items that take into account current assets, current liabilities, and inventories as a measure to determine a margin of safety in a firm’s accessibility to funds to readily pay current debt without seeking external sources in the event of an unforeseen event. As a financial metric, liquidity ratios speak to a firm’s ability to pay short term debt obligations.
McKesson has consistently and relatively held a healthy posture of liquidity similar to that of its peers ABC, CAH, and the S&P Healthcare Sector HCX, with a Current Ratio averaging ~1 or below and a Quick Ratio ~.58 and below over the past 5 years. The gift of having such financial flexibility has enabled McKesson to efficiently and effectively make use of on hand cash and short-term obligations to champion key acquisitions from 2018 to present that helped to diversify its product offerings and business lines over the years. For example, in 2018, McKesson completed its acquisitions of intraFUSION, Inc., BDI Pharma, LLC, and Uniprix Group for net cash consideration of $485,000,000, which was funded from cash on hand. Although McKesson Management has had great success being great stewards of its free cash flow over the years, they must remain cautious considering a slight dip in both current and quick ratios in 2021 going into 2022 due to the impact of Covid on the overall global economy.
Figure 2.1 Liquidity Ratios
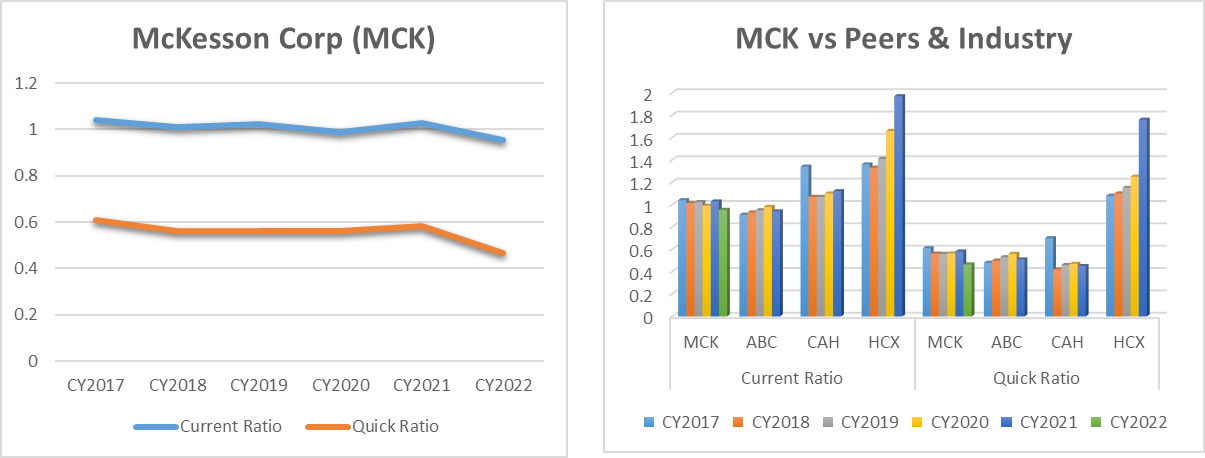
Source: D&B Hoovers
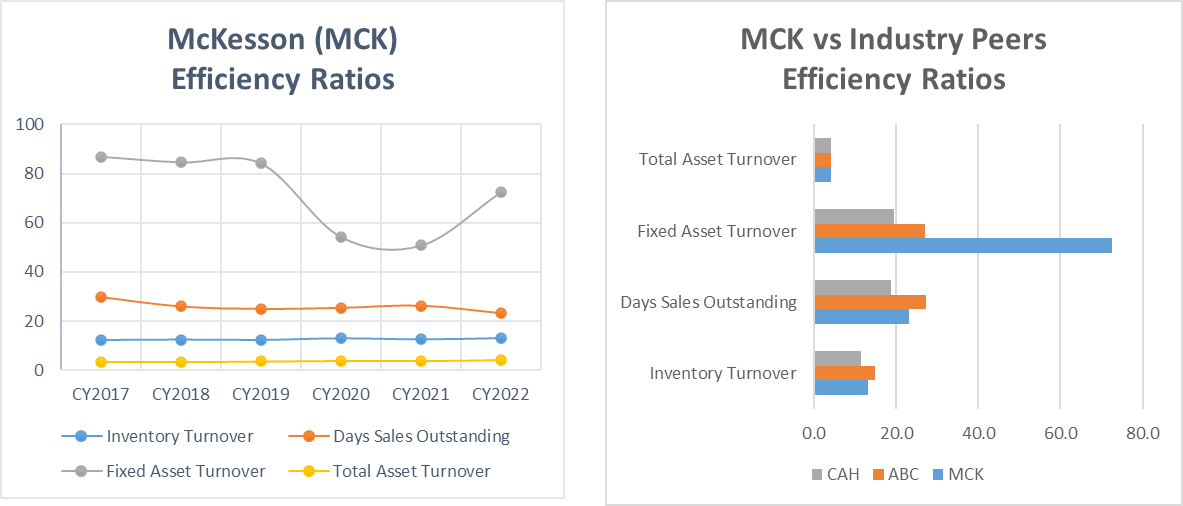
2.2 – Asset Management RatiosAsset Management Ratios or activity ratios are considered efficiency ratios that measure how efficiently a firm’s management is using its assets to generate sales and maximize profit (Calrson, 2020). A firm’s management uses four key ratios to evaluate an entity’s efficiency: Inventory Turnover, Days Sales Outstanding, Fixed Asset Turnover, and Total Asset Turnover. These activity ratios provide a gauge of a company’s operations by determining average number of days it takes to collect on customer accounts; the average number of days to pay vendors; the effectiveness of a firm’s asset mix to generate sales. Typically, a higher ratio number is preferred as it reflects greater efficiency in turning over assets, inventory, and receivables.
In the case of McKesson, their 5-year trend reflects an overall steady and efficient stewardship of the company’s inventory, receivables, and assets even though it appears that McKesson encountered a decline in fixed asset turnover between 2019- 2021 as seen in Figure 2.2 below. This decline can be attributed to the impact of the coronavirus pandemic on the overall economy, industry, and the supply chain distribution. Despite the drop, McKesson appears to be on the upswing back to its normal asset turnover levels into 2022. Considering McKesson’s Pharmaceutical Distribution business line, it is very important to operate with low cost of goods sold and highly efficient inventory management driving even better margins. As for McKesson’s efficiency compared to its industry peers in 2022, McKesson, in general, appears to not be as efficient as ABC, in the areas of Inventory Turnover and Days Sales Outstanding with lower ratios of 13.2 and 23.2 respectively compared to ABC topping out at higher ratios of 14.8 for inventory and 27.3 for Days Sales Outstanding. However, McKesson’s efficiency in managing Total Asset turnover is steady with its peers while Fixed Asset turnover far greatly exceeds the efficiency of its peers in generating sales from its property, plant, and equipment with a ratio of 72.5.
Figure 2. 2 Asset Management Ratios
Source: D&B Hoovers
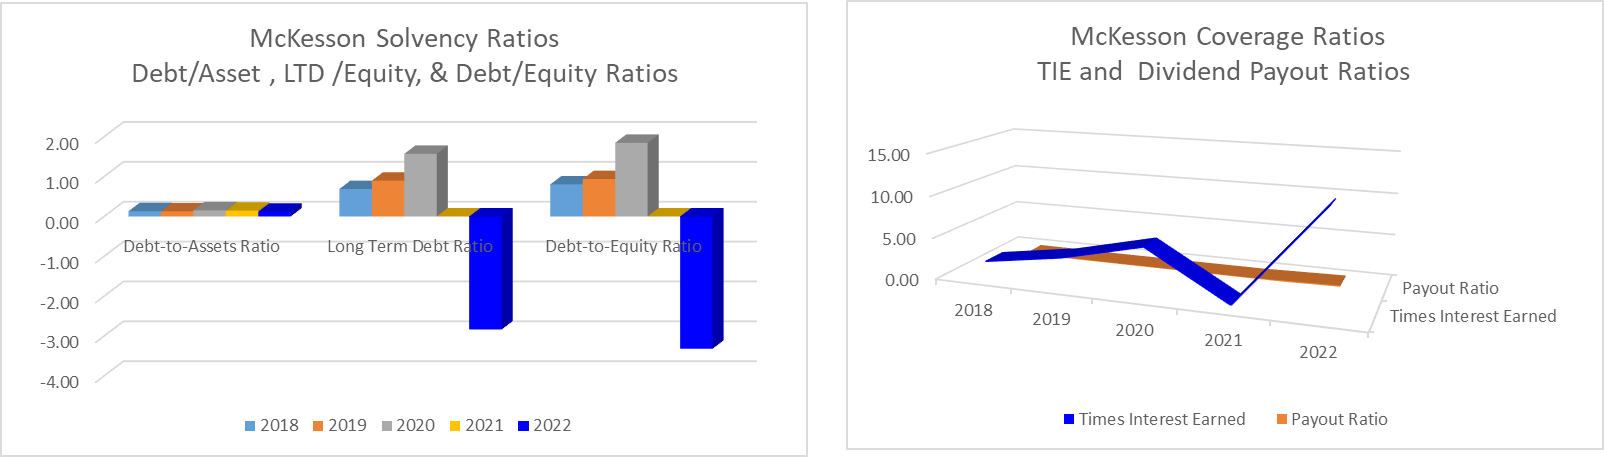
2.3 – Debt Management Ratios“Debt Management ratios include solvency and coverage ratios that allow financial managers to appraise the position of a firm with regard to the debt financing, or financial leverage as well as coverage of debt obligations used to finance their operations. The solvency ratios gauge how much debt financing the firm uses as compared to either its retained earnings or equity financing (Calrson, 2020)”. Coverage ratios measure the degree to which a company can cover financial debt obligations and related costs. These ratios complement solvency ratios allowing managers to view a complete picture of the company’s debt position.
Key debt solvency ratios include debt-to-assets, long-term debt-to-assets, and debt-to-equity ratios. Debt coverage ratios include times interest earned and debt service coverage ratios which measure how well an entity can cover total debt and interest payments on debt. A good debt ratio is typically below 1.0, but it also depends on the type of business and industry. A debt ratio that is 2.0 or higher is seen as risky while a negative debt ratio is seen as very risky and may indicate a risk of bankruptcy for the company.
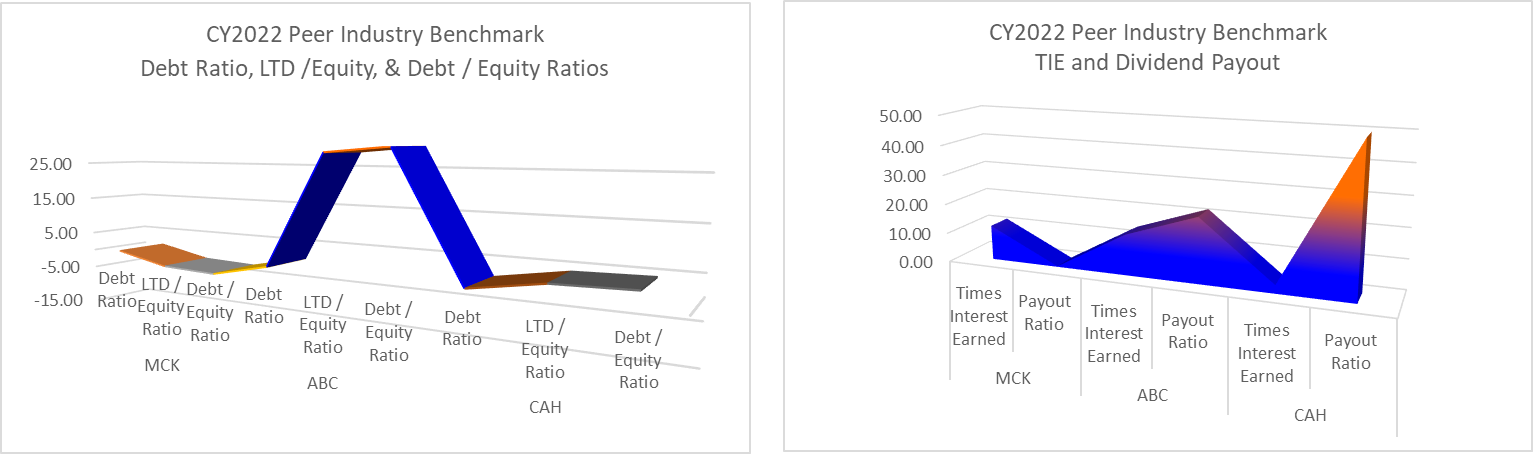
McKesson’s 5-year trend of its debt ratio or debt-to-asset ratio reflects a constant and steady debt-to-asset ratio that averages about ~.14 with .12 identified for 2022. In comparison to industry peers ABC and CAH, McKesson’s debt ratio is in sync. However, when looking at McKesson’s long-term debt ratio and debt-to-equity ratio trend over the last 5 years, it has been on the decline, so much so it has declined to less than zero since 2021. This decline is indicative of the impact of the Covid pandemic on the healthcare services and distribution industry and signals issues with the company’s current financing. Compared to its peer’s ABC with a debt-to- equity ratio of 28.58 and CAH with a debt-to-equity ratio of 3.0, McKesson debt-to-equity ratios presents a risk to its shareholders. See Figure 2.3.1 With that said, McKesson, who has always been a great steward managing its financial operations may need to consider a reorganization of or sell off of some of its non-performing assets. To that effect, in 2022, McKesson sold off its European assets and is currently lining up to have a stronger concentration of is business mostly in the US and Canadian markets. A few key sales include, sell of its 30% interest in the German pharmaceutical wholesale joint venture to Walgreens Boots Alliance; sale of its Austrian business to Quadrifolia Management GmbH for approximately $276,000,000; and the sale of its retail and distribution businesses in the U.K (Mergent, 2022).
Although McKesson’s debt-equity ratios were in decline ending 2021, their ability to cover interest obligations and payout dividends bounced back by year-end 2022. With a TIE coverage of 11.83 in line with the industry and peer ABC 13.70 but above that of CAH, McKesson has clearly taken their financial stewardship to test by improving their financial position. With an industry dividend payout of 59.9, McKesson’s 25.21 shareholder payout ratio is far behind compared to its peer’s payout, ABC 21.98 and CAH 49.71. See Figure 2.3.1
Figure 2.3.1 Debt Management Ratios
Source: D&B Hoovers & Gurufocus
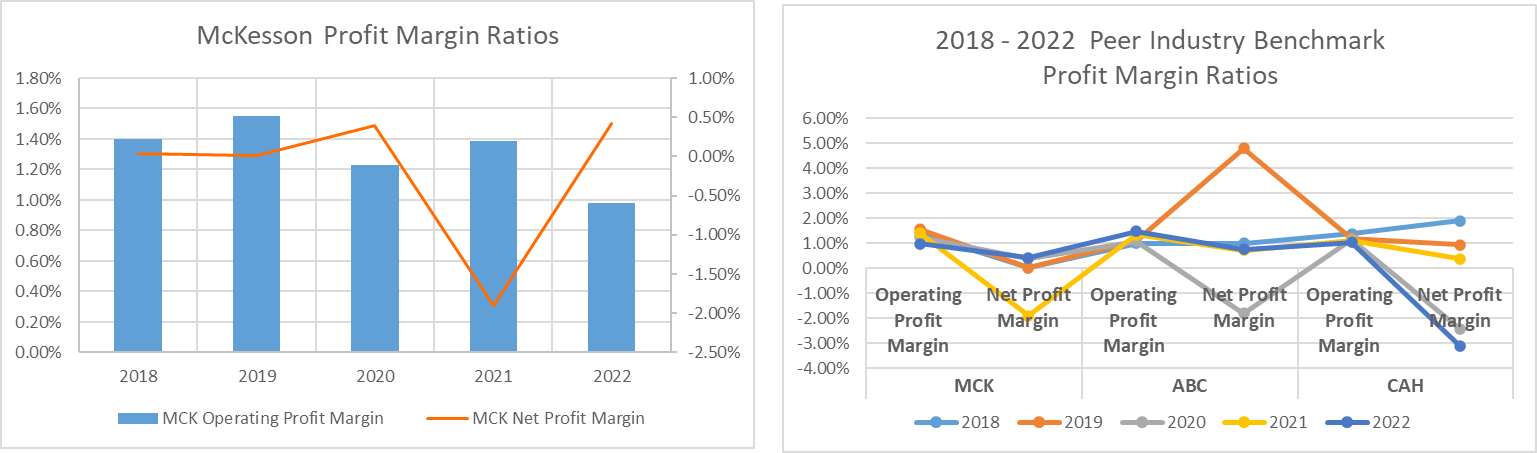
2.4 – Profitability RatiosProfitability analysis is used to analyze a company’s ability to make money from its sales or operations, balance sheet assets, or shareholder’s equity and are the summary ratios that sum up the effects of liquidity management, asset management, and debt management on the firm (Calrson, 2020). There are four essential financial ratios used to analyze profitability, net profit margin, return on total assets (ROA), basic earning power, and return on equity (ROE). As an indicator of how efficient a company generates profit and value for its shareholders, high ratio results are most favorable.
Although McKesson’s profit margin has trended down over the past 5 years to 0.98%, their operating profit margin is slightly ahead of the overall industry of only 0.86%. In comparison to its immediate peers however, McKesson is lagging behind ABC and CAH, each with an operating profit margin of 1.35% and 1.10% respectively. McKesson’s Net Profit Margin earnings have been relatively low compared to the industry. The impact of the coronavirus pandemic clearly impacted McKesson’s net profit margin earnings in 2021 with a negative net profit margin of -1.91%, however, they were able to recover in 2022 to 0.58%. Although McKesson’s traditionally dominating share of the market and size have enabled it to gain negotiating advantages with manufactures and customers, their usual differentiating factor of minimizing operating costs and costs of goods sold were challenged. The overall industry maintained a net profit margin of 0.76% which is greater than McKesson. In particular, industry peer ABC’s net profit margin of 0.90% in 2022 is far ahead of McKesson while CAH is slightly below at 0.38%. See Figure 2.4.1
Figure 2.4.1 Profit Margin Ratios
Source: D&B Hoovers & Gurufocus
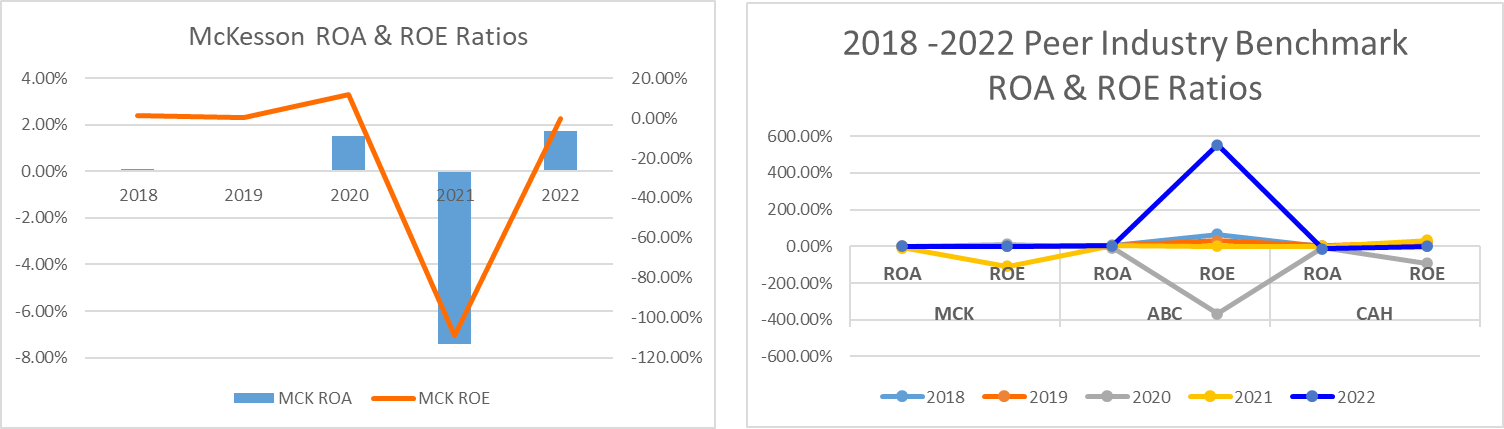
As for McKesson’s Return on Assets (ROA) and Return on Equity (ROE), McKesson has traditionally sored over its peers. As a measure of McKesson’s management effectiveness, over the past 5 years, their ROA and ROE ratios have trended upward, (ROA 0.11% (2018) to 1.51% (2020) & ROE 1.34% (2018) to 11.56% (2020), with the exception of the impact of Covid in 2021 which declined to -7.41%(ROA) and -108.80%(ROE). As of year-end 2022, McKesson financial managers have gotten to work by effectively increasing their ROA to 1.74% which is in sync with overall industry, but lagging behind peer ABC whose ROA is 3.3% and well ahead of CAH’s negative ROA of -2.22% as of 2022. It appears that McKesson is not alone in recovering from the impact of the pandemic on the economy as its immediate peers ABC and CAH each have negative ROEs that are below zero. See Figure 2.4.2
Figure 2.4.2 ROA & ROE Ratios
Source: D&B Hoovers & Gurufocus
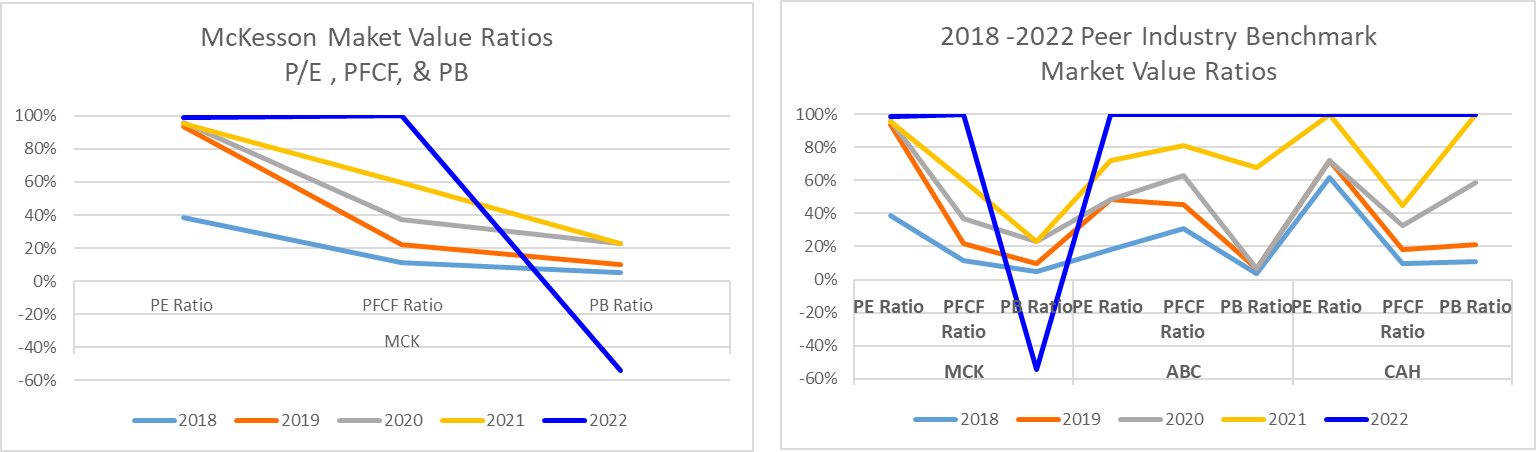
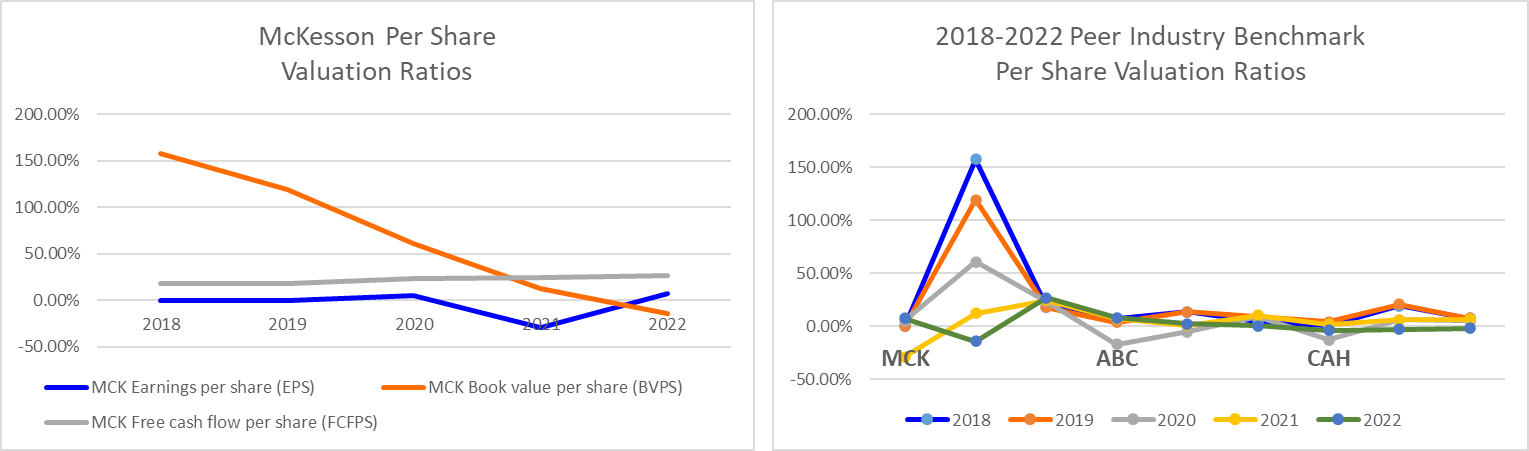
2.5 – Market Value RatiosMarket value ratios shows how much investors are willing to pay for the stock, how well the business generates cash flow, and gives the financial managers an indicator of how investors view the value of the company. Three common ratios used for this evaluation are P/E Ratio, P/Cash Flow Ratio, and Market/ Book Ratio.
Over the past 5 years, McKesson when compared to its peers has shown growth in profitability and consistency, although fluctuated. The impact of the coronavirus on the global economy and healthcare industry has greatly impacted that growth and has forced financial managers to tighten their stewardship of the company’s finances while still maintaining the confidence of investors. Although ABC has shown the greatest revenue growth over the past 5 years compared to McKesson and CAH, McKesson has taken steps to bounce back in 2022 with P/E ratio of 42.35 which is well ahead of the overall industry and its peers ABC with only a P/E ratio of 18.9 and CAH below zero for 2022. In regards to EPS, McKesson’s performance over it peers ABC and CAH is greater.
Figure 2.5 Market Value & Per Share Valuation Ratios
Source: D&B Hoovers & Gurufocus
3.0 – Estimated Capital Structure
The capital structure of an organization refers to the mix of debt and/or equity used to finance its operations and assets. A debt-to-equity ratio or a debt-to-capital ratio are widely used to define the financial structure of a corporation. A company's operations, capital expenditures, acquisitions, and other investments are financed by debt and equity capital. Managers will balance the two to create the appropriate capital structure regardless of whether businesses choose to finance their operations with debt or equity. The debt-to-equity ratio that results in the company having the lowest weighted average cost of capital is often used to determine the ideal capital structure for corporations.
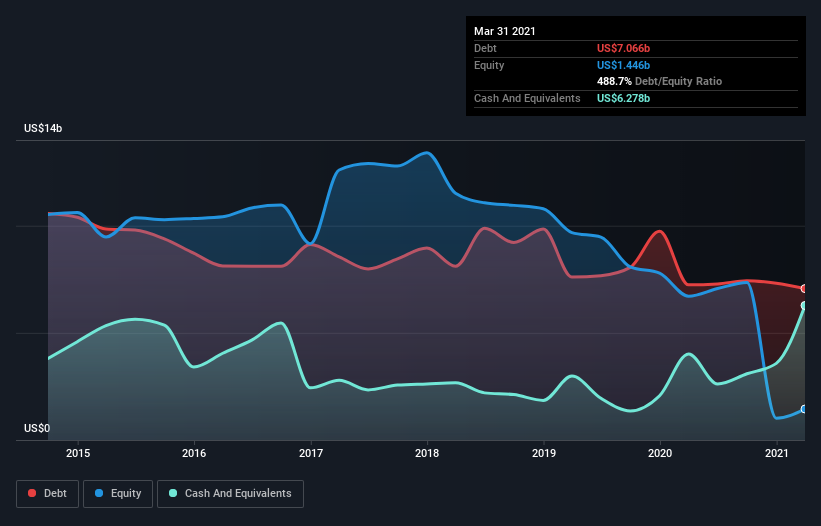
McKesson has a low net debt to EBITDA ratio of only 0.20. Additionally, its EBIT more than 15.2 times exceeds its interest expense. We therefore have a casual attitude toward its extremely prudent use of debt. Another positive development is that McKesson's EBIT increased by 11% over the previous year, further enhancing its capacity to control debt. When examining debt levels, it makes sense to start with the balance sheet. However, future earnings will ultimately determine McKesson's capacity to maintain a healthy balance sheet going forward (Pettit, 2003). The last point is that a business can only pay off debt with actual cash, not accounting earnings. The next natural step is to determine what percentage of that EBIT is actually matched by free cash flow. Fortunately, for any shareholders, during the past three years, McKesson has generated more free cash flow than EBIT. We experience the same kind of excitement as the crowd at a Daft Punk concert when there is that kind of significant cash conversion. The chart below shows that McKesson had US$7.07b in debt in March 2021.
Figure 3.0 McKesson Debt Equity
The ratio of debt to equity used by a corporation to finance both its current operations and potential future expansion is known as its capital structure. Equity capital derives from both ownership shares in and claims on a company's future cash flows and profitability (Exley, 2006). Debt examples include things like loans and bond issuances, whereas equity examples include things like common stock, preferred stock, and retained earnings. Additionally regarded as a component of the capital structure is short-term debt. A firm funds its overall operations and expansion through its capital structure. Borrowed funds that must be repaid to the lender, frequently with interest charges, constitute debt. Without the need to recoup any investment, equity is the right to ownership in the business.
The ideal capital structure of McKesson Corporation is between 30 and 49 percent, and to be prudent, medium company risk is taken into account. Given that it has been largely stable and falls within the desirable range, the target capital structure is estimated to be 45.7 percent using the average of the last 8 years. It looks as if management might be keeping its capital structure conservative when compared to its rivals in order to be on the lookout for potential acquisition opportunities in the future.
4.0 – Weighted Average Cost of Capital (WACC)
When analyzing the financial position of McKesson Corporation, it is paramount to note the Weighted Average Cost of Capital (WACC). Frank & Shen (2016) defines WACC as an average capital from all sources like common stock, bonds, preferred stock, and debts. McKesson Corporation always uses it to find the financial cash flows by using various components. The thing that should be deduced from this analysis is to see whether McKesson Corp should reject or accept the proposed project, which will rely on the ability of the company to finance itself to remain profitable. The tables below show that McKesson Corp has a 3.04% after-tax cost of debt. Also, the table shows the cost of equity shown as 19.50%. The analysis utilized two approaches to determine the cost of equity: CAPM and Bond-yield-plus-premium. The WACC was found to be 5.5%, which is the highest because of the lower weighted debt.
4.1 – McKesson WACC % CalculationThe weighted average cost of capital is the amount that a company anticipates charging on average to all of the holders of its securities in order to fund its assets. The firm's cost of capital is another name for the WACC. In general, debt and equity are used to finance a company's assets. The WACC is the sum of the expenses of these funding sources, each of which is weighted according to how frequently it would be appropriate to employ them in a particular circumstance. The amount of interest the corporation is required to pay on each dollar of funding can be determined using a weighted average.
WACC= E / (E + D)* Cost of Equity + D / E + D)*Cost of Debt * (1 - Tax Rate)
Mostly because raising capital is costly. A corporation is making excess returns if it achieves a higher ROIC percentage than it costs it to raise the cash required for that investment. As growth accelerates, the value of a company that anticipates making positive surplus returns on new investments will rise, as opposed to a company that generates returns that fall short of its cost of capital and loses value over time.
4.2 (4.1.2) – Component Cost of Debt EstimationThe effective interest rate that a business pays on its debt, such as bonds and loans, is known as the cost of debt. The two primary elements of a company's capital structure are stock and debt. Calculating the cost of debt requires determining the average interest rate paid on all of a company's liabilities (Banerjee, 1999).
The cost of debt after tax shows that that interest is tax-deductible.
4.3 (4.1.3) – YTM –Yield to Maturity ApproachBased on a bond's current market price, the yield is determined using the Yield to Maturity formula. The yield to maturity is used by debt funds to calculate returns. However, it modifies in reaction to altering market conditions. The YTM of an open-ended Debt Fund differs from the scheme's real returns as a result in practice.
YTM = before tax cost of debt which is 3.07%.
| Table 4.3 - YTM - Yield to Maturity Approach | |
| Coupon | 30% |
| Face Value | $260 |
| Present value | $24,686,415 |
| No of years | 11 |
| Yield to Maturity | 18.18% |
Cost of debt is the price incurred by a corporation when obtaining finance through debt instruments like taking out a bank loan or issuing bonds. It can be stated more simply as the actual interest rate a business pays on its present debt.
Pretax is equal to YTM, which is 3.07%. There are two ways to calculate the debt's before-tax cost: the yield-to-mature (YTM) strategy (Le, 2021).
4.5 (4.1.5) – After-Tax Component Cost of DebtThe interest paid on the loan less any income tax savings from deducting interest payments are the debt's after-tax costs. The cost of debt multiplied by the effective tax rate, which is divided by one, yields the cost of debt after taxes for a given company.
After-tax cost of debt = Before-tax cost of debt x (100% - incremental tax rate).
| Table 4.5 - After-Tax Component Cost of Debt | |
| Annual Interest Expense | $7,070,000,000.00 |
| Total Debt | $217,000,000.00 |
| Tax Rate | 1.07% |
| Pretax Cost of Debt | 3.07% |
| After-Tax Cost of Debt | 3.04% |
| Preferred Stock | 0.00% |
| Table 4.6 - Component Cost of Preferred Stock Estimation | |
| Annual dividends | 1.88 |
| Current Share Price | 326.19 |
| Cost of Preferred Stock | 1% |
The cost of equity using CAPM is calculated as
=Risk free-rate interest + Beta (expected return – risk free-rate of interest)
| Table 4.8 – CAPM Cost of Equity |
|
| Risk-Free Rate of Interest | 4% |
| equity beta | |
| Expected Return | 19.50% |
| Cost of Equity | 19.50% |
4.7.1(4.3) – Bond Yield plus Risk Premium Cost of Equity
Using the bond yield plus risk premium strategy, we can also estimate the value of an asset, in this case, the publicly traded stock of a corporation. By multiplying the yield to maturity of the company's long-term debt by the equity risk premium, BYPRP enables us to calculate the needed return on an equity.
Some auditors analyze the company’s cost of equity, which adds a judgment risk premium between 3% and 5% to the cost of debt. The cost of debt of McKesson Corp is 3.04%, risk premium of 4%
| Table 4.7.1 - Bond-Yield-Plus-Risk-Premium | |
| Cost of Debt | 3.04% |
| Risk premium | 4.00% |
| Cost of Equity | 7.04% |
Cost of Equity = Risk-Free Rate of Return + Beta × (Market Rate of Return – Risk-Free Rate of Return).
The estimated cost that businesses should pay their shareholders when assessing existing investments and upcoming expenses is known as the "Average Cost of Equity."
| Table 4.7.2 - Average Cost of Equity | |
| CAPM | 19.50% |
| Bond Yield Plus Risk Premium | 7.04% |
| Average Cost of Equity | 13.27% |
In this case, the DFL was not applied in the calculation of cost of equity because McKesson Corporation does not pay dividends.
4.8 (4.6)– Weighted Average Cost of Capital (WACC)WACC can be calculated using the following formula:
WACC= e (Market Weight of Common Equity)*(Average Cost of Equity) + (Market Weight of Debt) * (Cost of Debt) * (1 - Effective Tax Rate).
| Table 4.9 - Weighted Average Cost of Capital | |
| Weight of debt | 83% |
| Preferred stock | 0% |
| Cost of debt | 3.04% |
| Market weight of the preferred stock | 0% |
| The average cost of equity | 13.27% |
| Weighted of equity | 17% |
| Value of equity | 1,446,000,000 |
| Tax rate | 1.07% |
| WACC | 4.75% |
We will review a new project that McKesson is considering to assess the Cash Flow Estimation. The project will run for 11 years and will require an initial $800 million investment in equipment and $35 million for shipping and installation costs. The fixed assets will fall in line with the 10-year MACRS depreciation and the salvage value will be 15% of the purchase price. The number of units expected to be sold is 2.5 million and the expected annual sales growth rate is 5%. The expected sales price is $318 per unit with an estimated variable cost of $268 per unit in the first year and the following years are adjusted with an estimated annual inflation rate of 8.3%. The required NOWC, or net operating working capital is 13.8% of sales. See tables below for more detail. The expected cash flow after 11 years is $XX million.
5.1 – Depreciation BasisAs stated above the project's initial investment is $800 million to purchase equipment, plus an additional $35 million for shipping and installation. The project’s depreciation basis is $835 million.
| Table 5.1 – Depreciation Basis | |
| Purchase Cost | $800,000,000 |
| + Shipping & Installation Cost | $35,000,000 |
| Depreciation Basis | $835,000,000 |
Source calculated data: New Project Investment Scenario
5.2 Annual Depreciation of the New ProjectUsing the 10-year class of investment for MACRS depreciation percentages with an initial basis of $835 million, after 11 years the value falls to $27.4 million.
| Table 5.2 Annual Depreciation Expense | ||||||
| Year | 1 | 2 | 3 | 4 | 5 | 6 |
| Initial Basis | $835,000,000 | |||||
| MACRS% | 10.00% | 18.00% | 14.40% | 11.52% | 9.22% | 7.37% |
| Depreciation | $83,500,000 | $150,300,000 | $120,240,000 | $96,192,000 | $76,987,000 | $61,539,500 |
| Year | 7 | 8 | 9 | 10 | 11 | |
| Initial Basis | ||||||
| MACRS% | 6.55% | 6.55% | 6.56% | 6.55% | 3.28% | |
| Depreciation | $54,692,500 | $54,692,500 | $54,776,000 | $54,692,500 | $27,388,000 | |
Source calculated data: New Project Investment Scenario
| Table 5.2- Annual Depreciation Expense | |||
| Year | Initial Basis | MACRS | Depreciation |
| $835,000,000 | 10.00% | $ 83,500,000.00 | |
| $835,000,000 | 18.00% | $150,300,000.00 | |
| $835,000,000 | 14.40% | $120,240,000.00 | |
| $835,000,000 | 11.52% | $96,192,000.00 | |
| $835,000,000 | 9.22% | $76,987,000.00 | |
| $835,000,000 | 7.37% | $61,539,500.00 | |
| $835,000,000 | 6.55% | $54,692,500.00 | |
| $835,000,000 | 6.55% | $54,692,500.00 | |
| $835,000,000 | 6.56% | $54,776,000.00 | |
| 10 | $835,000,000 | 6.55% | $54,692,500.00 |
| 11 | $835,000,000 | 3.28% | $27,388,000.00 |
Source calculated data: New Project Investment Scenario
5.3 Annual Cash Flow Estimate| Table 5.3.1 - Annual Sales and Costs | |||||
| Year | Units | Unit Price | Unit Cost | Total Sales | Total Costs |
| 2,500,000 | $318 | $268 | $795,000,000 | $670,000,000 | |
| 2,625,000 | $344 | $290 | $904,034,250 | $761,890,500 | |
| 2,756,250 | $373 | $314 | $1,028,022,547 | $866,383,782 | |
| 2,894,063 | $404 | $340 | $1,169,015,840 | $985,208,318 | |
| 3,038,766 | $437 | $369 | $1,329,346,362 | $1,120,329,639 | |
| 3,190,704 | $474 | $399 | $1,511,666,216 | $1,273,982,849 | |
| 3,350,239 | $513 | $432 | $1,718,991,237 | $1,448,709,596 | |
| 3,517,751 | $556 | $468 | $1,954,750,885 | $1,647,400,117 | |
| 3,693,639 | $602 | $507 | $2,222,844,969 | $1,873,341,043 | |
| 10 | 3,878,321 | $652 | $549 | $2,527,708,157 | $2,130,269,767 |
| 11 | 4,072,237 | $706 | $595 | $2,874,383,331 | $2,422,436,266 |
Source calculated data New Project Investment Scenario
| Table 5.3.2 Operating Cash Flows | ||||||||
| Year | Sales | Costs | Depreciation | EBIT | Taxes | NOPAT | + Depreciation | Net Op. CF |
| $ 795,000,000 | $ 670,000,000 | $ 83,500,000 | $ 41,500,000 | $ 8,715,000 | $ 32,785,000 | $ 83,500,000 | $ 116,285,000 | |
| $ 904,034,250 | $ 761,890,500 | $ 150,300,000 | $ (8,156,250) | $ (1,712,812) | $ (6,443,437) | $ 150,300,000 | $ 143,856,563 | |
| $ 1,028,022,547 | $ 866,383,782 | $ 120,240,000 | $ 41,398,765 | $ 8,693,741 | $ 32,705,025 | $ 120,240,000 | $ 152,945,025 | |
| $ 1,169,015,840 | $ 985,208,318 | $ 96,192,000 | $ 87,615,522 | $18,399,260 | $ 69,216,262 | $ 96,192,000 | $ 165,408,262 | |
| $ 1,329,346,362 | $ 1,120,329,639 | $ 76,987,000 | $132,029,724 | $27,726,242 | $ 104,303,482 | $ 76,987,000 | $ 181,290,482 | |
| $ 1,511,666,216 | $ 1,273,982,849 | $ 61,539,500 | $176,143,867 | $36,990,212 | $ 139,153,655 | $ 61,539,500 | $ 200,693,155 | |
| $ 1,718,991,237 | $ 1,448,709,596 | $ 54,692,500 | $215,589,141 | $45,273,720 | $ 170,315,421 | $ 54,692,500 | $ 225,007,921 | |
| $ 1,954,750,885 | $ 1,647,400,117 | $ 54,692,500 | $252,658,268 | $53,058,236 | $ 199,600,032 | $ 54,692,500 | $ 254,292,532 | |
| $ 2,222,844,969 | $ 1,873,341,043 | $ 54,776,000 | $294,727,926 | $61,892,864 | $ 232,835,062 | $ 54,776,000 | $ 287,611,062 | |
| 10 | $ 2,527,708,157 | $ 2,130,269,767 | $ 54,692,500 | $342,745,889 | $71,976,637 | $ 270,769,253 | $ 54,692,500 | $ 325,461,753 |
| 11 | $ 2,874,383,331 | $ 2,422,436,266 | $ 27,388,000 | $424,559,065 | $89,157,404 | $ 335,401,661 | $ 27,388,000 | $ 362,789,661 |
Source calculated data: New Project Investment Scenario
| Table 5.3.3 - Cash Flows due to Investments in Net Operating Working Capital (NOWC) | ||||
| Year | Sales | NOWC (% of Sales) | CF due to Investment in NOWC | |
| $ - | $ 109,710,000 | $ (109,710,000) | ||
| $ 795,000,000 | $ 124,756,727 | $ (15,046,727) | ||
| $ 904,034,250 | $ 141,867,112 | $ (17,110,385) | ||
| $ 1,028,022,547 | $ 161,324,186 | $ (19,457,074) | ||
| $ 1,169,015,840 | $ 183,449,798 | $ (22,125,612) | ||
| $ 1,329,346,362 | $ 208,609,938 | $ (25,160,140) | ||
| $ 1,511,666,216 | $ 237,220,791 | $ (28,610,853) | ||
| $ 1,718,991,237 | $ 269,755,622 | $ (32,534,831) | ||
| $ 1,954,750,885 | $ 306,752,606 | $ (36,996,984) | ||
| $ 2,222,844,969 | $ 348,823,726 | $ (42,071,120) | ||
| 10 | $ 2,527,708,157 | $ 396,664,900 | $ (47,841,174) | |
| 11 | $ 2,874,383,331 | $ - | $ 396,664,900 | |
Source calculated data: New Project Investment Scenario
5.4 – Timeline of Cash Flows
.
6.0 – Capital Budgeting Analysis
6.5 – Profitability Index
6.4 Payback Period and Discounted Payback Period 6.5 – Payback for Project 6.4 – Discounted Payback 6.5 – Sensitivity Analysis
McKesson, as the biggest pharmaceutical distributor dominating performance over its peer industry players in years past, has had to weather the storm of its share of obstacles similar to that of its industry peers. In recent years, the impact of the global coronavirus epidemic shut and slowed down the global supply chain, stalled distribution, and forced systemic issues such as drug price deflation, inflation, as well as increased peer industry competition. The company’s efforts to streamline operations by divestment of assets that are not core and accelerating cost cuts as well as investment in strategic growth strategies of acquiring key assets that expanded or complemented their business structure has paid off by boosting revenue growth in 2022.
Taking into account McKesson’s financial health based our 5-year financial ratio analysis and benchmark comparison calculations; estimated capital structure and cost of debt; and calculated WACC, our team was analyzed McKesson’s position to take on an investment in a new project that could strategically grow revenue and generate a positive return on investment. With a revenue growth strategy that effectively managed its assets, the company has produced a positive ROI of 4.04% percent and operating ROA of 4.04% percent in 2022. These results compare well with industry peers ABC and CAH, but do reflect that careful consideration should be taken when investing in new projects. However, with McKesson’s dominance in the industry, a new investment project would do well to continue to boost its lead in the industry above its peers. (UPDATE with results of WACC, cashflow forecasts, NPV and future NPV, and sensitivity analysis)
Banerjee, S., Heshmati, A., & Wihlborg, C. (1999). The dynamics of capital structure. New York University-Salomon Center-Leonard N. Stern School of Business.
Bragg, S. (2022, May 28). Financial ratio analysis. AccountingTools. Retrieved 22–07-13, from https://www.accountingtools.com/articles/financial-ratio-analysis.html
Calrson, R. (2020, November 11). What Is Financial Ratio Analysis? The Balance Small Business. Retrieved July 14, 2022, from https://www.thebalancesmb.com/what-is-financial-ratio-analysis-393186
D&B Hoovers. (2022). D&B Hoovers. McKesson Corporation. Retrieved June 29, 2022, from https://app-avention-com.ruby.uhv.edu/company/business/databases/d-b-hoovers
Exley, C. J., & Smith, A. D. (2006). The cost of capital for financial firms. British Actuarial Journal, 12(1), 229-283.
Frank, M. Z., & Shen, T. (2016). Investment and the weighted average cost of capital. Journal of Financial Economics, 119(2). https://doi.org/10.1016/j.jfineco.2015.09.001
GoCardless. (2021, January 13). What is financial ratio analysis? Retrieved July 13, 2022, from https://gocardless.com/en-us/guides/posts/what-is-financial-ratio-analysis/
Le, H. T. T., Vo, X. V., & Vo, T. T. (2021). Accruals quality and the cost of debt: Evidence from Vietnam. International Review of Financial Analysis | Vol 76 | Retrieved June 30, 2022, from https://www.sciencedirect.com/journal/international-review-of-financial-analysis/vol/76/suppl/C
Merchant Online. (2022). Merchant Online. McKesson Corporation. Retrieved June 29, 2022, from https://app-avention-com.ruby.uhv.edu/company/business/databases/merchent
Pettit, J. (2003). Healthcare Cost of Capital Handbook. Available at SSRN: https://ssrn.com/abstract=463020
Staff, F. (2022, May 21). McKesson. Fortune. Retrieved July 10, 2022, from https://fortune.com/company/mckesson/fortune500/

| Annual Income Statement (Standardized) | Financials In: USD | Millions | ||||||
| Except for share items (millions and per share items (actual units) | ||||||||
|
| 31-Mar-2022 | 31-Mar-2021 | 31-Mar-2020 | 31-Mar-2019 | 31-Mar-2018 | |||
| Period Length | 12 Months | 12 Months | 12 Months | 12 Months | 12 Months | |||
| UpdateDate | Filed 09-May-2022 | Filed 09-May-2022 | Filed 09-May-2022 | Filed 12-May-2021 | Filed 22-May-2020 | |||
| Filed Currency | USD | USD | USD | USD | USD | |||
| Exchange Rate (Period Average) | ||||||||
| Auditor | Deloitte & Touche LLP | Deloitte & Touche LLP | Deloitte & Touche LLP | Deloitte & Touche LLP | Deloitte & Touche LLP | |||
| Auditor Opinion | Unqualified | Unqualified with Explanation | Unqualified with Explanation | Unqualified | Unqualified | |||
|
|
|
| ||||||
| Operating Revenue | 263,966 | 238,228 | 231,051 | 214,319 | 208,357 | |||
| Total Revenue | 263,966 | 238,228 | 231,051 | 214,319 | 208,357 | |||
|
|
|
|
|
| ||||
| Cost of Revenue | 250,836 | 226,080 | 219,028 | 202,565 | 197,173 | |||
| Gross Profit | 13,130 | 12,148 | 12,023 | 11,754 | 11,184 | |||
|
|
|
|
|
| ||||
| Selling, General and Administrative Expenses | 10,537 | 8,849 | 9,182 | 8,437 | 8,138 | |||
| Research and Development | - | - | - | - | 125 | |||
| Total Operating Expense | 10,537 | 8,849 | 9,182 | 8,437 | 8,263 | |||
|
|
|
|
|
| ||||
| Operating Income | 2,593 | 3,299 | 2,841 | 3,317 | 2,921 | |||
|
|
|
|
|
| ||||
| Interest Income - Non-Operating | 10 | 12 | 49 | 39 | 48 | |||
| Interest Expense - Non-Operating | 178 | 217 | 249 | 264 | 283 | |||
| Net Non-Operating Interest Income (Expense) | (168) | (205) | (200) | (225) | (235) | |||
| Restructuring and M&A | 245 | 219 | 156 | 352 | 530 | |||
| Impairment of Capital Assets | 36 | 184 | 114 | 2,042 | 1,738 | |||
| Gain on Sale of Business | - | - | - | 56 | 152 | |||
| Other Special Charges | 460 | 7,936 | 209 | 37 | 122 | |||
| Special Income (Charges) | (741) | (8,339) | (479) | (2,375) | (2,238) | |||
| Gain on Sale of Security | 141 | 181 | 53 | 66 | 32 | |||
| Earnings from Equity Interest | - | - | (1,108) | (194) | (248) | |||
| Other Non-Operating Income (Expenses) | 103 | 30 | 37 | 21 | 7 | |||
| Other Income (Expense) | (497) | (8,128) | (1,497) | (2,482) | (2,447) | |||
| Income Before Tax | 1,928 | (5,034) | 1,144 | 610 | 239 | |||
|
| 31-Mar-2022 | 31-Mar-2021 | 31-Mar-2020 | 31-Mar-2019 | 31-Mar-2018 | |||
| Total Income Tax | 636 | (695) | 18 | 356 | (53) | |||
| Income After Tax | 1,292 | (4,339) | 1,126 | 254 | 292 | |||
|
|
|
|
|
| ||||
| Net Income from Continuing Operations | 1,292 | (4,339) | 1,126 | 254 | 292 | |||
| Discontinued Operations | (5) | (1) | (6) | 1 | 5 | |||
| Minority Interest | (173) | (199) | (220) | (221) | (230) | |||
| Net Income | 1,114 | (4,539) | 900 | 34 | 67 | |||
|
|
|
|
|
| ||||
| Net Income Available to Common Stockholders | 1,114 | (4,539) | 900 | 34 | 67 | |||
|
|
|
|
|
| ||||
| Basic EPS | 7 | (28) | 5 | 0 | 0 | |||
| Basic EPS from Continuing Operations | 7 | (28) | 5 | 0 | 0 | |||
| Basic EPS from Discontinued Operations | (0) | - | (0) | - | 0 | |||
| Diluted EPS | 7 | (28) | 5 | 0 | 0 | |||
| Diluted EPS from Continuing Operations | 7 | (28) | 5 | 0 | 0 | |||
| Diluted EPS from Discontinued Operations | (0) | - | (0) | - | 0 | |||
| Basic Average Shares | 152 | 161 | 181 | 196 | 208 | |||
| Diluted Average Shares | 154 | 161 | 182 | 197 | 209 | |||
| Interest Income | 10 | 12 | 49 | 39 | 48 | |||
| Interest Expense | 178 | 217 | 249 | 264 | 283 | |||
| Net Interest Income | (168) | (205) | (200) | (225) | (235) | |||
| Net Income Including Non-Controlling Interests | 1,287 | (4,340) | 1,120 | 255 | 297 | |||
| Net Income from Continuing and Discontinued Operations | 1,114 | (4,539) | 900 | 34 | 67 | |||
| Normalized Income | 1,521 | 2,494 | 1,325 | 1,719 | 1,778 | |||
| Basic EPS from Continuing & Discontinued Operations | 7 | (28) | 5 | 0 | 0 | |||
| Diluted EPS from Continuing & Discontinued Operations | 7 | (28) | 5 | 0 | 0 | |||
| Dividends per Share | 2 | 2 | 2 | 2 | 1 | |||
| Net Income Before Extraord Items | 1,119 | (4,538) | 906 | 33 | 62 | |||
| Total Unusual Items | (600) | (8,158) | (426) | (2,309) | (2,206) | |||
| Total Unusual Items Excluding Goodwill | (600) | (8,158) | (426) | (2,309) | (2,206) | |||
| Tax Rate | 0 | 0 | 0 | 0 | 0 | |||
| Tax Effect of Unusual Items | (198) | (1,126) | (7) | (623) | (490) | |||
| Basic Normalized EPS | 10 | 16 | 7 | 9 | 9 | |||
| Diluted Normalized EPS | 10 | 16 | 7 | 9 | 9 | |||
|
| 31-Mar-2022 | 31-Mar-2021 | 31-Mar-2020 | 31-Mar-2019 | 31-Mar-2018 | |||
| EBITDA | 2,866 | (3,930) | 2,315 | 1,823 | 1,473 | |||
| Normalized EBITDA | 3,466 | 4,228 | 2,741 | 4,132 | 3,679 | |||
| Reconciled Cost of Revenue | 250,836 | 226,080 | 219,028 | 202,565 | 197,173 | |||
| Reconciled Depreciation | 760 | 887 | 922 | 949 | 951 | |||
| EBIT | 2,106 | (4,817) | 1,393 | 874 | 522 | |||
| © 2022 Morningstar. All Rights Reserved. | ||||||||
| Published by Dun & Bradstreet, Inc., July 2022. | ||||||||
| Annual Balance Sheet (Standardized) | Financials In: USD | Millions | ||||||
| Except for share items (millions and per share items (actual units) | ||||||||
|
| 31-Mar-2022 | 31-Mar-2021 | 31-Mar-2020 | 31-Mar-2019 | 31-Mar-2018 | |||
| Update Date | Filed 09-May-2022 | Filed 09-May-2022 | Filed 09-May-2022 | Filed 12-May-2021 | Filed 22-May-2020 | |||
| Filed Currency | USD | USD | USD | USD | USD | |||
| Exchange Rate | ||||||||
| Auditor | Deloitte & Touche LLP | Deloitte & Touche LLP | Deloitte & Touche LLP | Deloitte & Touche LLP | Deloitte & Touche LLP | |||
| Auditor Opinion | Unqualified | Unqualified with Explanation | Unqualified with Explanation | Unqualified | Unqualified | |||
|
|
|
| ||||||
| Cash and Cash Equivalents | 3,532 | 6,278 | 4,015 | 2,981 | 2,672 | |||
| Cash, Cash Equivalents and Short-Term Investments | 3,532 | 6,278 | 4,015 | 2,981 | 2,672 | |||
| Accounts Receivable | 16,438 | 17,106 | 17,201 | 14,941 | 14,349 | |||
| Other Receivables | 2,289 | 2,325 | 3,014 | 3,584 | 3,578 | |||
| Receivables Adjustments | (144) | (250) | (265) | (279) | (216) | |||
| Total Receivables | 18,583 | 19,181 | 19,950 | 18,246 | 17,711 | |||
| Total Inventory | 18,702 | 19,246 | 16,734 | 16,709 | 16,310 | |||
| Assets Held For Sale - Current | 4,516 | 12 | 906 | - | - | |||
| Prepaid Assets | 898 | 665 | 617 | 529 | 443 | |||
| Total Current Assets | 46,231 | 45,382 | 42,222 | 38,465 | 37,136 | |||
|
|
|
|
|
| ||||
| Land and Improvements | 104 | 156 | 151 | 172 | 187 | |||
| Buildings and Improvements | 1,331 | 1,745 | 1,604 | 4,154 | 3,746 | |||
| Machinery and Equipment | 2,338 | 2,512 | 2,308 | - | - | |||
| Construction in Progress | 313 | 382 | 131 | - | - | |||
| Other Property/Plant/Equipment | 1,548 | 2,100 | 1,886 | - | - | |||
| Property/Plant/Equipment - Gross | 5,634 | 6,895 | 6,080 | 4,326 | 3,933 | |||
| Accumulated Depreciation | (1,994) | (2,214) | (1,829) | (1,778) | (1,469) | |||
| Property/Plant/Equipment - Net | 3,640 | 4,681 | 4,251 | 2,548 | 2,464 | |||
| Goodwill | 9,451 | 9,493 | 9,360 | 9,358 | 10,924 | |||
| Other Intangible Assets | 2,059 | 2,878 | 3,156 | 3,689 | 4,102 | |||
| Goodwill and Other Intangible Assets | 11,510 | 12,371 | 12,516 | 13,047 | 15,026 | |||
| Investments in Joint Ventures at Cost | - | - | - | 3,513 | 3,728 | |||
| Long-Term Equity Investments | - | - | - | 3,513 | 3,728 | |||
| Long-Term Investments | - | - | - | 3,513 | 3,728 | |||
| Other Long-Term Assets | 1,917 | 2,581 | 2,258 | 2,099 | 2,027 | |||
| Total Non-Current Assets | 17,067 | 19,633 | 19,025 | 21,207 | 23,245 | |||
|
|
|
|
|
| ||||
| Total Assets | 63,298 | 65,015 | 61,247 | 59,672 | 60,381 | |||
|
| 31-Mar-2022 | 31-Mar-2021 | 31-Mar-2020 | 31-Mar-2019 | 31-Mar-2018 |
| Accounts Payable | 38,086 | 38,975 | 37,195 | 33,853 | 32,177 |
| Payables | 38,086 | 38,975 | 37,195 | 33,853 | 32,177 |
| Accrued Expenses | 4,543 | 3,987 | 3,340 | 3,443 | 3,379 |
| Other Short-Term Borrowings | 799 | 742 | 1,052 | 330 | - |
| Current Debt | 799 | 742 | 1,052 | 330 | 1,129 |
| Current Capital Lease Obligation | 297 | 390 | 354 | - | - |
| Current Debt and Capital Lease Obligation | 1,096 | 1,132 | 1,406 | 330 | 1,129 |
| Other Current liabilities | 4,741 | 9 | 683 | - | - |
| Total Current Liabilities | 48,466 | 44,103 | 42,624 | 37,626 | 36,685 |
|
|
|
|
|
| |
| Long-Term Debt | 5,080 | 6,406 | 6,335 | 7,265 | 6,751 |
| Long-Term Capital Lease Obligation | 1,366 | 1,867 | 1,660 | - | - |
| Long-Term Debt and Capital Lease Obligation | 6,446 | 8,273 | 7,995 | 7,265 | 6,751 |
| Deferred Taxes - Non-Current Liabilities | 1,418 | 1,411 | 2,255 | 2,998 | 2,804 |
| Non-Current Deferred Liabilities | 1,418 | 1,411 | 2,255 | 2,998 | 2,804 |
| Other Long-Term Liabilities | 8,760 | 9,782 | 1,662 | 2,103 | 2,625 |
| Total Non-Current Liabilities | 16,624 | 19,466 | 11,912 | 12,366 | 12,180 |
|
|
|
|
|
| |
| Total Liabilities | 65,090 | 63,569 | 54,536 | 49,992 | 48,865 |
|
|
|
|
|
| |
| Common Stock | 2 | 2 | 2 | 3 | 3 |
| Capital Stock | 2 | 2 | 2 | 3 | 3 |
| Retained Earnings (Accumulated Deficit) | 9,030 | 8,202 | 13,022 | 12,409 | 12,986 |
| Additional Paid-In Capital | 7,275 | 6,925 | 6,663 | 6,435 | 6,188 |
| Treasury Stock | (17,045) | (13,670) | (12,892) | (8,902) | (7,655) |
| Gains (Losses) Not Affecting Retained Earnings | (1,534) | (1,480) | (1,703) | (1,849) | (1,717) |
| Other Equity | - | - | - | (2) | (1) |
| Stockholders' Equity | (2,272) | (21) | 5,092 | 8,094 | 9,804 |
| Minority Interest | 480 | 1,467 | 1,619 | 1,586 | 1,712 |
| Total Equity | (1,792) | 1,446 | 6,711 | 9,680 | 11,516 |
|
|
|
|
|
| |
| Total Liabilities and Shareholders’ Equity | 63,298 | 65,015 | 61,247 | 59,672 | 60,381 |
|
|
|
|
|
| |
| Net Tangible Assets | (13,782) | (12,392) | (7,424) | (4,953) | (5,222) |
| Working Capital | (2,235) | 1,279 | (402) | 839 | 451 |
| Invested Capital | 3,607 | 7,127 | 12,479 | 15,689 | 17,684 |
|
| 31-Mar-2022 | 31-Mar-2021 | 31-Mar-2020 | 31-Mar-2019 | 31-Mar-2018 |
| Capital Lease Obligations | 1,663 | 2,257 | 2,014 | - | - |
| Total Debt | 7,542 | 9,405 | 9,401 | 7,595 | 7,880 |
| Net Debt | 2,347 | 870 | 3,372 | 4,614 | 5,208 |
| Total Capitalization | 2,808 | 6,385 | 11,427 | 15,359 | 16,555 |
| Common Stock Equity | (2,272) | (21) | 5,092 | 8,094 | 9,804 |
| Total Common Shares Outstanding | 145 | 158 | 162 | 190 | 202 |
| Treasury Shares Number | 130 | 115 | 110 | 81 | 73 |
| Shares Issued | 275 | 273 | 272 | 271 | 275 |
| Tangible Book Value | (13,782) | (12,392) | (7,424) | (4,953) | (5,222) |
| Employees | 75,000 | 76,000 | 80,000 | 80,000 | 78,000 |
| © 2022 Morningstar. All Rights Reserved. | |||||
| Published by Dun & Bradstreet, Inc., July 2022. | |||||
| Annual Cash Flows (Standardized) | Financials In: USD | Millions | ||||||||||||
| Except for share items (millions and per share items (actual units) | ||||||||||||||
|
| 31-Mar-2022 | 31-Mar-2021 | 31-Mar-2020 | 31-Mar-2019 | 31-Mar-2018 | |||||||||
| Period Length | 12 Months | 12 Months | 12 Months | 12 Months | 12 Months | |||||||||
| Update Date | Filed 09-May-2022 | Filed 09-May-2022 | Filed 09-May-2022 | Filed 12-May-2021 | Filed 22-May-2020 | |||||||||
| Filed Currency | USD | USD | USD | USD | USD | |||||||||
| Exchange Rate (Period Average) | ||||||||||||||
| Auditor | Deloitte & Touche LLP | Deloitte & Touche LLP | Deloitte & Touche LLP | Deloitte & Touche LLP | Deloitte & Touche LLP | |||||||||
| Auditor Opinion | Unqualified | Unqualified with Explanation | Unqualified with Explanation | Unqualified | Unqualified | |||||||||
| Net Income from Continuing Operations | 1,287 | (4,340) | 1,120 | 255 | 297 | |||||||||
| Gain (Loss) on Sale of Business | (132) | (9) | 33 | (86) | (169) | |||||||||
| Equity in Net Earnings (Loss) | - | - | 1,084 | 194 | 248 | |||||||||
| Operating Gains (Losses) | (132) | (9) | 1,117 | 108 | 79 | |||||||||
| Depreciation | 279 | 321 | 321 | 317 | 303 | |||||||||
| Amortization of Intangibles | 481 | 566 | 601 | 632 | 648 | |||||||||
| Amortization | 481 | 566 | 601 | 632 | 648 | |||||||||
| Depreciation and Amortization | 760 | 887 | 922 | 949 | 951 | |||||||||
| Depreciation, Amortization and Depletion | 760 | 887 | 922 | 949 | 951 | |||||||||
| Deferred Income Tax | 34 | (908) | (342) | 189 | (868) | |||||||||
| Deferred Taxes | 34 | (908) | (342) | 189 | (868) | |||||||||
| Asset Impairment Charge | 175 | 242 | 139 | 2,079 | 2,217 | |||||||||
| Other Non-Cash Items | 2,228 | 484 | 729 | (90) | 10 | |||||||||
| Receivables | (1,843) | 1,145 | (2,494) | (967) | 1,175 | |||||||||
| Inventories | (1,169) | (2,276) | (376) | (368) | (458) | |||||||||
| Payables | 2,802 | 1,267 | 3,952 | 1,976 | 271 | |||||||||
| Payables/Accrued | 2,802 | 1,267 | 3,952 | 1,976 | 271 | |||||||||
| Other Current Liabilities | (157) | 7,705 | (377) | - | - | |||||||||
| Other Working Capital | 449 | 345 | (16) | (95) | 671 | |||||||||
| Changes in Working Capital | 82 | 8,186 | 689 | 546 | 1,659 | |||||||||
| Cash from Operating Activities | 4,434 | 4,542 | 4,374 | 4,036 | 4,345 | |||||||||
|
| 31-Mar-2022 | 31-Mar-2021 | 31-Mar-2020 | 31-Mar-2019 | 31-Mar-2018 | |||||||||
| Capital Expenditure | (147) | (190) | (144) | (131) | (175) | |||||||||
| Purchase of Property/Plant/Equipment | (388) | (451) | (362) | (426) | (405) | |||||||||
| Net Purchase (Sale) of Property/Plant/Equipment | (388) | (451) | (362) | (426) | (405) | |||||||||
| Acquisition of Business | (6) | (35) | (133) | (905) | (2,893) | |||||||||
| Sale of Business | 578 | 400 | 37 | 101 | 500 | |||||||||
| Net Acquisition (Sale) of Business | 572 | 365 | (96) | (804) | (2,393) | |||||||||
| Other Investing Cash Flow | (126) | (139) | 23 | (20) | (20) | |||||||||
| Cash from Investing Activities | (89) | (415) | (579) | (1,381) | (2,993) | |||||||||
|
|
|
|
|
| ||||||||||
| Short-Term Debt Issued | 11,192 | 6,323 | 21,437 | 37,265 | 20,542 | |||||||||
| Short-Term Debt Reduction | (11,192) | (6,323) | (21,437) | (37,268) | (20,725) | |||||||||
| Short-Term Debt, Net | - | - | - | (3) | (183) | |||||||||
| Long-Term Debt Issued | 498 | 500 | - | 1,099 | 1,522 | |||||||||
| Long-Term Debt Reduction | (1,648) | (1,040) | (298) | (1,112) | (2,287) | |||||||||
| Long-Term Debt, Net | (1,150) | (540) | (298) | (13) | (765) | |||||||||
| Issuance (Retirement) of Debt, Net | (1,150) | (540) | (298) | (16) | (948) | |||||||||
| Sale/Issuance of Common | 220 | 92 | 113 | 75 | 132 | |||||||||
| Repurchase/Retirement of Common | (3,516) | (742) | (1,934) | (1,639) | (1,709) | |||||||||
| Common Stock, Net | (3,296) | (650) | (1,821) | (1,564) | (1,577) | |||||||||
| Total Cash Dividends Paid | (277) | (276) | (294) | (292) | (262) | |||||||||
| Other Financing Cash Flow | (1,598) | (227) | (321) | (355) | (297) | |||||||||
| Cash from Financing Activities | (6,321) | (1,693) | (2,734) | (2,227) | (3,084) | |||||||||
|
|
|
|
|
| ||||||||||
| Other Cash Adjustment Inside Change in Cash | (540) | - | - | - | - | |||||||||
| Net Cash - Beginning Balance | 6,396 | 4,023 | 2,981 | 2,672 | 4,254 | |||||||||
| Net Change in Cash | (2,516) | 2,434 | 1,061 | 428 | (1,732) | |||||||||
| Foreign Exchange Effects | 55 | (61) | (19) | (119) | 150 | |||||||||
| Net Cash - Ending Balance | 3,935 | 6,396 | 4,023 | 2,981 | 2,672 | |||||||||
|
|
|
|
|
| ||||||||||
| Capital Expenditures | (535) | (641) | (506) | (557) | (580) | |||||||||
| Issuance of Capital Stock | 220 | 92 | 113 | 75 | 132 | |||||||||
| Total Debt Issued | 11,690 | 6,823 | 21,437 | 38,364 | 22,064 | |||||||||
| 31-Mar-2022 | 31-Mar-2021 | 31-Mar-2020 | 31-Mar-2019 | 31-Mar-2018 | ||||||||||
| Total Debt Reduction | (12,840) | (7,363) | (21,735) | (38,380) | (23,012) | |||||||||
| Repurchase of Capital Stock | (3,516) | (742) | (1,934) | (1,639) | (1,709) | |||||||||
| Cash Taxes Paid | 359 | 379 | 368 | 262 | 144 | |||||||||
| Cash Interest Paid | 186 | 220 | 235 | 383 | 298 | |||||||||
| Free Cash Flow | 3,899 | 3,901 | 3,868 | 3,479 | 3,765 | |||||||||
| © 2022 Morningstar. All Rights Reserved. | ||||||||||||||
| Published by Dun & Bradstreet, Inc., July 2022. | ||||||||||||||


