Review Chapter 5 Searching the Evidence, Chapter 6 Evidence Appraisal Research, and Chapter 7 Evidence Appraisal Nonresearch in the Johns Hopkins Evidence-based Practice for Nurses and Healthcare Prof
Johns Hopkins Evidence-Based Practice Model for Nursing and Healthcare Professionals
Research Evidence Appraisal Tool
Appendix E
| Does this evidence answer the EBP question? | ☐ Yes Continue appraisal ☐ No STOP, do not continue evidence appraisal | |
| Article Summary Information | ||
| Article Title: | ||
| Author(s): | Number: | |
| Population, size, and setting: | Publication date: | |
| Complete after appraisal | ||
| Evidence level and quality rating: | ||
| Study findings that help answer the EBP question: | ||
| Article Appraisal Workflow | ||||||||
| Is this study: ☐ QuaNtitative (collection, analysis, and reporting of numerical data)
☐ QuaLitative (collection, analysis, and reporting of narrative data)
☐ Mixed methods (results reported both numerically and narratively)
| ||||||||
| Section I: QuaNtitative Appraisal | ||||||||
|
Is this a report of a single research study? | ☐ Yes Continue to decision tree ☐ No Go to Section I: B | |||||||
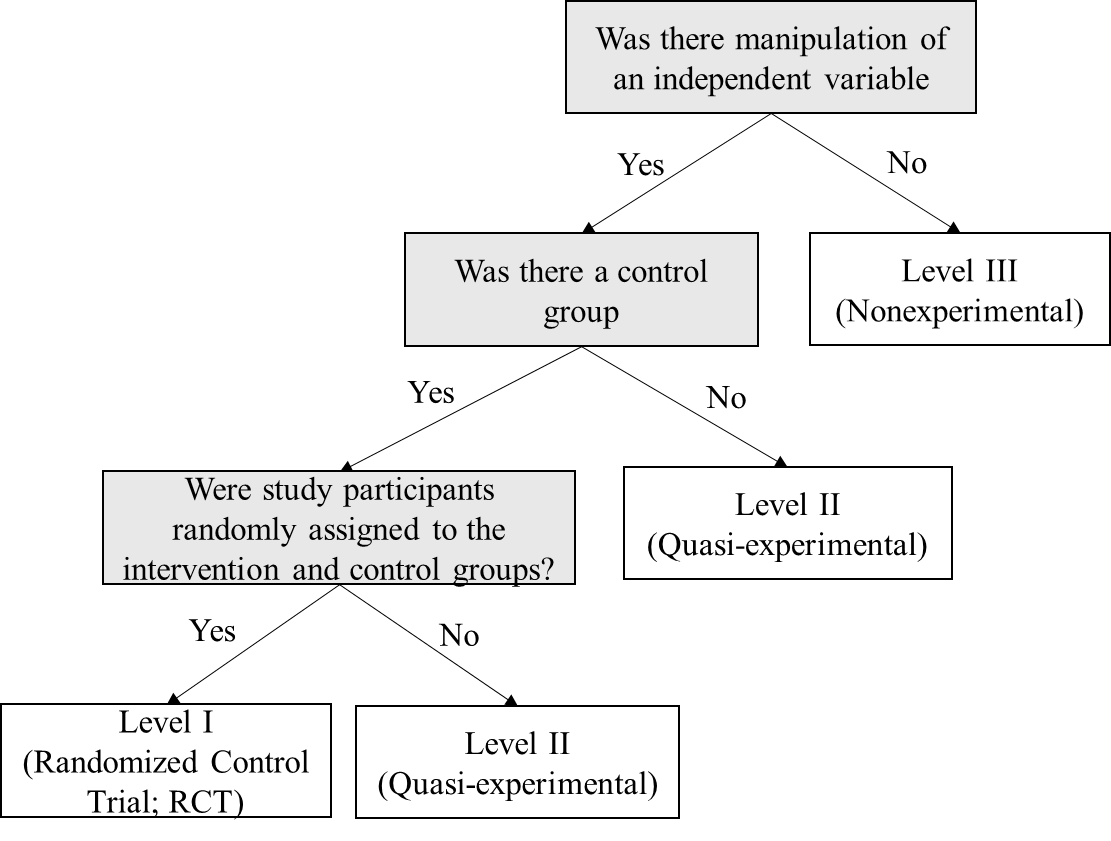
| Level |
Level I studies include randomized control trials (RCTs) or experimental studies Level II studies have some degree of investigator control and some manipulation of an independent variable but lack random assignment to groups and may not have a control group Level III studies lack manipulation of an independent variable; can be descriptive, comparative, or correlational; and often use secondary data | |||||||
| Quality | After determining the level of evidence, determine the quality of evidence using the considerations below: | |||||||
| Does the researcher identify what is known and not known about the problem? | ☐ Yes | ☐ No | ||||||
| Does the researcher identify how the study will address any gaps in knowledge? | ☐ Yes | ☐ No | ||||||
| Was the purpose of the study clearly presented? | ☐ Yes | ☐ No | ||||||
| Was the literature review current (most sources within the past five years or a seminal study)? | ☐ Yes | ☐ No | ||||||
| Was sample size sufficient based on study design and rationale? | ☐ Yes | ☐ No | ||||||
| If there is a control group:
| ☐ Yes ☐ Yes ☐ Yes | ☐ No ☐ No ☐ No | ☐ N/A ☐ N/A ☐ N/A | |||||
| Are data collection methods described clearly? | ☐ Yes | ☐ No | ||||||
| Were the instruments reliable (Cronbach’s [alpha] > 0.70)? | ☐ Yes | ☐ No | ☐ N/A | |||||
| Was instrument validity discussed? | ☐ Yes | ☐ No | ☐ N/A | |||||
| If surveys or questionnaires were used, was the response rate > 25%? | ☐ Yes | ☐ No | ☐ N/A | |||||
| Were the results presented clearly? | ☐ Yes | ☐ No | ||||||
| If tables were presented, was the narrative consistent with the table content? | ☐ Yes | ☐ No | ☐ N/A | |||||
| Were study limitations identified and addressed? | ☐ Yes | ☐ No | ||||||
| Were conclusions based on results? | ☐ Yes | ☐ No | ||||||
| Section I: QuaNtitative Appraisal (continued) | ||||||||
| Quality | Circle the appropriate quality rating below: | |||||||
| A High quality: Consistent, generalizable results; sufficient sample size for the study design; adequate control; definitive conclusions; consistent recommendations based on comprehensive literature review that includes thorough reference to scientific evidence. B Good quality: Reasonably consistent results; sufficient sample size for the study design; some control; fairly definitive conclusions; reasonably consistent recommendations based on fairly comprehensive literature review that includes some reference to scientific evidence. C Low quality: Little evidence with inconsistent results; insufficient sample size for the study design; conclusions cannot be drawn. | ||||||||
| Record findings that help answer the EBP question on page 1 | ||||||||
| Section I: QuaNtitative Appraisal (continued) | ||
|
Is this a summary of multiple sources of research evidence? | ☐ Yes Continue to decision tree ☐ No Use the Nonresearch Evidence Appraisal tool (Appendix F) | |
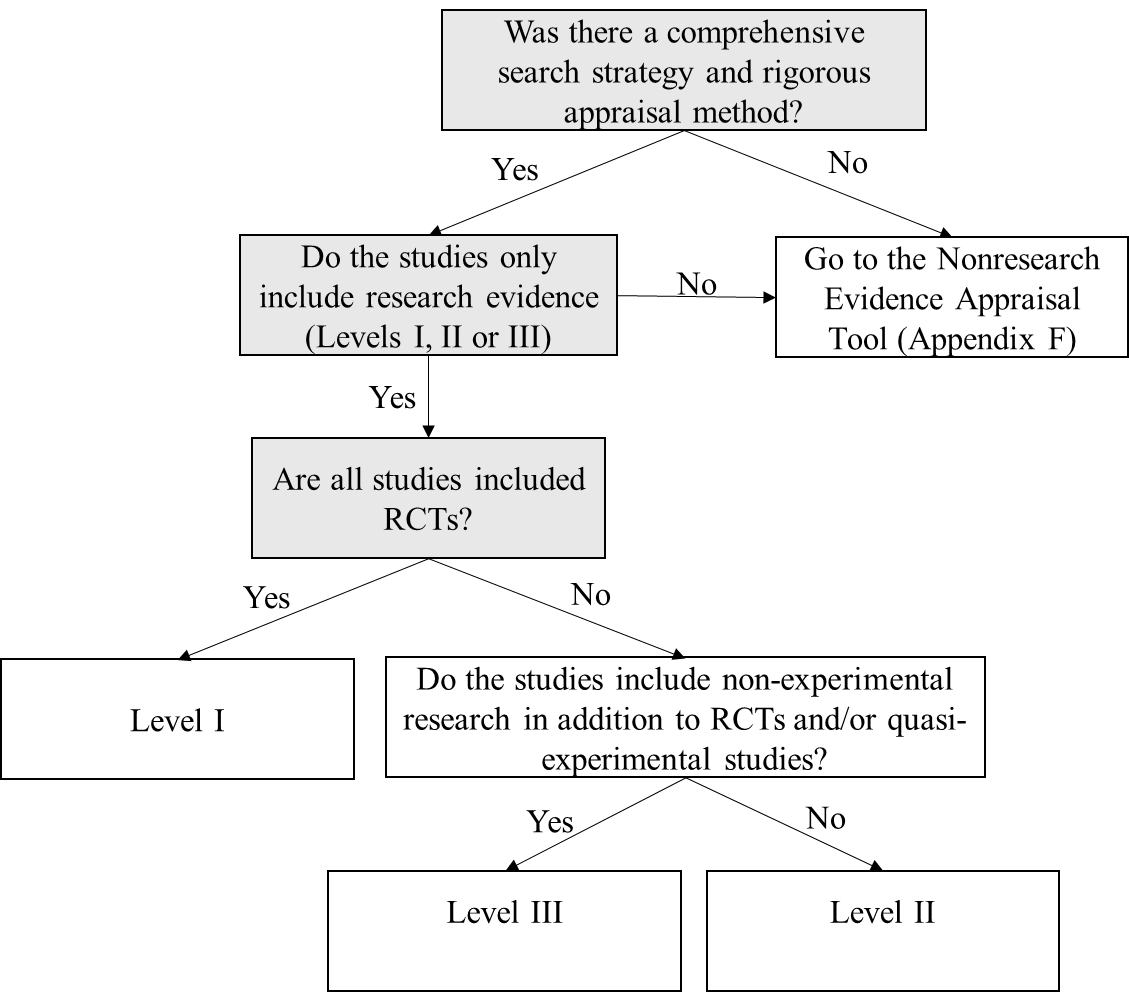
| Level |
| |
| Quality | After determining level of evidence, determine the quality of evidence using the considerations below: | |||
| Were the variables of interest clearly identified? | ☐ Yes | ☐ No | ||
| Was the search comprehensive and reproducible?
| ☐ Yes ☐ Yes ☐ Yes | ☐ No ☐ No ☐ No | ||
| Was there a flow diagram that included the number of studies eliminated at each level of review? | ☐ Yes | ☐ No | ||
| Were details of included studies presented (design, sample, methods, results, outcomes, strengths, and limitations)? | ☐ Yes | ☐ No | ||
| Were methods for appraising the strength of evidence (level and quality) described? | ☐ Yes | ☐ No | ||
| Were conclusions based on results?
| ☐ Yes ☐ Yes | ☐ No ☐ No | ||
| Did the systematic review include a section addressing limitations and how they were addressed? | ☐ Yes | ☐ No | ||
| Section I: QuaNtitative Appraisal (continued) | ||||
| Quality | Circle the appropriate quality rating below: | |||
| A High quality: Consistent, generalizable results; sufficient sample size for the study design; adequate control; definitive conclusions; recommendations consistent with the study’s findings and include thorough reference to scientific evidence B Good quality: Reasonably consistent results; sufficient sample size for the study design; some control; fairly definitive conclusions; recommendations reasonably consistent recommendations based on with athe study’s findings and fairly comprehensive evidence appraisal (vs literature review?) that includes some reference to scientific evidence C Low quality: Little evidence with inconsistent results; insufficient sample size for the study design; conclusions cannot be drawn. | ||||
| Record findings that help answer the EBP question on page 1 | ||||
| Section II: QuaLitative Appraisal | ||||
|
Is this a report of a single research study? | ☐Yes This is Level III evidence ☐No Go to Section II: B | |||
| After determining level of evidence, determine the quality of evidence using the considerations below: | ||||
| Quality | Was there a clearly identifiable and articulated:
| ☐ Yes ☐ Yes ☐ Yes | ☐ No ☐ No ☐ No | |
| Do participants have knowledge of the subject the researchers are trying to explore? | ☐ Yes | ☐ No | ||
| Were characteristics of study participants described? | ☐ Yes | ☐ No | ||
| Was a verification process used in every step of data analysis (e.g., triangulation, response validation, independent double check, member checking)? (Credibility) | ☐ Yes | ☐ No | ||
| Does the researcher provide sufficient documentation of their thinking, decisions, and methods related to the study allowing the reader to follow their decision-making (e.g., how themes and categories were formulated)? (Confirmability) | ☐ Yes | ☐ No | ||
| Does the researcher provide an accurate and rich description of findings by providing the information necessary to evaluate the analysis of data? (Fittingness) | ☐ Yes | ☐ No | ||
| Does the researcher acknowledge and/or address their own role and potential influence during data collection? | ☐ Yes | ☐ No | ||
| Was sampling adequate, as evidenced by achieving data saturation? | ☐ Yes | ☐ No | ||
| Does the researcher provide illustrations from the data?
| ☐ Yes ☐ Yes | ☐ No ☐ No | ||
| Is there congruency between the findings and the data? | ☐ Yes | ☐ No | ||
| Is there congruency between the research methodology and:
| ☐ Yes ☐ Yes ☐ Yes | ☐ No ☐ No ☐ No | ||
| Are discussion and conclusions congruent with the purpose and objectives, and supported by literature? | ☐ Yes | ☐ No | ||
| Are conclusions drawn based on the data collected (e.g., the product of the observations or interviews)? | ☐ Yes | ☐ No | ||
| Section II: QuaLitative Appraisal (continued) | |
| Quality | Circle the appropriate quality rating below: |
| A/B High/Good Quality: The report discusses efforts to enhance or evaluate the quality of the data and the overall inquiry in sufficient detail; it describes the specific techniques used to enhance the quality of the inquiry. Evidence of at least half or all the following is found in the report:
C Low quality: Lack of clarity and coherence of reporting, lack of transparency in reporting methods; poor interpretation of data and offers little insight into the phenomena of interest; few, if any, of the features listed for high/good quality. | |
| Record findings that help answer the EBP question on page 1 | |
| Section II: QuaLitative Appraisal | ||||
| Is this a summary of multiple sources of qualitative research evidence with a comprehensive search strategy and rigorous appraisal method (Meta-synthesis)? | ☐Yes This is Level III evidence ☐ No Use the Nonresearch Evidence Appraisal tool (Appendix F) | |||
| Quality | After determining level of evidence, determine the quality of evidence using the considerations below: | |||
| Were the search strategy and criteria for selecting primary studies clearly defined? | ☐ Yes | ☐ No | ||
| Was there a description of a systematic and thorough process for how data were analyzed? | ☐ Yes | ☐ No | ||
| ☐ Yes | ☐ No | ||
| ☐ Yes | ☐ No | ||
| ☐ Yes | ☐ No | ||
| Did synthesis reflect:
| ☐ Yes ☐ Yes ☐ Yes | ☐ No ☐ No ☐ No | ||
| Are findings clearly linked to and match the data? | ☐ Yes | ☐ No | ||
| Are findings connected to the purpose, data collection, and analysis? | ☐ Yes | ☐ No | ||
| Are discussion and conclusions connected to the purpose, objectives, and (if possible) supported by literature? | ☐ Yes | ☐ No | ||
| Did authors describe clearly how they arrived at the interpretation of the findings? | ☐ Yes | ☐ No | ||
| Circle the appropriate quality rating below: | ||||
| A/B High/Good Quality: The report discusses efforts to enhance or evaluate the quality of the data and the overall inquiry in sufficient detail; and it describes the specific techniques used to enhance the quality of the inquiry. Evidence of some or all of the following is found in the report:
C Low quality: Lack of clarity and coherence of reporting, lack of transparency in reporting methods; poor interpretation of data and offers little insight into the phenomena of interest; few, if any of the features listed for high/good quality. | ||||
| Record findings that help answer the EBP question on page 1 | ||||
| Section III: Mixed Methods Appraisal | |||||
| You will need to appraise both parts of the study independently before appraising the study as a whole. Evaluate the quaNtitative part of the study using Section I. Evaluate the qualitative part of the studying using Section II, then return here to complete appraisal. | |||||
| Level | Level | Quality | |||
| QuaNtitative Portion | |||||
| QuaLitative Portion | |||||
| The level of mixed methods evidence is based on the sequence of data collection. Quantitative data collection followed by quaLitative (explanatory design) is based on the level of the quaNtitative portion. All other designs (exploratory, convergent, or multiphasic) are Level III evidence. Explanatory sequential designs collected quantitative data first, followed by qualitative. Exploratory sequential designs collect qualitative data first, followed by quantitative. Convergent parallel designs collect quantitative and qualitative data at the same time. Multiphasic designs collect qualitative and quantitative data over more than one phase. | |||||
| Quality | After determining the level of evidence, determine the quality of evidence using the considerations below: | ||||
| Was the mixed-methods research design relevant to address both quaNtitative and quaLitative research questions (or objectives)? | ☐ Yes | ☐ No | |||
| Was the research design relevant to address the quaNtitative and the quaLitative aspects of the mixed-methods question (or objective)? | ☐ Yes | ☐ No | |||
| Circle the appropriate quality rating below: | |||||
| A High quality: Contains high-quality quaNtitative and quaLitative study components; highly relevant study design; relevant integration of data or results; and careful consideration of the limitations of the chosen approach. B Good quality: Contains good-quality quaNtitative and quaLitative study components; relevant study design; moderately relevant integration of data or results; and some discussion of limitations of integration. C Low quality: Contains low quality quaNtitative and quaLitative study components; study design not relevant to research questions or objectives; poorly integrated data or results; and no consideration of limits of integration. | |||||
| Record findings that help answer the EBP question on page 1 | |||||
©2022 Johns Hopkins Health System/Johns Hopkins School of Nursing Page | 11


