For Dr. Frank only please see the attached.
CHAPTER 3: METHODOLOGY 46
Introduction 46
Research methodology and design 47
Population and sample 48
Data sources/instruments/ materials 51
Reliability and Validity of Instruments 52
Data collection procedures 53
Data analysis procedures 54
Assumptions 57
Limitations 57
Delimitations 58
Ethical assurances 58
Internal and external Validity 58
Summary 59
CHAPTER 4: RESULTS, ANALYSIS AND FINDINGS 61
Data Collection and Screening 62
Description of the Sample 63
Study Measures 65
Quality Criteria: Reliability Test 65
Pearson Correlations 68
Normality Test using Histogram 68
Scatter Plot 77
Data Analysis 88
Correlation 89
Regression 92
Summary 93
Considering such a huge population size, correspondingly larger sample size is required. However, considerably larger sample size has undesirable logistical implications. For instance, going with the standard definition of a representative sample size as illustrated by Cochran (2007), 10 percent of the total population would be required. Collecting data from such a huge sample size would consume a considerable amount of time. An alternative approach to the determination of appropriate sample size is Cochran's (2007) G*power technique. The G*power technique does not require estimation can be used for situations in which the population size is either unknown or extremely large hence not feasible for effective sampling.
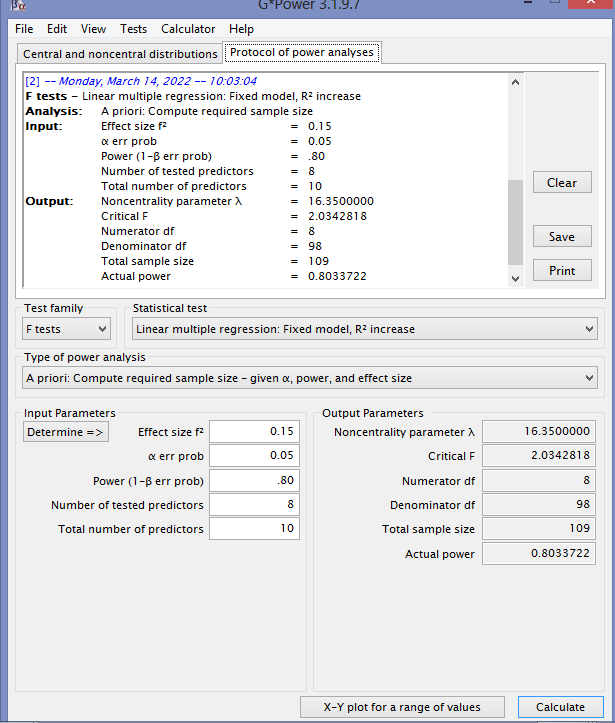
A priori power analysis was conducted using G*Power to determine the required minimum sample size for the study. Four factors were considered in the power analysis: significance level, effect size, the power of the test, and statistical technique. The significance level, also known as Type I error, refers to the chance of rejecting a null hypothesis given that it is true (Haas, 2012). Most quantitative studies make use of a 95 percent confidence level because it adequately provides enough statistical evidence of a test (Creswell & Poth, 2017). The effect size refers to the estimated measurement of the relationship between the variables being considered (Cohen, 1988). Cohen (1988) categorizes effect size into small, medium, and large. Berger, Bayarri, and Pericchi (2013) purported that a medium effect size is better as it strikes a balance between being too strict (small) and too lenient (large). The power of the test refers to the probability of correctly rejecting a null hypothesis (Sullivan & Feinn, 2012). In most quantitative studies, an 80 percent power is usually used (Sullivan, & Feinn, 2012).
The statistical test to be used for this study is multiple regression. In order to conduct multiple regression to detect a medium effect size, at the 5 percent level of significance, with 80 percent power, at least 109 participants are required (Figure 1). This calculation is also based on eight independent variables: leadership type (transformational leadership, transactional leadership, passive-avoidant behaviors) and toxic leadership (self-promotion, abusive supervision, unpredictability, narcissism, and authoritarian leadership). Additionally, gender and age will be controlled for in the analysis.
Figure 1 G*Power Sample Size Estimation for Multiple Regression
The comment is below:
I think it looks fantastic. You have figure 1 on page 50 which appears with no mention of where or how you obtained it. If you generated it, make that clear or if you used a product, report that. I used Qualtrics to get this information. Do I have to change my whole table of content? Is there an easier way? I don’t want to mess up my format.


