Course: Financial Management The homework is in the attachment, please check it out, thank you! Final Project Requirements Format required: APA
The Scoring System
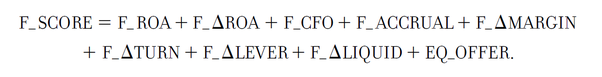
We calculate the F-score using nine fundamental parameters about the stock. For each parameter, if the parameter meets the criteria, we award a score of 1. Otherwise for that parameter we award a score of 0. We then add the scores for each parameter to arrive at a final score that can range from 0 to 9.
If a stock score 7-9 it is good. But stocks that score less than 3 are considered to be very weak.
The Nine Parameters
We need nine parameters to calculate the F-score. The parameters are divided into three broad categories.
Profitability
Profitability measures the ability of a firm to generate positive cash flows or profits. We have 4 parameters related to profitability:
Net Income. Net income is calculated as total income for the year minus the total expenses for the year. If the net income from the most recent financial statement is positive, then we award a score of 1 to the stock. Profit is a sign of strength.
Operating Cash Flow. If cash flow from operations is greater than zero, then we award a score of 1 to the stock. Positive cash flows are important for internal financing and are a sign of strength.
Return on Assets. We can calculate return on assets as net profit divided by assets. We need to calculate the return on assets for the past two years. If the ROA has increased year-on-year, then we award a score of 1 to the stock. This parameter provides a sign of the positive trend in asset returns.
Earnings Quality. We can measure the earnings quality of a stock by comparing its “cash flow from operations” with its “net income”. If operating cash flow is greater than net income, then we award a score of 1 to the stock. This is important because operating cash flows are usually higher than net income. They not affected by non-cash items. For this reason, investors must be careful if the trend shows otherwise.
Capital Structure
This category measures changes in leverage, liquidity and sources of funding. The parameters here provide a sign of the ability of the firm to meet its debt service obligations.
Long-term Debt-to-Assets ratio. If the long-term debt-to-equity ratio for the previous fiscal year is less than the ratio two-years ago, then we award a score of 1 to the stock. If the leverage has decreased, it is a positive sign.
Current ratio (Change in Liquidity). If the current ratio for the previous fiscal year is greater than the current ratio for the fiscal year two years ago, then we award a score of 1 to the stock.
Furthermore, we want the company to have high liquidity.
Change in Average Shares Outstanding. If the “average number of shares outstanding” for the previous fiscal year is less or equal to the “average number of shares outstanding” for the fiscal year two years ago, then we award a score of 1 to the stock. In conclusion, an increase in outstanding shares is a negative sign.
Operating Efficiency
This category measures changes in a company’s’ productivity. It also measures its ability to use its assets.
Change in Gross Margin. If the gross margin has increased in the past two years, then we award a score of 1 to the stock. A rising gross margin indicates increasing prices or decreasing costs. This again is a positive sign for the firm.
Asset Turnover. Investors can calculate the asset turnover ratio as total sales divided by total assets. We award a score of 1 to the stock if the asset turnover ratio has increased over the past two years.
We award scores based on all these 9 parameters and then total score represents the F-score. The higher the score, the better is the investment.
You should use the Piotroski F-score as a supplement along with other screening strategies.
Calculating Piotroski F-score in Excel
As we have seen, it’s an easy to calculate yet high impact measure. Also, it makes use of fundamentals information available in financial statements. Since MarketXLS provides all the required fundamentals information for stocks, we can calculate Piotroski F-score in Excel using data fetched using MarketXLS. Let’s finally take a look at how we can do it.
Let’s say you want to calculate the F-score for the Facebook stock (Stock Symbol FB) and some other stocks. We will make use of the Historical fundamental functions available in MarketXLS. We can access this category of function through Excel’s in-built function menu as shown below:
The F Score is the sum of nine components related to profitability, leverage and op. efficiency. These nine components are each given a pass (1) or fail (0). The sum of these parts results in the F-Score. For each criteria that a company meets, it's F-Score is increased by 1.
Profitability Components
- Positive Net Income - 1
- Positive Operating Cash Flow - 1
- Higher ROA than Previous Period - 1
- CFO > NI - 1
Leverage Components
- Decline in Long Term Debt - 1
- Higher Current Ratio than Previous Period -1
- Less Dilution (# of Shares Outstanding) than Previous Period - 1
Operating Efficiency Components
- Higher Gross Margin than Previous Period
- Higher Asset Turnover than Previous Period


