Managers need to make informed decisions. Using data, or research, to analyze your business is an important part of making decisions and evaluating business performance. An IT manager analyzes service
DAT/565 v4
Call Time Analysis Time in Queue Test
 The team performed a test of hypothesis to determine whether the average TiQ is lower than the industry standard of 2.5 minutes (150 seconds).
A significance level α=0.05 was used.
This was a test of mean against a hypothesized value of 150 seconds. Because the sample size was large, we assumed knowledge of the population’s variance.
The null and alternate hypotheses is:
Ho : µ ≥ 150
H1 : µ < 150
This is a left-tailed test, and with a significance level of α=0.05 the critical value is z = -1.645. The decision rule becomes: Reject Ho if zcalc < -1.645.
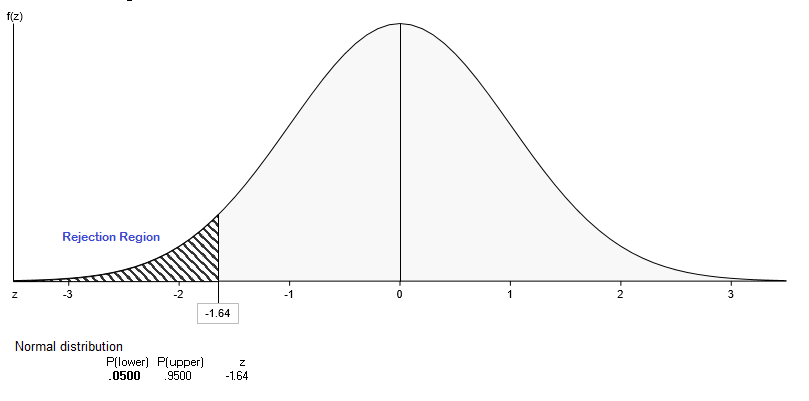
Figure 1: TiQ Rejection Region
The test statistic is given by:

The test statistic zcalc falls outside the rejection region, so we reject the null hypothesis in favor of the alternate hypothesis. We conclude the call center’s average TiQ is greater than the industry’s average of 150 seconds.
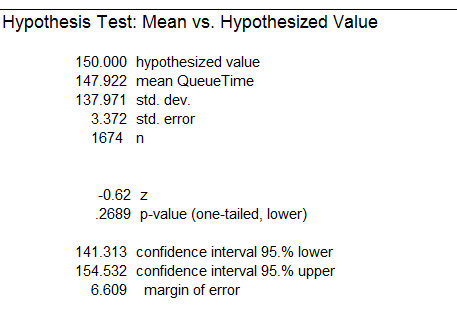
Figure 2: Results of TiQ Hypothesis Test: Mean versus Hypothesized Value
Average Service Time TestThe team performed a test of hypothesis to determine whether the service time (ST) with new service protocol PE is lower than with the current PT protocol. A significance level of α=0.05 was used.
This is a test of means for two independent samples with unknown variances assumed unequal.
Sample 1 is the data from the PT (current) protocol. Sample 2 is the data from the PE (new) protocol. We tested whether the mean ST with protocol PE is smaller than the mean with protocol PT.
The null and alternate hypotheses are:
Ho : µ1 ≤ µ2
H1 : µ1 > µ2
This is a right-tailed test. Because of the very large samples, there is no real difference between finding the critical value with a normal distribution or the t distribution. The critical value with a significance level α=0.05 is t = 1.645.
The decision rule becomes: Reject Ho if tcalc > 1.645.
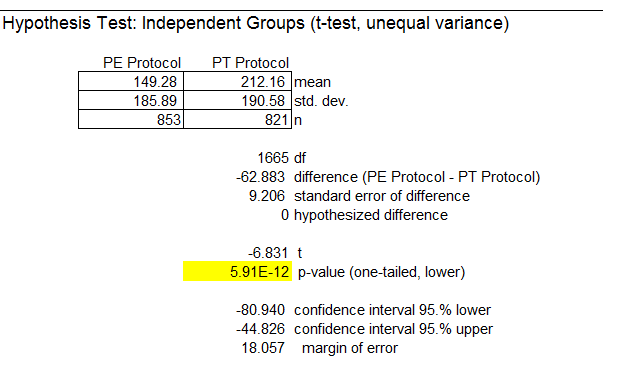
Figure 3: Hypothesis Test of Independent Groups (t-test, unequal variance)
The tcalc = -6.8 falls in the rejection region. We conclude that the new protocol (PE) results in a shorter average service time than the traditional protocol (PT) based on available data.
Copyright 2023 by University of Phoenix. All rights reserved.


