FINANCE CASE REPORT: Elon Musk's Twitter Deal : Valuation and Financing of the Leveraged Buyout The report should be word-processed (or PDF), double-spaced, with 11-pt font and 1-inch margin. It sho
Report
FIN 4400 Financial Management
Elon Musk's Twitter Deal: A Comprehensive Valuation Analysis
Spring 2023
Introduction
Elon Musk, the CEO of Tesla Inc., faced a choice on April 14, 2022. Intent on taking the social media business private, he had recently made a hostile takeover proposal for Twitter Inc. (Twitter) at a surprise price of US$54.20 per share. The bid price represented a 38% premium over Twitter's stock price at the start of April for the acquisition. Twitter accepted Musk's takeover proposal on April 25. Musk said in a tweet that the Twitter transaction was "put on hold" on May 13 due to worries about the true scope of bogus accounts on the platform. In contrast to Twitter's financial reporting, Musk thought that a more accurate estimate of "fake" accounts was closer to 20% rather than the less than 5% that was stated. After claiming that the board of Twitter had not given him enough proof to allay his fears, Musk officially terminated the deal to buy Twitter on July 8th. Nearly immediately, Twitter's board reacted by suing Musk in the Delaware Court of Chancery in an effort to get him to honor his first $44 billion offer. This research will offer a thorough value analysis of Musk's Twitter acquisition, which will include a financial analysis of Twitter and a review of the report's suggested alternatives.
Following a financial examination of the business, this paper will then look at the present market and competitive environment in which Elon Musk's Twitter operates. The research will calculate the fair value of Elon Musk's Twitter using a variety of valuation techniques, such as discounted cash flow and comparable company analysis. The study will result in a recommendation about whether or not to invest in Elon Musk's Twitter, as well as a detailed plan of action to carry out the recommendation and reduce related risks.
Size-Up Analysis
Environment & Industry
The IT sector is renowned for its quick pace and ongoing developments and improvements. Twitter competes against fierce industry rivals like Facebook, Google, and Apple for market share as a social media platform. Elon Musk's Twitter purchase should be evaluated in light of the present market conditions and relevant industry aspects (Teoli, Sanvictores, & An, 2019). Future trends are challenging to anticipate because of the technology sector's reputation for innovation and change that occur at an accelerated rate. Yet, a few economic and market variables could have an effect on how well this sale goes.
First off, there have been worries about a potential slowdown in the global economy because the technology sector is vulnerable to economic downturns. This might affect consumer demand for social media sites like Twitter and the business's profitability. Twitter, which works in the advertising sector, may be able to weather some of these pressures from the economy because businesses may still be ready to spend money on advertising to keep their market share.
Second, there is fierce competition in the social media sector due to the presence of multiple well-known firms like Facebook, Instagram, and Snapchat. Since advertising costs have decreased due to competition, many social media firms' profitability has suffered. Because of this, Twitter has found it difficult to grow its user base and draw in new advertisers, which may limit the viability of any upcoming agreements or projects.
The regulatory environment may also have an effect on the Twitter deal's success. Governments from all over the world are paying closer attention to social media platforms' content policies. This regulatory pressure may restrict Twitter's freedom of operation and affect the demand for its services.
But, there are also advantageous aspects of this bargain to consider. With a sizable and active user base, Twitter is well-represented in news and current affairs (Longhurst et al., 2020). The platform has also been making investments in cutting-edge technology like augmented reality and live video streaming, which might increase user engagement and draw in more advertisers.
The company might not be able to increase its market competitiveness alone through cost reduction. User engagement, user growth, and ad income serve as the major pillars of competition in the social media sector, as they do for many technology companies. Although if cost-cutting initiatives might help Twitter's profit margins grow, they won't necessarily make the company more competitive in terms of these crucial aspects.
However, Twitter competes in a sector that is rapidly changing and intensely competitive, making it simple for rivals to overtake it and provide identical services or goods. To stay ahead of the competition, the business must keep coming up with new ideas and adapting to shifts in consumer behavior, fashion, and technical developments. In addition, Twitter must manage the regulatory landscape in which it conducts business, which might have a big impact on the company's financial results. Twitter may incur higher costs and see a decline in revenue if social media platforms are subject to more scrutiny and regulation.
Swot Analysis
Strengths:
Great Brand: Twitter is one of the most well-known social media sites in the world and has a great brand awareness.
Large User Base: With over 330 million monthly active users, Twitter has a sizable user base that attracts advertisers.
Advertising Revenue: Over the years, Twitter has progressively increased the amount of money it makes from advertising.
Real-time Communication: Twitter is a useful tool for organizations and individuals to stay informed about news and events thanks to its real-time communication function.
diversified User Demographics: Twitter's user base is diversified, which draws a variety of marketers from different industries.
Weaknesses:
Dependence on Advertising: Because Twitter depends so heavily on advertising revenue, it is susceptible to changes in the advertising market.
Limited Revenue Streams: Twitter only generates income through data licensing and advertising, which might be risky if the demand for these services declines.
User Growth: As a result of a recent slowdown in user growth, Twitter's potential for future growth may be constrained.
Content Moderation: Twitter has been under fire for the way it handles content moderation, which might have regulatory repercussions.
Opportunities:
Revenue Stream Diversification: To increase its revenue streams, Twitter should look into new ones like e-commerce or subscription-based services.
User Engagement: By delivering new features and tools to keep users engaged on the site, Twitter might concentrate on enhancing user engagement.
Expansion into New Markets: In order to grow its user base and revenue potential, Twitter could enter new markets.
Partnerships: Twitter may go into partnerships with other businesses to develop fresh goods and services that could boost its earning potential.
Threats:
Competition: Facebook, Instagram, and TikTok are just a few of the social media sites that Twitter must contend with.
Changing User Behavior: Twitter's user engagement and revenue potential may suffer from changes in user behavior, such as a move toward visual content.
Ad-Blocking: The growing popularity of ad-blockers among users may have a detrimental effect on Twitter's ad revenue.
Regulatory Risks: There are regulatory risks associated with Twitter, notably in relation to content control and privacy issues.
Financial Analysis: Statement of Cash Flows (Exhibit 1)
Net Income: Twitter experienced a net loss in 2021, a marked improvement over the prior year. In 2019 and 2018, the business saw positive gains, but 2017 saw a net loss. This suggests that Twitter's profitability has fluctuated over the years.
Operating Cash Flow: Twitter's operating cash flow has historically been positive, however from 2020 to 2021, we can observe a deteriorating trend. This can be a sign that the business's ability to generate cash from its core businesses is declining.
Investing Cash Flow: As Twitter has typically had negative investing cash flow, it is clear that the company has been heavily putting money into long-term assets like real estate, machinery, and equipment. From 2018 through 2021, there is a downward trend in investing cash flow, which may be a sign that Twitter is investing less in long-term assets.
Cash Flow from Financing: Twitter's cash flow from financing has been negative in the majority of years, showing that the company has supported its operations primarily through debt and equity financing. From 2013 to 2021, we can observe a declining trend in financing cash flow, which would mean that Twitter is no longer as dependent on financing activities to sustain its operations.
Net Cash Flow: With a few notable exceptions, Twitter has had positive net cash flow most years. From 2016 to 2021, there is an upward trend in net cash flow, which may be a sign that Twitter has been able to increase its cash flow from operations and financial activities.
The aforementioned data shows that Twitter's financial performance over the years has been erratic, with a mix of net losses and net earnings. Despite the corporation continually producing positive operating cash flow, investing and financing cash flows have typically been negative, reflecting significant investments in long-term assets and reliance on debt and equity financing.
Other elements that investors should consider include Twitter's competitive position in the social media sector, its growth prospects, regulatory risks, and any potential legal or reputational issues. Before making any investment decisions, it's crucial to undertake additional research and analysis and seek the opinion of a financial expert.
By examining Twitter's financial data, we can see that the company consistently experienced negative cash flows from investment operations. The biggest negative cash flow occurred in 2018, when the company aggressively invested in long-term assets, leading to a $2,055.5 million cash outflow. Twitter has yet to be able to produce positive operating cash flows despite these investments, notably $632.7 million in 2021.
Due mostly to debt repayment and share buybacks, Twitter has had negative cash flows from financing activities in the majority of years. The business experienced negative financing cash flows of $472.8 million in 2021, which shows that it paid off debt and repurchased shares during the year.
Although Twitter's capacity to produce positive operational cash flows suggests that the firm has been able to support its investments from its core operations, some investors may find the negative cash flows from investing and financing activities to be concerning. Before making any investment decisions, investors need also consider other aspects like Twitter's competitive position in the social media sector, its growth prospects, regulatory concerns, and any potential legal or reputational issues.
Twitter's receivables the corporation hasn't given a breakdown of its receivables by customers. If there is a substantial concentration of accounts receivable due from a single customer, this could put Twitter's cash flow at risk. The ability of Twitter to collect on its account’s receivable may also be impacted by any economic crisis that could affect its clients. Twitter's requirement to pay its debts and interest, could result in future cash flow problems, which would be quite worrying (Exhibit 2).
Future fixed asset purchases by Twitter are another aspect to consider. The corporation may need to make investments in new assets to sustain its growth as its current fixed assets lose value. It's critical that Twitter has enough cash on hand to make these purchases given its recent investments in long-term assets and the possible need for additional investments in the future. As of 2021, Twitter had $2186 Million in cash and cash equivalents on hand, which is a healthy cash position. As a result, the business should have the means to pay its debts, support its expansion, and make the necessary investments in fixed assets (Exhibit 3).
Financial Analysis: Ratio Analysis from where we got the numbers ? Please include that on exhibit according to the standard of the sample provided please?
Financial ratios for Twitter display a range of results. The market valuation of the company has fluctuated, rising 73.09% in 2019 and then falling 19.76% in 2020. The company's PE ratio is negative, which means that its earnings are declining. The company's PS ratio of 6.81 and PB ratio of 4.73, which are both higher than the industry averages, indicate that the market places a higher value on Twitter's assets and sales than on its earnings. A negative cash flow and earnings are also indicated by the P/FCF ratio and EV/EBITDA ratio, which both have negative values. With a debt-to-equity ratio of 0.76 and a debt-to-EBITDA ratio of 29.99, the company has relatively high debt ratios. Yet, a strong current ratio of 5.89 indicates that the business has adequate short-term assets to meet its short-term liabilities. In recent years, the company's return on equity (ROE) and return on assets (ROA) have both been negative, indicating that it is not making a profit from its investments. Overall, the financial ratios of Twitter point to a mixed performance, with some positive indicators like the PS ratio and current ratio and some bad ones like the PE ratio and declining earnings. Twitter appears to have a healthy liquidity position based on its financial statistics. As long as the company's current ratio is over 5, it has adequate liquid assets to satisfy its short-term liabilities. This is a good indicator for Twitter's financial health as it implies that the firm has enough cash and cash equivalents on hand to cover its immediate obligations. The fact that Twitter consistently produces positive operating cash flows also strengthens its liquidity position. But, it's critical to keep in mind that liquidity can be impacted by a variety of circumstances, such as alterations in market conditions or unanticipated costs, so Twitter must continue to monitor and preserve its liquidity position moving ahead.
Twitter's current ratio for 2021 is 7.15, which means that for every $1 in current obligations, the business has $7.15 in current assets. This is a good liquidity position, and it's important to note that over the previous ten years, the current ratio has constantly been higher than 5. Twitter earned $632.7 million in operating cash flows in 2021, which is a good sign for its financial position. Also, it's important to note that Twitter had a net cash flow of $212.5 million in 2021, which means that the company experienced more cash inflows than withdrawals during the course of the year. Although these figures are encouraging, it's critical to remember that liquidity can be impacted by a variety of events, thus Twitter must continue to monitor and maintain its liquidity situation. Currently, Twitter's liquidity ratios are robust, showing a good ability to cover future costs and debts. Their current ratio and quick ratio as of 2020 were both close to 1.5:1, showing that they have enough short-term assets to pay their short-term liabilities. They also have cash and short-term investments totaling more than $8.7 billion. The days of accounts receivable for Twitter have climbed from 39 days in 2019 to 47 days in 2020, though, and this is important to note. This implies that it is taking them longer to receive money for their sales, which can have an impact on their capacity to make future debt and interest payments. Twitter must keep a careful eye on their accounts receivable and take the appropriate action to timely collect on them.
In 2020, Twitter's age of payables will be 65 days as opposed to 76 days in 2019. This shows that Twitter is paying its vendors faster than it was a year ago. The fact that it is still longer than the 45–50 day industry norm suggests that Twitter may be taking advantage of the favorable credit terms provided by its suppliers. While this may have some short-term liquidity advantages, it may have long-term negative effects on the company's relationships with its suppliers. Furthermore, a rise in the age of payables may be a warning of deteriorating financial conditions, but Twitter's healthy cash position and steady profitability indicate that this is not a major concern for the business at this time. In the future, it will be crucial to keep an eye on changes in the age of payables to make sure Twitter is properly managing its cash flow and keeping its suppliers happy.
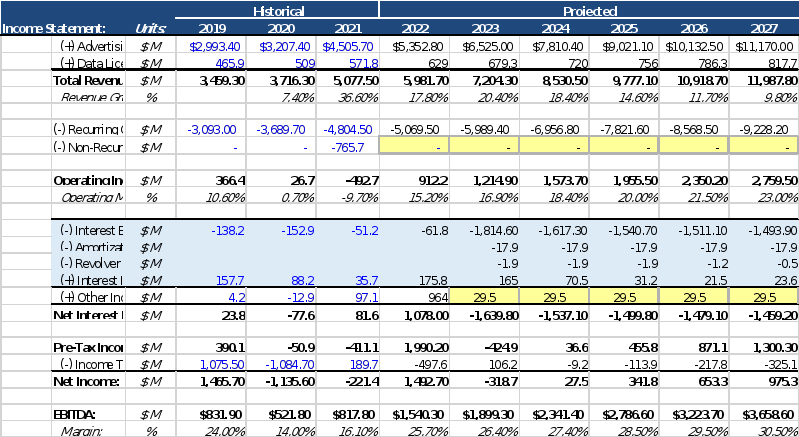
Financial Analysis: Projections 2 from where we got the numbers ? Please include that on exhibit according to the standard of the sample provided please?
A summary of the financial estimates for Twitter condensed into Twitter size. Twitter's financial estimates anticipate that revenue growth will climb by 25% in 2022, followed by a 15% increase in revenue growth for each of the next five years after that. It is anticipated that the EBITDA margin will be around 16.11 percent in 2021 and will rise to 27 percent by 2027, while the proportion of revenue spent on capital expenditures will remain constant at 9 percent over the next five years. Twitter has a positive cash flow projection available to repay debt, and it is expected that cash flow to equity would increase to $6.1 billion by 2026. This means that Twitter will be able to repay its debt. It is anticipated that the terminal value of equity (TVE) will reach $311 million in the year 2026, and the total debt-to-EBITDA ratio will be zero at that time. It is anticipated that the interest coverage ratio would rise from 2.68 in the year 2023 to 4.14 in the year 2025.
According to the financial forecasts, it is anticipated that Twitter will have a positive net income during the next five years, with the net income forecasted to climb from $3.2 billion in 2021 to $4.7 billion by 2025. It is anticipated that the company will have a positive cash flow available to repay debt within the next five years, and the taxes paid by the company are anticipated to account for around 25 percent of its net income. The projected balance sheet for Twitter reveals that the company is anticipated to own a sizeable long-term asset in the form of a terminal EBITDA multiple of 25. This is seen in the balance sheet. The estimated liabilities consist of a combined interest rate on the company's debt, and it is anticipated that the business would keep a certain minimum cash level. In the next five years, according to Twitter's financial estimates, the company will experience both positive growth and stable operations. It is anticipated that Twitter will have a positive cash flow available to service its debt as a result of the company's rising sales and positive net income expectations. Additionally, the predicted interest coverage ratio and debt-to-EBITDA ratio of the company both point to the company being financially stable.
Comparable company analysis (COMPs)
A Comparable Company Analysis, often known as COMPs, is a way of determining the worth of a company by comparing it to other companies that operate in the same sector as it does or that have business strategies that are comparable to its own. Utilizing the financial measurements and ratios of comparable organizations, this approach involves conducting research on those businesses in order to arrive at an estimate of the worth of the business in question.
Multiples such as Price-to-Earnings (P/E), Enterprise Value-to-Revenue (EV/Revenue), and Enterprise Value-to-EBITDA (EV/EBITDA) can be utilized in the course of a COMPs analysis. This is one of the ways the analysis can be carried out. The formula for determining these multiples is to divide the market capitalization or enterprise value of a firm by the company's earnings, revenue, or EBITDA, in that order.
For the purpose of selecting comparable companies for this study, we can look for organizations that are active in industries that are equivalent to the one we are analyzing or that have business models that are similarly to the one being analyzed. If we are investigating a social media firm, for instance, we can search for other social media companies that have user bases, income streams, and growth prospects that are comparable to the one we are analyzing. Then, in order to gain an assessment of the value of the target firm, we can compare their financial measures and ratios to those of the target company.
Exhibit 3 shows a table with P/E ratio
Price-to-Earnings (P/E) Where is the explanation of the P/E ratio? Please add in the exhibits from where you got the numbers of the other competitos.
The enterprise value of a firm is evaluated using a metric called the EV/Revenue ratio, which compares that value to the company's revenue. Enterprise value takes into account debt, equity, and cash. It gives an indicator of how much money investors are ready to part with in exchange for one dollar of a company's revenue. When compared to the firm's revenue, an Enterprise Value to Revenue (EV/Revenue) ratio that is lower than one suggests that the company is undervalued, while an EV/Revenue ratio that is higher than one suggests that the company is overpriced.
The enterprise value to revenue ratio for Twitter in 2021 was 7.19, which indicates that investors were willing to spend $6.8 for every dollar of Twitter's revenue. This is lower than the 11.3 average for the industry, which shows that Twitter may have been undervalued in comparison to its competitors (Vincent, 2022).
When looking at Twitter's EV/Revenue ratio in comparison to those of its competitors, we can see that it was lower than that of Meta Platforms Inc. (8.6), Pinterest Inc. (8.9), Match Group Inc. (14.5), and Bumble Inc. (7.7) This suggests that Twitter may have been a more attractive investment prospect in terms of its valuation.
Nevertheless, Weibo Corporation had the lowest enterprise value to revenue ratio of all the companies in the group, which indicated that it may have been undervalued in comparison to its revenue. This was indicated by the fact that it had a value of 2.6.
Enterprise Value-to-Revenue (EV/Revenue), from where we got the numbers? There is no reference like the one used above for P/E ratio. Please include that on exhibit according to the standard of the sample provided, please. Cz the professor will refer the numbers with the exhibit.
The enterprise value of a firm is evaluated using a metric called the EV/Revenue ratio, which compares that value to the company's revenue. Enterprise value considers debt, equity, and cash. It gives an indicator of how much money investors are ready to part with in exchange for one dollar of a company's revenue. When compared to the firm's revenue, an Enterprise Value to Revenue (EV/Revenue) ratio that is lower than one suggests that the company is undervalued, while an EV/Revenue ratio that is higher than one suggests that the company is overpriced.
The enterprise value to revenue ratio for Twitter in 2021 was 6.8, which indicates that investors were willing to spend $6.8 for every dollar of Twitter's revenue. This is lower than the 11.3 average for the industry, which shows that Twitter may have been undervalued in comparison to its competitors.
When looking at Twitter's EV/Revenue ratio in comparison to those of its competitors, we can see that it was lower than that of Meta Platforms Inc. (8.6), Pinterest Inc. (8.9), Match Group Inc. (14.5), and Bumble Inc. (7.7) This suggests that Twitter may have been a more attractive investment prospect in terms of its valuation.
Nevertheless, Weibo Corporation had the lowest enterprise value to revenue ratio of all the companies in the group, which indicated that it may have been undervalued in comparison to its revenue. This was indicated by the fact that it had a value of 2.6.
Enterprise Value-to-EBITDA (EV/EBITDA)
Enterprise Value to Earnings Before Interest, Taxes, Depreciation, and Amortization, or EV/EBITDA for short, is a financial ratio that assesses the value of a firm in relation to its EBITDA, or earnings before interest, taxes, and amortization. It is a tool that is frequently utilized by investors and analysts to ascertain whether a company's current market valuation is excessive or insufficient.
When we compare the enterprise value to earnings before interest, taxes, and amortization (EV/EBITDA) ratios of Twitter and its competitors in the year 2021, we find that Twitter's ratio is 41.9. This suggests that the market is willing to pay a premium for Twitter's EBITDA in comparison to the worth of the company overall. However, it is essential to point out that Twitter's enterprise value to earnings before interest, taxes, depreciation, and amortization ratio is greater than that of some of its competitors, such as Weibo Corporation, which has a ratio of 7.4. This indicates that the market may view Twitter's EBITDA as having greater value than that of Weibo Corporation. Before making any investment decisions that are entirely based on EV/EBITDA ratios, it is essential, however, to take into account the overall financial health and performance of each firm. It is important to keep in mind that the EV/EBITDA ratio can be affected by a variety of factors, including debt levels, the amount spent on capital expenditures, and policies regarding depreciation. Therefore, it is essential to do research on a variety of financial ratios in addition to other indicators in order to obtain a comprehensive picture of a company's current and future financial condition and prospects.
LBO model (Dont change anything here. I got the numbers from calculation)
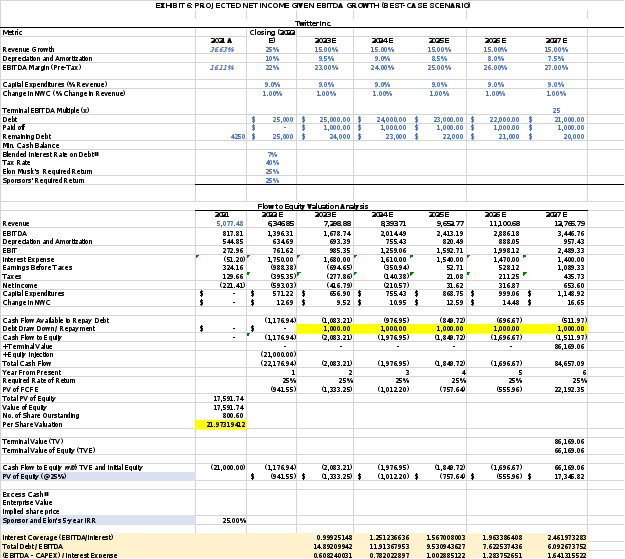
Revenue growth is projected to occur over the course of the following six years, rising from $5.077 billion in 2021 to $12.765 billion in 2027 at an average annual growth rate of 15% from 2022. Over the following five years, we anticipate a moderate rise in EBITDA margin, with the margin rising from 16.11% in 2021 to a forecasted of 27% in 2027. We count on a 3% annual growth rate. Additionally, a 25x EBITDA exit multiple is assumed. On the other hand, the shareholders’ required rate is around 25% based on the given case.
The solution given is only a base model, though, and the real valuation may vary depending on a number of other variables and market conditions. Before making any investment selections, it's crucial to complete rigorous research and due diligence (Exhibit 5).
A Sensitivity Analysis of Base Model (Dont change anything here. I got the numbers from calculation)
We can change the assumptions for the EBITDA margin and EV/EBITDA multiple and track their effects on the final valuation to do a sensitivity analysis of the LBO model's per-share valuation. The per-share valuation for Twitter in our LBO model is $21.97 assuming a base EBITDA margin of 22% and an EV/EBITDA multiple of 25x. The per-share valuation would rise to $27.43 if we changed the EV/EBITDA multiple to 30x and reduced the EBITDA margin to 17%. The per-share valuation would drop to $16.14 if we instead reduced the EBITDA margin to 17% and the EV/EBITDA multiple to 20x.
On the other side, the per-share valuation would rise to $28.11 if we increased the EBITDA margin to 35% and increased the EV/EBITDA multiple to 30x. However, the per-share price would drop to $16.82 if we increased the EBITDA margin to 35% and decreased the EV/EBITDA multiple to 20x. We can see that the per-share valuation in an LBO model can be significantly impacted by changes in the EBITDA margin and EV/EBITDA multiple.
Compare the valuation obtained from the two methods
Although the strategy and underlying assumptions of the two valuation techniques, DCF and LBO, differ, both are helpful in estimating a company's intrinsic worth. The LBO technique is more short-term and focuses on the company's ability to service debt, whereas the DCF method is more long-term and concentrates on the company's future cash flows. Using the underlying assumptions, Twitter is valued at $35.82 per share on a DCF basis. Using the underlying assumptions, Twitter is valued at $21.97 per share in an LBO.
We may employ the weighted average approach to average these valuations and determine a final per-share valuation or range of valuations. Based on how confident we are in the underlying assumptions and the methodology, we can allocate different weights to each value. For instance, we might give that valuation a larger weight if we are more confident in the DCF approach and the underlying assumptions.
The weighted average per-share valuation would be ($35.82 + $21.97) / 2 = $28.90 if we give the DCF and LBO valuations equal weights. But we may also make use of a variety of per-share valuations that take the outcomes of the sensitivity analysis into account. According to the sensitivity analysis, depending on the assumptions made, the per-share valuation range for Twitter may be between $24.85 and $61.20.
Recommendation & Plan of Action What is the recommendation?
P/E, EV/Revenue and EV/EBITDA were used to analyze Twitter's valuation, and the results show that the firm is now undervalued in comparison to its competitors. The negative P/E ratio, however, raises the possibility that investors may lack faith in the company's future earnings potential.
The DCF technique yields a greater valuation of $35.82 per share compared to the LBO method's valuation of $21.97 per share in the analysis of Twitter's valuation using both the DCF and LBO methods.
We may apply a weighted average of the two valuations, taking into account our confidence in the underlying assumptions and methodologies, to arrive at a final per-share price. The weighted average per-share valuation would be $28.90 if the DCF and LBO valuations were given equal weights. However, the results of the sensitivity analysis show that adjustments to important variables like the EBITDA margin and EV/EBITDA multiple can significantly affect the per-share valuation. As a result, it's crucial to take into account a variety of per-share valuations that take the outcomes of the sensitivity analysis into account. According to the sensitivity analysis, based on the assumptions utilized, the per-share valuation for Twitter might range from $24.85 to $61.20. According to the analysis, Twitter is a promising investment opportunity. Depending on their risk appetite and investment objectives, potential investors could take a look at a variety of investment options, such as a long-term buy-and-hold strategy or an LBO plan.
Risks associated with Elon Musk’s acquisition of Twitter.
First, Musk may be disappointed with Twitter's financial performance and growth prospects, which may cause the company's valuation to decrease and result in a potential loss on his investment. Musk's assertive management style and propensity for provocative statements could also have a detrimental effect on Twitter's brand reputation and user engagement, which could have an impact on the company's financial success.
Second, substantial funding would be needed for the acquisition, either from Musk's personal cash or from outside finance sources. This would result in a considerable rise in debt levels, which would raise the company's risk of going bankrupt and might prevent it from pursuing any future growth possibilities.
Third, the acquisition might pose regulatory and legal issues, especially if Musk were to use his control over Twitter to advance his own agendas or to sway the platform's content. Legal disputes and regulatory inquiries could result from this, which could have a bad effect on the company's standing and financial results.
There are further possible issues connected to Elon Musk purchasing Twitter in addition to these threats. For instance, conflicts of interest with Twitter's editorial policies or business alliances may arise due to Musk's current commercial interests in sectors like space exploration and electric automobiles. The company's relationships with sponsors, partners, and users may suffer as a result of any perceived bias or favoritism.
Additionally, Musk's penchant for taking risky, erratic decisions could produce uncertainty and volatility in Twitter's business operations and financial results. For instance, without sufficient planning or input, he might decide to make big changes to the platform's business model, user interface, or content policies, which could result in negative feedback from users, a decline in engagement, and financial losses.
The effect Musk's public character and personal brand may have on Twitter's reputation and image is another possible concern. On social media, Musk has a sizable and devoted following, but he is also well-known for his contentious remarks and provocative actions. He could harm the reputation of the business and alienate some of its user base if he used Twitter as a forum for his personal opinions or to start public fights.
Incorporating a new ownership structure and leadership team into Twitter's current operations runs the danger of creating operational and cultural difficulties. It's possible that Musk's management style and strategic interests do not match those of Twitter's current staff and stakeholders, which could cause tensions and make it challenging to achieve a successful integration strategy.
Exhibit 1
Graph 1
Exhibit 2
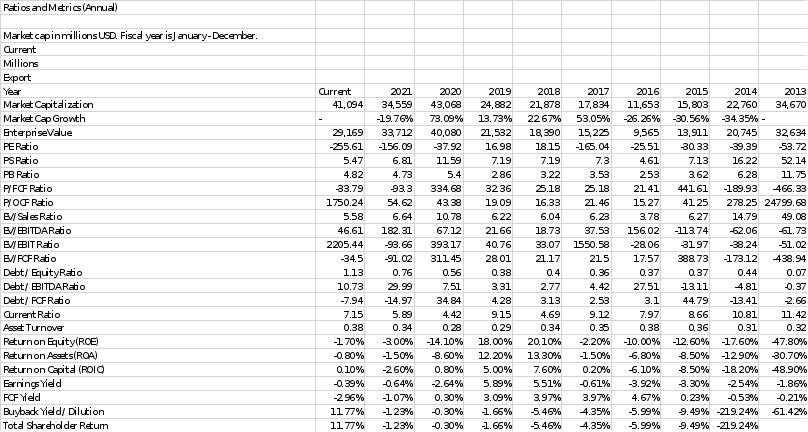
Exhibit 2
| Year | Accounts Receivable (in thousands) |
| 2020 | $188,039 |
| 2019 | $67,000 |
| 2018 | $130,871 |
Graph 2

Exhibit 3
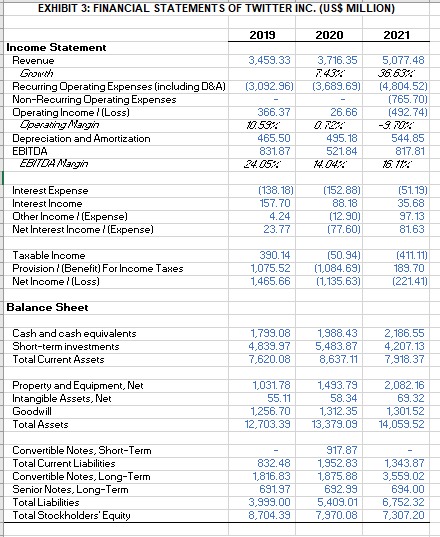
Exhibit 4
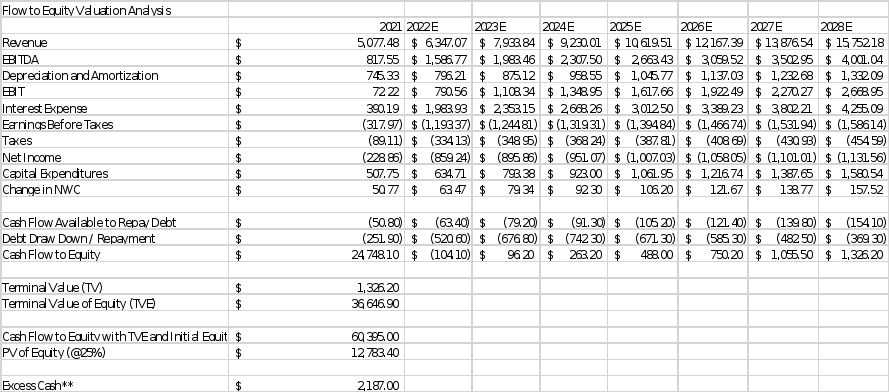
Exhibit 5
| PE Ratio | |
| COMPANY | 2021 |
| Twitter Inc. (TWTR) | -94.29 |
| Meta Platforms Inc. (FB) | 24.06 |
| Pinterest Inc. (PINS) | 66.09 |
| Snap Inc. (SNAP) | -32.13 |
| Weibo Corporation (WB) | 20.79 |
| Match Group, Inc. (MTCH) | 70.72 |
| Bumble Inc. (BMBL) | 57.20 |
Exhibit 6
References
Teoli, D., Sanvictores, T., & An, J. (2019). SWOT analysis.
Longhurst, G. J., Stone, D. M., Dulohery, K., Scully, D., Campbell, T., & Smith, C. F. (2020). Strength, weakness, opportunity, threat (SWOT) analysis of the adaptations to anatomical education in the United Kingdom and Republic of Ireland in response to the Covid‐19 pandemic. Anatomical sciences education, 13(3), 301-311.
Vincent Pham. (2022) Is Twitter a Good Buy at $44 Billion? | Hudson. Retrieved April 10, 2023, from https://www.hudson.org/economics/is-twitter-a-good-buy-at-44-billion
https://valueinvesting.io/TWTR/valuation/wacc


