Instructions: To complete Lab 1, you will be required to compose a comprehensive report based on survey research. The report will mainly focus on two significant aspects: a thorough literature review
Age of ParticipantsDescriptives
Age
99
Missing
Mean
33.5
Median
29
Standard deviation
15.2
Minimum
19
Maximum
85
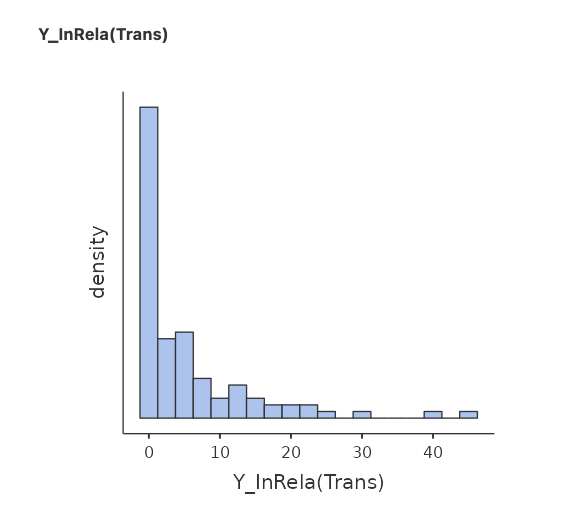
Years in a Relationship
| Descriptives | |||
|
| Y_InRela(Trans) | ||
| 99 | |||
| Missing | |||
| Mean | 5.54 | ||
| Median | |||
| Standard deviation | 8.50 | ||
| Variance | 72.3 | ||
| Minimum | |||
| Maximum | 45 | ||
Race/Ethnicity Breakdown
| Frequencies of Race/Ethn | |||||||||
| Race/Ethn | Counts | % of Total | Cumulative % | ||||||
| Black/African American | 30 | 30.9 % | 30.9 % | ||||||
| White/Caucasian (Not Hispanic) | 48 | 49.5 % | 80.4 % | ||||||
| Asian | 6.2 % | 86.6 % | |||||||
| Hispanic/Latino(a) | 7.2 % | 93.8 % | |||||||
| Pacific Islander | 1.0 % | 94.8 % | |||||||
| Bi-racial/Multi-racial | 4.1 % | 99.0 % | |||||||
| Other | 1.0 % | 100.0 % | |||||||
Frequency of Romantic Status
| Frequencies of Rom_Stat | ||||||||
| Rom_Stat | Counts | % of Total | Cumulative % | |||||
| Single, not dating | 19 | 19.2 % | 19.2 % | |||||
| Casually dating | 6.1 % | 25.3 % | ||||||
| Dating someone exclusively | 49 | 49.5 % | 74.7 % | |||||
| Married | 25 | 25.3 % | 100.0 % | |||||
Frequency of Education
Frequencies of Edu
Edu
Counts
% of Total
Cumulative %
High school or equivalent
8.1 %
8.1 %
Vocational/technical school (2 years)
1.0 %
9.1 %
Some college
39
39.4 %
48.5 %
Bachelor's degree
24
24.2 %
72.7 %
Master's degree
12
12.1 %
84.8 %
Doctoral degree
2.0 %
86.9 %
Associate's degree
13
13.1 %
100.0 %
Gender of Participants
| Frequencies of Gen | |||||||||
| Gen | Counts | % of Total | Cumulative % | ||||||
| Male | 19 | 19.2 % | 19.2 % | ||||||
| Female | 79 | 79.8 % | 99.0 % | ||||||
| Other or decline to report | 1.0 % | 100.0 % | |||||||
Sexual Orientation
| Frequencies of Sex_Orient | ||||||||||
| Sex_Orient | Counts | % of Total | Cumulative % | |||||||
| Homosexual/Gay | 9.2 % | 9.2 % | ||||||||
| Heterosexual/Straight | 80 | 81.6 % | 90.8 % | |||||||
| Bisexual | 5.1 % | 95.9 % | ||||||||
| Decline to comment | 1.0 % | 96.9 % | ||||||||
| Other | 3.1 % | 100.0 % | ||||||||


