Position and Velocity
Position, Velocity & the Moving ManBackground Reading: p. 37 - 56 the Physics Text, PDF pages 55 – 74 (Week 1 Content folder)
Objectives:
Examine position-time graphs and velocity-time graphs to:
Determine the speed of an object that is stationary.
Determine the constant speed of an object in uniform motion.
Describe an object’s acceleration.
Watch: What's the Fastest Speed a Person Could Run?
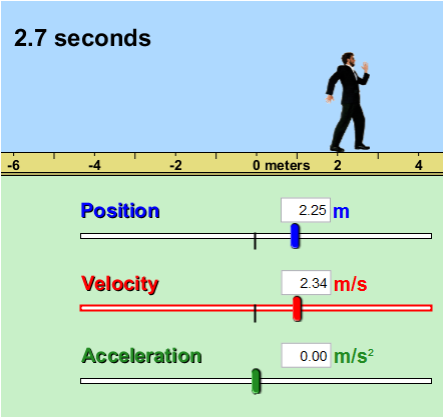
Simulation: The Moving Man
This work needs to be completed in a continuous time frame. If you stop while working you will have to reset the simulation and start from the beginning. Approximate work time: 90 – 120 minutes. This includes the time it will take to both run the simulation and complete this observation sheet. Each item is worth 3 points. Type or write your responses below the question on this document.
Representations of Motion
What does a graph tell us about the motion of an object? Graphs are used in science and many other areas to record and convey a lot of information. They provide a compact way to tell the whole history of an object's motion.
There are two tabs for this simulation, called "Introduction" and "Charts." For today's activity, you will need only the "Introduction" tab.
Play with the controls of the simulation to get used to the controls. Can you find...
two ways to move the man around?
how to make the man move automatically?
how to record and playback the man's motion?
how to playback the man's motion in slow motion?
how to quickly reset the man to starting conditions?
Reset all of the man's values to zero.
Using the position slider, set the man to stand near the tree. Give him a velocity of 1.2 m/s (and an acceleration of 0).
Click to start the man in motion until he hits the wall, then hit to stop recording.
Use the playback feature to answer these questions.
What happened to the blue position slider as the man moved across the screen?
What happened to the red velocity slider as the man moved across the screen?
Use the playback feature to record the man's position and velocity data.
| Time (s) | Position (m) | Velocity (m/s) |
| 0.0 | ||
| 1.0 | ||
| 2.0 | ||
| 3.0 | ||
| 4.0 | ||
| 5.0 | ||
| 6.0 | ||
| 7.0 | ||
| 8.0 | ||
| 9.0 | ||
| 10.0 |
Plot your data in the graphs below:
![Position and Velocity 2]()
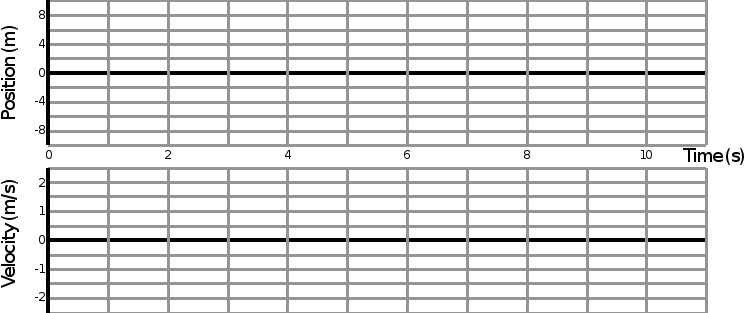
According to your graphs...
What shape is your position graph?
What is the slope of your position graph?
Why does or doesn't your answer to b. make sense?
What shape is your velocity graph? Is it horizontal, vertical, or diagonal?
Why does or doesn't your answer to d. make sense?
Reset all of the man's values to zero.
Using the position slider, set the man to stand near the tree. Give him a velocity of 0 m/s and an acceleration of 0.5 m/s2.
Click to start the man in motion until he hits the wall, then hit to stop recording.
Use the playback feature to answer these questions.
What happened to the blue position slider as the man moved across the screen?
What happened to the red velocity slider as the man moved across the screen?
Use the playback feature to record the man's position and velocity data.
| Time (s) | Position (m) | Velocity (m/s) |
| 0.0 | ||
| 1.0 | ||
| 2.0 | ||
| 3.0 | ||
| 4.0 | ||
| 5.0 | ||
| 6.0 | ||
| 7.0 | ||
| 8.0 | ||
| 9.0 | ||
| 10.0 |
Plot your data in the graphs below:
![Position and Velocity 3]()
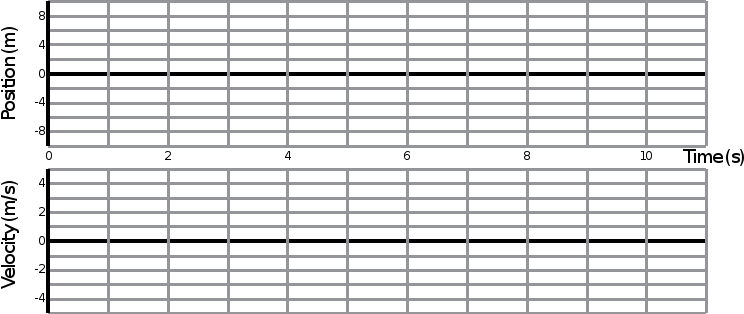
According to your graphs...
What shape is your position graph?
Why does or doesn't your answer to a. make sense?
What shape is your velocity graph?
Why does or doesn't your answer to c. make sense?
What is the slope of your velocity graph?
What does the slope of the velocity graph represent?
What happens to the man when he is accelerating?
What is the difference between an object with constant acceleration and an object with constant speed?
Complete the following sentences:
"The slope of a linear position graph tells us the _________________________ of the object."
"The slope of a linear velocity graph tells us the _________________________ of the object."
"For an object moving at a constant speed, we would expect to see a position graph with a ___________________ shape and a velocity graph with a ___________________ shape."
"For an object moving at a constant acceleration, we would expect to see a position graph with a ___________________ shape and a velocity graph with a ___________________ shape."


