SLP/BUS520 Business Analytics And Decision Making Business Analytics & Intelligence Reporting Final Analysis **Complete Module 4 SLP before Module 4 Case** We have been working with survey data
BUS520 Case 2
BUS520 Case 2
Trident University International
BUS 520 Business Analytics and Decision Making
May 26, 2024
Analyzing job satisfaction is essential for organizations to make changes and ensure employees are happy. This paper will involve an analysis of the department and three factors: extrinsic, intrinsic, and job satisfaction. (Kim, 2017). It will be based on the hypothesis that some employees are more satisfied than others.
ANOVA 1

(Table 1: department and job satisfaction pivot chart)
The graph above shows the satisfaction levels of three groups of employees. The interpretation is that the supervisors are more satisfied than the frontline workers and the managers. In contrast, the managers are less satisfied.
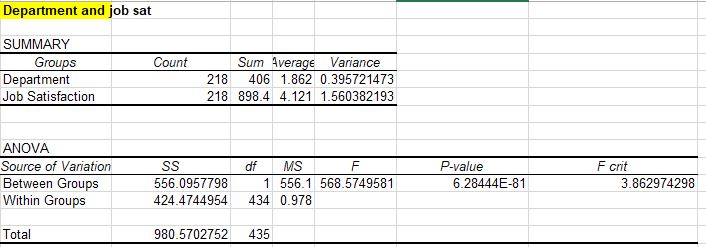
(Table 2: department and job satisfaction ANOVA chart)
Based on the analysis, the p-value of 6.28444E-81 is lower than the alpha of 0.05. In contrast, the F value is higher than the f-critical value. This means that the null hypothesis will be rejected. This supports the alternative hypothesis that the department determines satisfaction levels where supervisors are more satisfied. According to Kabir & Parvin (2011), the department determines the satisfaction level of their workplaces.
ANOVA 2
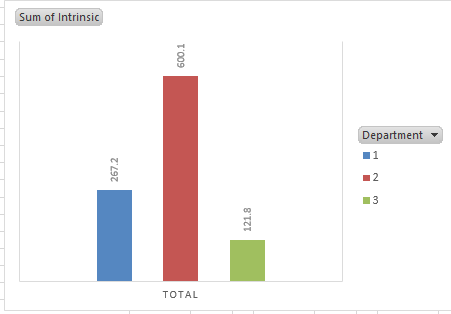
(Table 3: department and intrinsic satisfaction pivot chart)
Based on the figure above, there is a variation between the employees' intrinsic job satisfaction and the department they work in. The pivot chart shows that the supervisors are the most satisfied. In contrast, the managers are the least satisfied. There is no medium conclusion from the data; therefore, additional analysis is required.
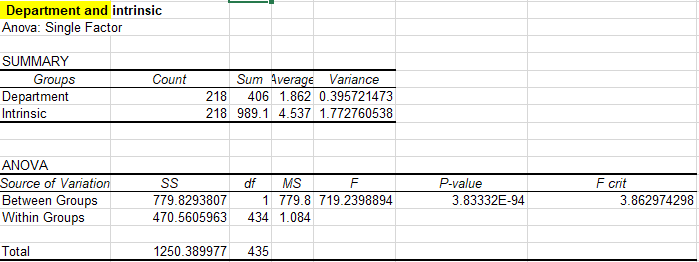
(Table 4: department and intrinsic satisfaction ANOVA chart)
Based on the analysis above, the p-value of 3.83332E-94 is way below the 0.05 alpha level. In contrast, the f-value is higher than the f-critical values. Therefore, the null hypothesis is rejected. In contrast, the alternative hypothesis that the department determines intrinsic job satisfaction is accepted. This means that the employee's male or female gender within the department is critical in determining the satisfaction levels within different departments.
ANOVA 3

(Table 5: Department and extrinsic satisfaction pivot chart)
Based on the figure above, there is a difference in job satisfaction between the three departments provided in the Excel file. The supervisors have the highest satisfaction levels. Meanwhile, the managers have the lowest, seconded by the frontline workers.

(Table 6: Department and extrinsic satisfaction ANOVA chart)
Based on the analysis above, the p-value of 5.59E-107 is way below the 0.05 alpha level. In contrast, the f-value is higher than the f-critical values. Therefore, the null hypothesis is rejected. In comparison, the alternative hypothesis that the department determines extrinsic job satisfaction is accepted. Paais & Pattiruhu (2020) insist that the employee's work level determines satisfaction. As the level goes higher, the satisfaction increases. However, this Excel file is different from the case the case since managers have the lowest satisfaction levels.
Conclusion
Hypothesis testing is essential to determining the validity and reliability of outputs. This study tested whether there are different satisfaction levels according to an employee's department. The results showed that managers were the least satisfied. In contrast, the supervisors were the most satisfied group, followed by frontline workers. This suggests the organization should develop measures to increase managers' satisfaction since they determine output levels.
References
Kabir, M. N., & Parvin, M. M. (2011). Factors affecting employee job satisfaction in the pharmaceutical sector. Australian journal of business and management research, 1(9), 113-123.
Kim, T. K. (2017). Understanding one-way ANOVA using conceptual figures. Korean journal of anesthesiology, 70(1), 22.
Paais, M., & Pattiruhu, J. R. (2020). Effect of motivation, leadership, and organizational culture on satisfaction and employee performance. The Journal of Asian Finance, Economics and Business, 7(8), 577-588.


