worksheet not hard have to show work
Statistical Analysis in Criminal Justice Problem Set # 2Name_________________________________________________________________
PurposeIn these problems, you will:
Demonstrate your ability to evaluate and use an excel spreadsheet
Develop and interpret charts and graphs
Use the excel data in the folder “Excel Data for Class & Problem Sets” to answer the following questions. You must upload your own Excel Workbook as your Problem Set in iCollege. Please insert a new sheet into the Workbook and label it PS2. Do all of your work in this sheet PS2.
Your homework must be completed independently, or it is considered academic dishonesty
1. In a sample of police officers, the number of times they pulled over a person for making an illegal turn last month:
2, 10, 15, 7, 0, 15, 10, 12, 15, 9, 10 37, 9
Present these data in a cumulative frequency distribution. Do this by hand. Also, do this excel by using the =countif function as we did in class. You must submit your excel workbook in ICollege with Sheet 1 labelled cumulative frequency distribution.
2. Based on your cumulative frequency distribution:
a. how many police officers pulled over 9 people last month?
b. what percentage of police officers pulled over more than 10 people last month?
c. what proportion of police officers pulled over 15 people last month?
d. what proportion of police officers pulled over fewer than 12 people last month?
3. You hypothesize that those with mental health disorders will be more likely to take prescription drugs than those without mental disorders. You collect data and create a cross-tab to reflect what you found. Using this cross-tab:
| Mental Health Disorder | ||
| Take Prescription Drug | Yes | No |
| Yes | 37 | 91 |
| No | 22 | 12 |
a. What proportion of the sample has a mental health disorder?
b. Of those who take prescription drugs, what percentage has a mental disorder?
c. What percentage of the sample does not take prescription drugs?
d. Of those without a mental health disorder, what proportion takes prescription drugs?
e. What is the independent variable? Is it located in the columns or rows?
4. There were 990 people shot dead by the police in 2015. Below are data reflecting the race of the VICTIM who was by the police. Based on the following information, create an appropriate chart to depict the data. Be sure to label all of the relevant parts of your chart and make it look pretty! Retrieved from https://www.washingtonpost.com/graphics/national/police-shootings/
Race f
White 494
Black 258
Hispanic 172
Other 38
Unknown 28
5. 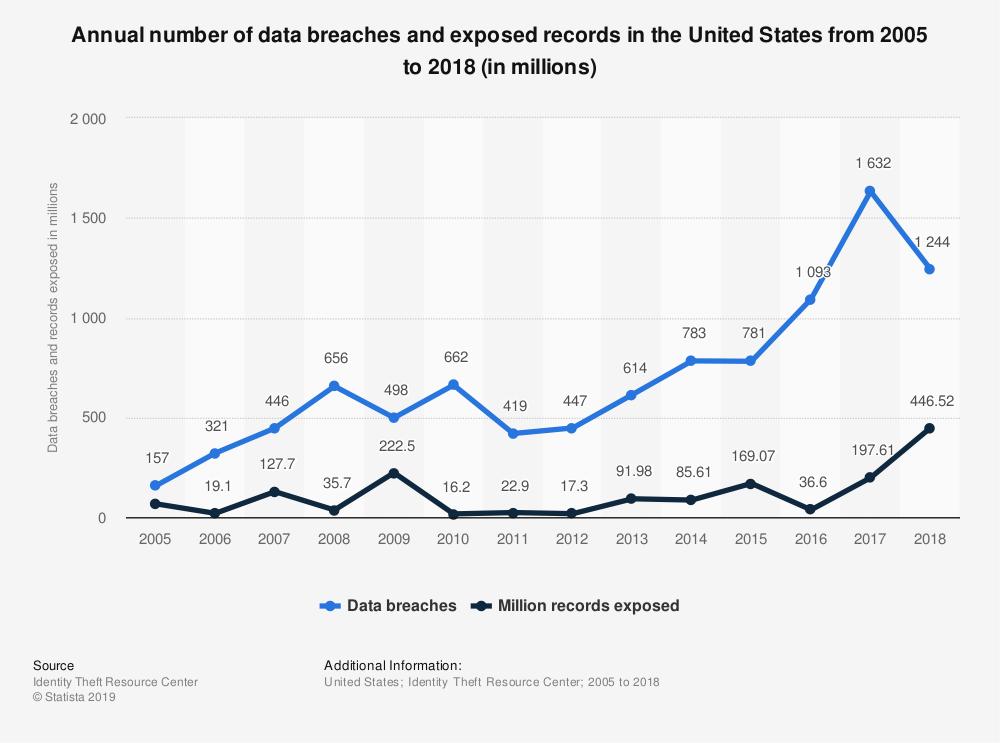
Based on this graph, answer the following:
What type of graph is this?
What year was the number of data breaches the highest?
Write two sentences to describe what is interesting from this chart. Write so that a person who did not know anything about the topic could understand.
At what year was the number of records exposed the highest?
6. Using the report found at the following link, answer the questions below: https://bjs.ojp.gov/content/pub/pdf/bwclea16.pdf
1. Using Table 1, describe the size of local police and sheriff’s offices that have at least some BWC in use.
2. What is the most common reason why BWC are acquired by departments? (i.e., what table did you look at?)
3. Do most police agencies that have BWC also have a BWC policy? How do you know? (i.e., what table did you look at?)
4.Other than what has been asked about in this question, identify one FACT that you find interesting from this report and EXPLAIN why you find it interesting.


