For this final assignment, you will combine all of the knowledge you have gained throughout this course to complete the final course project/mock study. When you complete this assignment, you will hav
RES/710 v5
Course Project Worksheet – Frequency Tables and Histograms
Complete Parts 1 and 2 below.
Part 1: Frequency TablesUsing your dataset chosen in Week 1, use Excel to complete frequency data runs for each of your variables. Then, describe each frequency table directly referencing the data in the table.
Paste your frequency tables in the appropriate sections below. Be sure to follow proper APA guidelines for each table and describe the results. Each frequency table should be described in about a paragraph and should directly reference the table.
Frequency Table for Independent Variable 1Independent Variable 1 Name: Parental Involvement
Frequency Table:
| Response Option | Frequency | Percentage |
| 1 – Not at all | 3 | 6% |
| 2 – Very little | 5 | 10% |
| 3 – Some | 12 | 24% |
| 4 – Almost always | 20 | 40% |
| 5 – Always | 10 | 20% |
| Total | 50 | 100% |
Summary and Description:
Most parents in the group said they helped their child prepare for kindergarten. About 40% said they almost always prepared their child, and 24% did some preparation. Only a few, around 6%, said they did not help. This shows that many parents were involved in the process. Helping might include discussing school, meeting the teacher, or reading together. These actions make a big difference in how children feel about starting school. Research supports this idea—parent support helps children adjust better and do well early on (Hacıibrahimoğlu, 2022; Sands & Meadan, 2023). Frequency Table for Independent Variable 2Independent Variable 2 Name: School-based Practices and Policies
Frequency Table:
| Response Option | Frequency | Percentage |
| 1 – Not at all | 2 | 4% |
| 2 – Very little | 6 | 12% |
| 3 – Some | 15 | 30% |
| 4 – Almost always | 18 | 36% |
| 5 – Always | 9 | 18% |
| Total | 50 | 100% |
Summary and Description:
Some parents said their school helped them prepare when their child started kindergarten. Around one out of three said they felt ready most of the time, and some felt ready all the time. But a few didn’t feel ready at all. That shows that not every school is giving the same amount of help. Some parents got more support than others. To fix this, schools can talk to parents early, invite them to visit, and explain what’s coming. When schools do this, kids feel better too. It’s about ensuring no one feels left out (Garber et al., 2022). Frequency Table for Dependent VariableDependent Variable Name: School Readiness
Frequency Table:
| Response Option | Frequency | Percentage |
| 1 – Not at all | 4 | 8% |
| 2 – Slightly | 6 | 12% |
| 3 – Moderately | 14 | 28% |
| 4 – Very much | 16 | 32% |
| 5 – Extremely | 10 | 20% |
| Total | 50 | 100% |
Summary and Description:
In my experience, some school leaders help the teachers when kids enter kindergarten. It makes a difference. When teachers feel supported, they can give more attention to the kids. Over half of the parents in our group felt that kind of support. However, not everyone did. A few felt like their schools did not offer much help at all. Schools should try harder to ensure every family feels ready and included (HeadStart.gov, 2023). Part 2: Histograms and GraphsUsing the same data you selected in Week 1, develop a histogram and assess the distribution of each variable. Consider why the distribution of the data is important.
Paste your histograms in the appropriate sections below. Be sure to follow proper APA guidelines for each histogram and describe the results. Each histogram should be described in about a paragraph and should directly reference the histogram.
Histogram for Independent Variable 1Independent Variable 1 Name: Parental Involvement
Histogram:
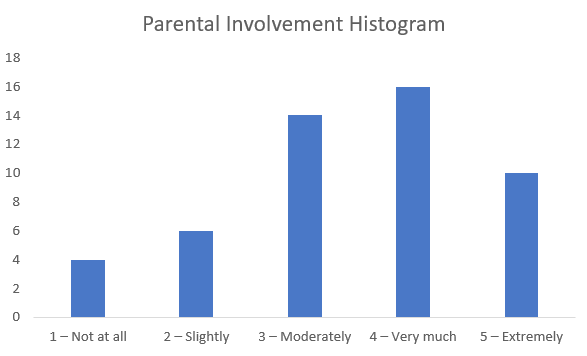
Summary and Description:
I made a chart to see how involved parents were in helping their kids before kindergarten. Most chose somewhere in the middle or close to the top of the scale. Many picked “4,” which tells me they were pretty active. Only a few said they did not help at all. Looking at the bars made it easier to notice these patterns. This shows that most parents care and try to help their kids get a good start before school begins. Histogram for Independent Variable 2Independent Variable 2 Name: School-based Practices and Policies
Histogram:
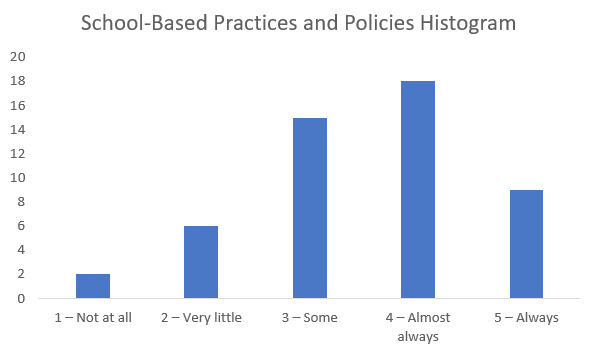
Summary and Description:
When I looked at the chart, most parents said the school did a decent job helping with the move to kindergarten. Many picked “4,” meaning they felt the school was good at it. Some picked “3,” meaning it was okay but not great. Only a couple picked “1,” so not many felt unsupported. It shows that most schools are trying, but a few might need to do more. If schools talked to families earlier, it could help a lot. Histogram for Dependent VariableDependent Variable Name: School Readiness
Histogram:
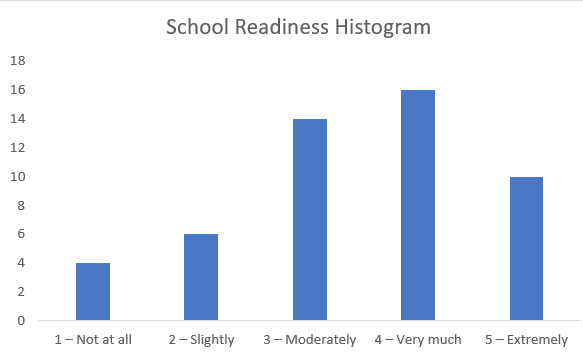
Summary and Description:
Looking at the chart, most parents felt the school gave good support to help kids prepare. Many people picked “4,” and some picked “5,” which shows they felt the help was strong. Others picked “3,” which is more in the middle. Only a few picked the low numbers like “1” or “2.” So, while most felt good about the support, not everyone did. This tells me that schools are trying, but could still do more to help every family feel ready. ReferencesGarber, K. L., Foster, T. J., Little, M. H., Cohen-Vogel, L., Bratsch-Hines, M., & Burchinal, M. R. (2022). Transition practices of rural Pre-K and kindergarten teachers and their relations to children’s academic and social skills. Early Education and Development, 34(2), 426–448. https://doi.org/10.1080/10409289.2022.2026191
Hacıibrahimoğlu, B. Y. (2022). The transition to kindergarten for children with and without special needs: Identification of family experiences and involvement. International Journal of Progressive Education, 18(2), 104–118. https://doi.org/10.29329/ijpe.2022.431.7
HeadStart.gov. (2023, September 26). Transitions. https://headstart.gov/transitions/article/transition-kindergarten
Sands, M. M., & Meadan, H. (2023). Transition to Kindergarten for Children with Disabilities: Parent and Kindergarten Teacher Perceptions and Experiences. Topics in Early Childhood Special Education, 43(4), 265–277. https://doi.org/10.1177/02711214221146748
Copyright 2021 by University of Phoenix. All rights reserved.


