lab report

Experiment 1: Diffusion through a Liquid
I n this experiment, you will observe the effect that different molecular weights have on the ability of dye to travel through a viscous medium.
| Materials 1 60 mL Corn Syrup Bottle, C12H22O11 |
Ruler |
Procedure
Use clear tape to secure one-half of the petri dish (either the bottom or the top half) over a ruler. Make sure that you can read the measurement markings on the ruler through the petri dish. The dish should be positioned with the open end of the dish facing upwards.
![]()
Carefully fill the half of the petri dish with corn syrup until the entire surface is covered.
Develop a hypothesis regarding which color dye you believe will diffuse faster across the corn syrup and why. Record this in the post-lab questions.
Place a single drop of blue dye in the middle of the corn syrup. Note the position where the dye fell by reading the location of its outside edge on the ruler.
Record the location of the outside edge of the dye (the distance it has traveled) every ten seconds for a total of two minutes. Record your data in Table 1 and use your results to perform the calculations in Table 2.
Repeat the procedure using the red dye, the unused half of the petri dish, and fresh corn syrup.
| Table 1: Rate of Diffusion in Corn Syrup | |||||
| Time (sec) | Blue Dye | Red Dye | Time (sec) | Blue Dye | Red Dye |
| 10 |
|
| 70 |
|
|
| 20 |
|
| 80 |
|
|
| 30 |
|
| 90 |
|
|
| 40 |
|
| 100 |
|
|
| 50 |
|
| 110 |
|
|
| 60 |
|
| 120 |
|
|
| Table 2: Speed of Diffusion of Different Molecular Weight Dyes | |||
| Structure | Molecular Weight | Total Distance | Speed of Diffusion |
| Blue Dye |
|
|
|
| Red Dye |
|
|
|
*Multiply the total distance diffused by 30 to get the hourly diffusion rate
Post-Lab Questions
Record your hypothesis from Step 3 here. Be sure to validate your predictions with scientific reasoning.
Which dye diffused the fastest?
Does the rate of diffusion correspond with the molecular weight of the dye?
Does the rate of diffusion change over time? Why or why not?
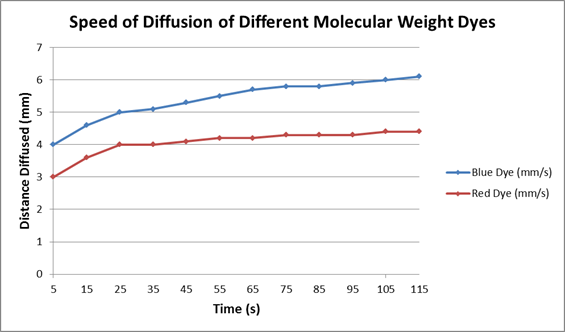
Examine the graph below. Does it match the data you recorded in Table 2? Explain why, or why not. Submit your own plot if necessary.
©eScience Labs, 2016


