Sampling and data collection in research paper
| Sampling and Data Collection in Research Paper BSHS/435 Version 1 | 104 |
CHAPTER5
A crisis counselor working with a mental health agency receives a call from the county jail. The deputy there is concerned about an inmate he describes as severely depressed. The counselor responds by asking a number of questions, attempting to make an initial assessment of the severity of the inmate’s depression. Has the inmate been eating his meals? Is he sleeping too much or too little? Is his affect flat when he responds to questions? Has he made any remarks about committing suicide? Later, the counselor may interview the inmate directly, request psychological testing, or refer him to a psychiatrist for further evaluation. Such assessments are analogous to a process in research called measurement. Just as the clinician used a variety of observations by the deputy as indicators of the inmate’s condition, researchers use various observations as indicators of the concepts of interest in a research project. Measurement refers to the process of describing abstract concepts in terms of specific indicators by assigning numbers or other symbols to these indicants in accordance with rules. At the very minimum, one must have some means of determining whether a variable is either present or absent, just as the counselor needs to know whether the inmate is eating or not. In many cases, however, measurement is more complex and involves assessing how much, or to what degree, a variable is present. An example of this is the counselor’s question about how much the inmate is sleeping, “amount of sleep” being a variable that can take on many values.
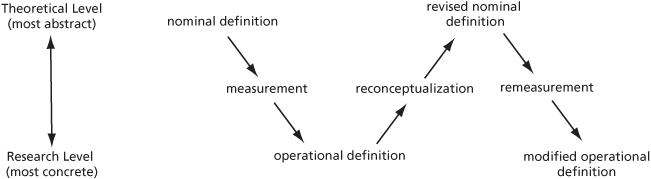
Measurement is a part of the process of moving from the abstract or theoretical level to the concrete. Recall from Chapter 2 that scientific concepts have two types of definitions: nominal and operational. Before research can proceed, researchers must translate nominal definitions into operational ones. The operational definitions indicate the exact procedures, or operations, that the researchers will use to measure the concepts. Measurement is essentially the process of operationalizing concepts. Figure 5.1 illustrates the place of measurement in the research process.
Figure 5.1 The Measurement Process
In this chapter, we discuss the general issues that relate to all measurement, beginning with some of the different ways in which we can make measurements. We then analyze how measurements that are made at different levels affect the mathematical operations that can be performed on them. Finally, we present ways of evaluating measures and determining the errors that can occur in the measurement process.
Ways of Measuring From Concepts to IndicatorsNormally, we cannot observe directly the concepts and variables that are the focus of both research and practice. We cannot see such things as poverty, social class, mental retardation, and the like; we can only infer them from something else. Take something as seemingly obvious as child abuse. Can you directly observe child abuse? Not really. What you directly observe is a bruise on a child’s back, an infant’s broken leg, or a father slapping his daughter. And even the slap may not relate to child abuse, because parents sometimes slap their children without its being a case of child abuse. However, all these things—the bruise, the broken leg, the slap—may be used as indicators of child abuse. In research and in practice, an indicator is an observation that we assume is evidence of the attributes or properties of some phenomenon. What we observe are the indicators of a variable, not the actual properties of the variable itself. Emergency room personnel may assume that a child’s broken leg is an indicator of child abuse even though they have not observed the actual abuse.
Child abuse represents a good illustration of the difficulties of moving from nominal to operational definitions with variables involving social and psychological events. At the nominal level, we might define child abuse as an occurrence in which a parent or caretaker injures a child not by accident but in anger or with deliberate intent (Gelles 1987; Korbin 1987). What indicators, however, would we use to operationalize this definition? Some things would obviously seem to indicate child abuse, such as a cigarette burn on a child’s buttock, but what about a bruise on the arm? Some subcultures in our own society view hitting children, even to the point of bruising, as an appropriate way to train or discipline them. Furthermore, some people would argue that a serious psychological disorder a child suffers is an indicator of child abuse, because it shows the parents did not provide the proper love and affection for stable development. In short, one of the problems in operationalizing child abuse, as with many other variables in human service research, is that its definition is culture-bound and involves subjective judgments. This illustrates the importance of good conceptual development and precise nominal definitions for research. It also shows how the theoretical and research levels can mutually influence one another: As we shape nominal definitions into operational ones, the difficulties that arise often lead to a reconceptualization, or a change, in the nominal definition at the theoretical level (see Figure 5.1).
The example of child abuse also illustrates another point about measurement—namely, that more than one indicator of a variable may exist. The term item is used to refer to a single indicator of a variable. Items can take numerous forms, such as an answer to a question or an observation of a behavior or characteristic. Asking a person her age or noting her sex, for example, would both produce items of measurement. In many cases, however, the process of operationalizing variables involves combining a number of items into a composite score called an index or a scale. (Although scales involve more rigor in their construction than indexes do, we can use the terms interchangeably at this point; Chapter 13 will present some distinctions between them.) Attitude scales, for example, commonly involve asking people a series of questions, or items, and then summarizing their responses into a single score that represents their attitude on an issue. A major reason for using scales or indexes rather than single items is that scales enable us to measure variables in a more precise and, usually, more accurate fashion. To illustrate the value of scales over items, consider your grade in this course. In all likelihood, your final grade will be an index, or a composite score, of your answers to many questions on many tests throughout the semester. Would you prefer that your final grade be determined by a one-item measure, such as a single multiple-choice or essay question? Probably not, because that item would not measure the full range of what you learned. Furthermore, an error on that item would indicate that you had not learned much in the course, even if the error were the result of ill health or personal problems on the day of the exam. For these reasons, then, researchers usually prefer multiple-item measures to single-item indicators.
We began this discussion by noting that because variables are abstract, we normally cannot observe them directly. Variables differ in their degree of abstraction, however, and this affects the ease with which we can accomplish measurement. In general, the more abstract the variable, the more difficult it is to measure. For example, a study of child abuse might include the variable “number of children in family,” on the theoretical presumption that large families create more stress for parents and, therefore, are more likely to precipitate abusive attacks on children. This is a rather easy variable to measure, because the concepts of “children” and “family” have readily identifiable, empirical referents and are relatively easy and unambiguous to observe and count. Suppose, however, that the child abuse study also included as a dependent variable “positiveness of child’s self-concept.” Because it can take many different forms, “self-concept” is a difficult notion to measure. Although we have narrowed it to the “positive—negative” dimension, it is still more difficult to measure than “number of children in family,” because we could ask a whole variety of questions to explore how positively people feel about themselves. We also can measure self-concept by behaviors, on the theoretical presumption that people who feel positively about themselves behave differently from those who do not. The point is that highly abstract concepts usually have no single empirical indicator that is clearly and obviously preferable to others as a measure of the concept.
We have emphasized the point that measurement involves transition from the abstract and conceptual level to the concrete and observable level, and this is what most typically occurs in research. Exploratory studies, however, can involve measurement in the opposite direction: First, we observe empirical indicators and then formulate theoretical concepts that those indicators presumably represent. In Chapter 2, we called this inductive reasoning. In a sense, you might think of Sigmund Freud or Jean Piaget as having done this when they developed their theories of personality and cognitive development, respectively. Piaget, for example, observed the behavior of children for many years as he gradually developed his theory about the stages of cognitive development, including concepts like egocentrism, object permanence, and reversibility (Ginsburg and Opper 1988). Piaget recognized that what he observed could be understood only if placed in a more abstract, theoretical context. In a sense, he measured something before he knew what it was he had measured. Once his theories began to develop, he then developed new concepts and hypotheses, and he formulated different measuring devices to test them deductively. The point is that whether one shifts from the abstract to the concrete, or vice versa, the logic is the same, involving the relationship between theoretical concepts and empirical indicators.
Techniques of MeasuringWe will discuss specific techniques for measuring variables in other chapters in this book, but we find that discussing these techniques briefly at this point helps make clear the issues surrounding measurement. Measurement techniques in the social sciences and human services vary widely, because the concepts we measure are so diverse. These techniques, however, mostly fall into one of three categories (see Figure 5.2).
Figure 5.2 The Major Strategies Used by Social Scientists to Measure Variables
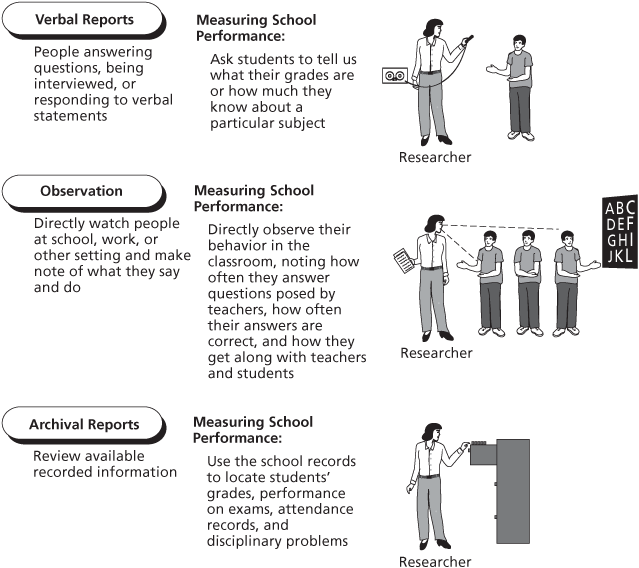
Verbal reports. This is undoubtedly the most common measurement technique in social research. It involves people answering questions, being interviewed, or responding to verbal statements (see Chapters 7 and 9). For example, research on people’s attitudes typically uses this technique by asking people how they feel about commercial products, political candidates, or social policies. In a study of school performance, to mention another example, we could measure how well students do in school by asking them what their grades are or how much they know about a particular subject.
Observation. Social researchers also measure concepts by making direct observations of some phenomena (see Chapter 9). We watch people at school or at work and make notes of what they say and do. We may even make an audio or video recording as a way of preserving the observations. In a study of school performance, we could measure how well students do in school by directly observing their behavior in the classroom and noting how often they answer questions posed by teachers, how often their answers are correct, and how they get along with teachers and students.
Archival records. Researchers also use a variety of available recorded information to measure variables (see Chapter 8). These records might take the form of statistical records, governmental or organizational documents, personal letters and diaries, newspapers and magazines, or movies and musical lyrics. All these archival records are the products of human social behavior and can serve as indicators of concepts in the social sciences. In the study of school performance, for example, a researcher could use school records to locate students’ grades, performance on exams, attendance records, and disciplinary problems as measures of how well they are doing in school.
These are the major ways that social scientists measure concepts. Researchers must specify exactly what aspects of verbal reports, observations, or available data will serve as indicators of the concepts they want to measure. In addition, researchers use some key criteria to help them decide whether a particular indicator is a good measure of some concept. These criteria will be discussed later in this chapter.
Positivist and Nonpositivist Views of MeasurementMuch of the foundation for measurement and operationalization in the social sciences derives from the work of statisticians, mathematicians, philosophers, and scientists in a field called classical test theory or measurement theory (Bohrnstedt 1983; Stevens 1951), which provides the logical foundation for issues discussed in this chapter and derives largely from the positivist view of science discussed in Chapter 2. The logic of measurement can be described by the following formula:
X = T + E
In this formula, X represents our observation or measurement of some phenomenon; it is our indicator. It might be the grade on an exam in a social research class, for example, or a response to a self-esteem scale (see Table 5.1). Also in this formula, T represents the true, actual phenomenon that we are attempting to measure with X; it would be what a student actually learned in a social research class or what his or her true self-esteem is. The third symbol in the formula, E, represents any measurement error that occurs, or anything that influences X other than T. It might be the heat and humidity in the classroom on the day of the social research exam, which made it difficult to concentrate, or it could reflect the fact that a subject incorrectly marked a choice on the self-esteem scale, inadvertently circling a response that indicated higher or lower self-esteem than he or she actually possessed.
Table 5.1 Elements in the Process of Measurement
| X | T | E | ||
| Observation | True Phenomenon | Error | ||
| Reading on a weight scale | Your actual weight | Clothing you are wearing; Heavy object in your pocket | ||
| Grade on an examination in social research class | Actual knowledge you acquired in social research class | Heat and humidity in test room; Distraction due to fight with partner | ||
| Score on a scale measuring self-esteem | Your actual level of self-esteem | Incorrectly marking a self-esteem scale; Questions on self-esteem scale that are difficult to understand |
The formula is very simple—but also very profound and important: Our measurement of any phenomenon is a product of the characteristics or qualities of the phenomenon itself and any errors that occur in the measurement process. What we strive for is measurement with no error:
E = 0
and, therefore,
X = T
The ideal to strive for is a measurement of the phenomenon that is determined only by the true state of the phenomenon itself. Scientists recognize, however, that they normally cannot achieve this ideal state in its entirety. In reality, we attempt to reduce E as much as possible. Later in this chapter, we will complicate this measurement formula a bit, but for now, it can stand as a shorthand way of understanding the process of measurement.
Before going deeper into the process of measurement, it is important to consider the nonpositivists’ critique of classical measurement theory. Many nonpositivists argue that we haven’t examined a huge assumption in this at all, one that may render the entire topic somewhat problematic. The assumption is that the phenomenon being measured (T) exists objectively in the world and that our measurement device is merely discovering it and its properties. Some things do exist in the world independently of our perceptions and our judgments about them. The computer monitor on which these words are being written, for example, has a screen that is nine inches tall—we just measured it with a ruler. Our measurement of it was a discovery of its properties, and the measurement process did not create or change those properties. Now, however, think about a social science concept, such as self-esteem. We measure it by asking subjects to agree or disagree with a series of statements. We score a “strongly agree” response as “4” and a “strongly disagree” response as “1”; then, we sum up those responses to all the separate items in the scale and give a self-esteem score that ranges from 10 to 40. What, however, is the objective reality behind this measurement? If a subject receives a score of 32 on our measurement device, what does that 32 correspond to in his or her subjective world, or mind, or consciousness? The 32 is the X in our measurement formula, but what is the T that it corresponds to? Is the link between the measurement of a computer screen and its actual length as direct as the link between the score of 32 on the self-esteem measure and the actual subjective experience of self?
The nonpositivists argue that many social science concepts do not have such clear and objective referents in the world. Our concepts are based on an intuitive and theoretical understanding of what parts of the world are like. In other words, we are constructing the world, not just discovering it. We believe that something like self-esteem exists, but it is our construction of it that we measure with the self-esteem scale, not the thing itself (if the thing itself even exists). This does not make measurement theory useless, but it does suggest that the whole process is more complicated—and not nearly as objective—as the positivists suggest. Nonetheless, many nonpositivists agree that some social science measurement can follow the model of measurement theory. Some social phenomena, such as age and sex, do have some objective existence in the world. A person’s age has something to do with how many times the earth has circled the sun since his or her birth, and sex has something to do with a person’s physical genitalia. The social significance of these characteristics is another matter, of course, but in many cases, the measurements of age and sex can follow classical measurement theory. Research in Practice 5.1 addresses some of these measurement issues in regard to the significant social issue of domestic violence.
A major problem in most measurement has to do with which indicators to use in a particular research project. This depends in part, of course, on theoretical concerns, but there are other matters to consider as well. One such matter has to do with whether a particular measure permits one to perform mathematical operations on it; we turn to this issue next.
Levels of MeasurementWe have seen just a few of the many ways of measuring phenomena, such as asking questions or noting observations. Measures differ from one another in terms of what is called their level of measurement, or the rules that define permissible mathematical operations that can be performed on a set of numbers produced by a measure. There are four levels of measurement: nominal, ordinal, interval, and ratio. If we keep in mind that variables can take on different values, then measurement basically involves assessing the value or category into which a particular entity falls. Measuring age, for example, is the process of placing each person into a particular age category.
Nominal MeasuresNominal measures classify observations into mutually exclusive and exhaustive categories. They represent nominal variables at the theoretical level. Variables such as sex, ethnicity, religion, or political party preference are examples. Thus, we might classify people according to their religious affiliation by placing them into one of five categories: Protestant, Catholic, Jewish, other, or no religious affiliation. These are mutually exclusive categories, because membership in one precludes membership in another. They are exhaustive categories because there is a category for every possible case (for this measure of religious affiliation, the “other religion” and “no religion” categories assure this). For purposes of data analysis, we might assign numbers to represent each of the categories. We could label Protestant as 1, Catholic as 2, Jewish as 3, other as 4, and no religious affiliation as 5. It is important to recognize, however, that the assignment of numbers is purely arbitrary; the numbers making up a nominal measure have none of the properties, such as ranking, ordering, and magnitude, that we usually associate with numbers. None of the usual arithmetic operations, such as adding, subtracting, multiplying, or dividing, can legitimately be performed on numbers in a nominal scale. The reason for this is that the numbers in a nominal scale are merely symbols or labels used to identify a category of the nominal variable. We could just as easily have labeled Protestant 2 as 1.
Research in Practice 5.1: Behavior and Social Environment: Controversies in Measuring Violence against Women
An extensive body of literature has accumulated regarding the topic of violence against women. In the process of building this knowledge base, considerable disagreement has arisen about which harmful behaviors to include in a definition of nonlethal violence and how best to go about measuring this violence. Consider the two following excerpts, the first from a qualitative study and the second from a summary of a national, randomized survey:
I was raped by my uncle when I was 12 and my husband has beat me for years. For my whole life, when I have gone to a doctor, to my priest, or to a friend to have my wounds patched up, or for a shoulder to cry on, they dwell on my bruises, my cuts, my broken bones. The abuse in my life has taken away my trust in people and in life. It’s taken away the laughter in my life. I don’t trust myself to be able to take care of my kids, to take care of myself, to do anything to make a difference in my own life or anyone else’s. That’s the hurt I would like to fix. I can live with the physical scars.
It’s these emotional scars that drive me near suicide sometimes.
A respondent interviewed by DeKeseredy and MacLeod (1997, p. 5)
Women experience significantly more partner violence than men do: 25 percent of surveyed women, compared with 8 percent of surveyed men, said they were raped and/or physically assaulted by a current or former spouse, cohabiting partner, or date in their lifetime; 1.5 percent of surveyed women and 0.9 percent of surveyed men said they were raped and/or physically assaulted by such a perpetrator in the previous 12 months. According to survey estimates, approximately 1.5 million women and 834,700 men are raped and/or physically assaulted by an intimate partner annually in the United States.
Tjaden and Thoennes (1998, p. 2)
The gut-wrenching words of a violence survivor or the decimal precision of an executive summary: Which approach is the better measure of domestic violence? The qualitative study vividly portrays one person’s experience, an experience with which many victims can identify. The survey lacks the rich description but appears to capture the immensity of the problem in terms of numbers of victims. The two approaches have fueled a debate over what focus to use when we attempt to measure violence against women.
Traditionally, many survey researchers have used operational definitions that include physical abuse indicators, such as beatings or kicks, or sexual assault features, such as forced penetration. For example, the Conflict Tactics Scale asks people to indicate how often a partner has “used a knife or gun on them” or “beat them up” (Straus et al. 1996). An argument in favor of such an approach is that it lends itself to readily quantifiable measures. One can count the number of times a victim was beaten, the number of visits to the emergency room, or the number of workdays lost because of injury. Standardized instruments such as the Conflict Tactics Scale permit researchers to make comparisons across studies and with different populations. So, in the case of the survey quoted above, the researchers can estimate the number of women who were raped or physically assaulted, and the results can be used in conjunction with those of other surveys to estimate the extent of the problem.
Is this really, however, what is most important? The victim who is quoted in the qualitative study makes an eloquent plea to focus on the psychological hurt that she endures forever as a consequence of living with an abusive partner rather than counting the number of assaults or physical injuries that happened. In an article discussing definition and measurement issues, Walter DeKeseredy (2000) points out that many North American surveys have followed a narrow definition, based in part on the argument that grouping physical assault with psychological, spiritual, and economic abuse muddies the water and makes causal determination impossible. Another argument is that to include “soft” abuse, such as verbal aggression and psychological damage, trivializes what most people agree is seriously abusive. In contrast, many researchers, especially those using qualitative methods, contend that violence against women is much more than just physical blows, that it is multidimensional and such actions as harming pets, threatening children, and verbal degradation also are essential elements. The qualitative data presented above can be part of a convincing argument that the psychological damage resulting from abuse is far from trivial.
In fact, when it comes to estimating the amount of violence, DeKeseredy argues that narrow definitions generate low incidence and prevalence rates and that these constitute a significant problem. He points out that policymakers react only to large numbers; thus, underestimating the amount of abuse may have important policy implications. Furthermore, narrow definitions create a ranking of abuse based on what is defined as crime rather than on women’s true feelings. Finally, narrow definitions increase the problem of underreporting, because research participants will only disclose abuse that fits the narrow definition rather than include other experiences that hurt them deeply. Although it may be problematic to include a wide array of abusive experiences, DeKeseredy points out that qualitative research, such as that quoted above, emphasizes the need to incorporate into survey research the features of violence that women find so devastating. As the debate developed, qualitative research served as the catalyst for forcing the research community to broaden its definition of abuse. Several measurement tools, created partly in response to the work of qualitative researchers, now tap nonphysical and nonsexual abuse. These include Tolman’s (1989) Psychological Maltreatment of Women Inventory and the psychologically/emotionally abusive and controlling behaviors data elements developed by the National Center for Injury Prevention and Control, Centers for Disease Control and Prevention (Saltzman et al. 1999).
This debate over how to measure domestic violence shows the benefits of using both qualitative and quantitative research approaches and of considering both positivist and nonpositivist arguments about measurement. DeKeseredy, for example, makes a case for the use of multiple measures to further enhance measurement. He argues that using open-ended, supplemental questions in addition to such quantitative measures as the Conflict Tactics Scale increases the chance that silent or forgetful participants may reveal abuse not reported in the context of the structured, closed-ended instrument. In summary, we see that careful definition of terms, inclusion of both qualitative and quantitative research, improvement of measurement instruments, and use of multiple forms of measurement all advance our understanding of the dynamics of important social issues, such as violence against women.
Ordinal MeasuresWhen variables can be conceptualized as having an inherent order at the theoretical level, we have an ordinal variable and, when operationalized, an ordinal measure. Ordinal measures are of a higher level than nominal measures, because in addition to having mutually exclusive and exhaustive categories, the categories have a fixed order. Socioeconomic status, for example, constitutes an ordinal variable, and measures of socioeconomic status are ordinal scales. Table 5.2 illustrates how we might divide socioeconomic status into ordinal categories. With ordinal measurement, we can speak of a given category as ranking higher or lower than some other category; lower-upper class, for example, is higher than middle class but not as high as upper-upper class. It is important to recognize that ordinal measurement does not assume that the categories are equally spaced. For example, the distance between lower-upper class and upper-upper class is not necessarily the same as between lower-middle class and middle class, even though in both cases the classes are one rank apart. This lack of equal spacing means that the numbers assigned to ordinal categories do not have the numerical properties that are necessary for arithmetic operations. Like nominal scales, we cannot add, subtract, multiply, or divide ordinal scales. The only characteristic they have that nominal scales do not is the fixed order of the categories.
Table 5.2 Ordinal Ranking of Socioeconomic Status
| Category | Ranks |
| Upper-upper | |
| Lower-upper | |
| Upper-middle | |
| Middle | |
| Lower-middle | |
| Upper-lower | |
| Lower-lower |
The next highest level of measurement is interval. Interval measures share the characteristics of ordinal scales—mutually exclusive and exhaustive categories and an inherent order—but have equal spacing between the categories. Equal spacing comes about because some specific unit of measurement, such as a degree on a temperature scale, is a part of the measure. Each of these units has the same value, which results in the equal spacing. We have an interval scale if the difference between scores of, say, 30 and 40 is the same as the difference between scores of, say, 70 and 80. A 10-point difference is a 10-point difference regardless of where on the scale it occurs.
The common temperature scales, Fahrenheit and Celsius, are true interval scales. Both scales have, as units of measurement, degrees and the equal spacing that is characteristic of interval scales. A difference of 10 degrees is always the same, no matter where it occurs on the scale. These temperature scales illustrate another characteristic of true interval scales: The point on the scale labeled zero is arbitrarily selected. Neither 0°C nor 0°F is absolute zero, the complete absence of heat. Because the zero point is arbitrary in true interval scales, we cannot make statements concerning ratios—that is, we cannot say that a given score is twice or three times as high as some other score. For example, a temperature of 80°F is not twice as hot as a temperature of 40°F. Despite not having this ratio characteristic, interval scales have numbers with all the other arithmetic properties. If we have achieved interval-level measurement, then we can legitimately perform all the common arithmetic operations on the numbers.
Considerable controversy exists over which measures used in behavioral science research are true interval measures; only a few measures are clearly of interval level. For example, one that is relevant to the human services is intelligence as measured by IQ tests. The IQ tests have specific units of measurement—points on the IQ scale—and each point on the scale is mutually exclusive. Furthermore, the distance between IQs of 80 and 90 is equivalent to the distance between IQs of 110 and 120. An IQ scale has no absolute zero point, however, so we cannot say that a person with an IQ of 150 is twice as intelligent as a person with an IQ of 75. As with temperature scales, the IQ scale is, in part, an arbitrary construction that allows us to make some comparisons but not others.
Beyond a few measures such as intelligence, however, the debate ensues. Some researchers argue, for example, that we can treat attitude scales as interval scales (Kenny 1986). The questions that make up attitude scales commonly involve choosing one of five responses: strongly agree, agree, uncertain, disagree, or strongly disagree. The argument is that people see the difference between “strongly agree” and “agree” as roughly equivalent to the distance between “disagree” and “strongly disagree.” This perceived equidistance, some argue, makes it possible to treat these scales as interval measures. Other researchers argue that there is no logical or empirical reason to assume that such perceived equidistance exists and, therefore, that we should always consider attitude scales as ordinal rather than interval measures.
We do not presume to settle this debate here. Rather, we raise the issue because level of measurement influences which statistical procedures to use at the data analysis stage of research. (This matter is discussed in Chapters 14 and 15.) The results of research in which the researcher used an inappropriate statistical procedure for a given level of measurement should be viewed with caution.
Ratio MeasuresThe highest level of measurement is ratio. Ratio measures have all the characteristics of interval measures, but the zero point is absolute and meaningful rather than arbitrary. As the name implies, with ratio measures, we can make statements to the effect that some score is a given ratio of another score. For example, one ratio variable with which human service workers are likely to deal with is income. With income, the dollar is the unit of measurement. Also, as many are all too well aware, there is such a thing as no income at all, so the zero point is absolute. Thus, it is perfectly legitimate to make statements such as this about income: An income of $20,000 is twice as much as $10,000 but only one third as much as $60,000. (We recognize, of course, that income is a ratio measure only as an indicator for the amount of money that is available to a person; if income is used as a measure of a person’s social status, for example, then a difference between $110,000 and $120,000 does not necessarily represent a shift in status equivalent to that between $10,000 and $20,000.) Given that ratio scales have all the characteristics of interval scales, we can, of course, perform all arithmetic operations on them.
We summarize the characteristics of the four levels of measurement in Table 5.3. Keep in mind that, even though researchers have no control over the nature of a variable, they do have some control over how they define a variable, at both the nominal and operational levels, and this affects the level of measurement. It sometimes is possible to change the level of measurement of a variable by redefining it at the nominal or the operational level. This is important, because researchers generally strive for the highest possible level of measurement: Higher levels of measurement generally enable us to measure variables more precisely and to use more powerful statistical procedures (see Chapters 14 and 15). It also is desirable to measure at the highest possible level because it gives the researcher the most options: The level of measurement can be reduced during the data analysis, but it cannot be increased. Thus, choosing a level of measurement that is too low introduces a permanent limitation into the data analysis.
Table 5.3 The Characteristics of the Four Levels of Measurement
|
| Characteristics of Categories | |||
| Level of Measurement | Mutually Exclusive and Exhaustive | Possesses a Fixed Order | Equal Spacing between Ranksa | True Zero Pointa,b |
| Nominal |
|
|
| |
| Ordinal |
|
| ||
| Interval |
| |||
| Ratio | ||||
| y = possesses that characteristic | ||||
aPermits standard mathematical operations of addition, subtraction, multiplication, and division.
bPermits statements about proportions and ratios.
The primary determinant for the level of measurement, however, is the nature of the variable we want to measure. The major concern is an accurate measure of a variable (a topic we will discuss at length in the next section). Religious affiliation, for example, is a nominal variable, because that is the nature of the theoretical concept of “religious affiliation.” There is no way to treat religious affiliation as anything other than a merely nominal classification, but by changing the theoretical variable somewhat, we may open up higher levels of measurement. If, instead of religious affiliation, we were to measure religiosity, or the strength of religious beliefs, then we would have a variable that we could conceptualize and measure as ordinal and, perhaps, even as interval. On the basis of certain responses, we could easily rank people into ordered categories of greater or lesser religiosity. Thus, the theoretical nature of the variable plays a large part in determining the level of measurement. This illustrates, once again, the constant interplay between theoretical and research levels (see Figure 5.1). The decision regarding level of measurement at the research level might affect the conceptualization of variables at the theoretical level.
Finally, note that nominal variables are not inherently undesirable. The impression that variables capable of measurement at higher levels are always better than nominal variables is wrong. The first consideration is to select variables on theoretical grounds, not on the basis of their possible level of measurement. Thus, if a research study really is concerned with religious affiliation and not with religiosity, then the nominal measure is the correct one to use and not a measure of religiosity (even though it is ordinal or, possibly, interval). Also, researchers do strive for more accurate and powerful measurement. Other things being equal, a researcher who has two measures available, one ordinal and one interval, generally prefers the interval measure.
Discrete versus Continuous VariablesIn addition to considering the level of measurement of a variable, researchers also distinguish between variables that are discrete or continuous. Discrete variables have a finite number of distinct and separate values. A perusal of a typical client fact sheet from a human service agency reveals many examples of discrete variables, such as sex, household size, number of days absent, or number of arrests. Household size is a discrete variable because households can be measured only in a discrete set of units, such as having one member, two members, and so on; no meaningful measurement values lie between these distinct and separate values. Continuous variables, at least theoretically, can take on an infinite number of values. Age is a continuous variable because we can measure age by an infinite array of values. We normally measure age in terms of years, but theoretically, we could measure it in terms of months, weeks, days, minutes, seconds, or even nanoseconds! There is no theoretical limit to how precise the measurement of age might be. For most social science purposes, the measurement of age in terms of years is quite satisfactory, but age is nonetheless a continuous variable.
Nominal variables are, by definition, discrete in that they consist of mutually exclusive or discrete categories. Ordinal variables also are discrete. The mutually exclusive categories of an ordinal variable may be ranked from low to high, but there cannot be a partial rank. For example, in a study of the military, rank might be ordered as 1 = private, 2 = corporal, and so on, but it would be nonsensical to speak of a rank of 1.3. In some cases, interval and ratio variables are discrete. For example, family size or number of arrests are whole numbers or discrete intervals. (We can summarize discrete interval and ratio data by saying, for example, that the average family size is 1.8 people, but this is a summary statistic, not a measurement of a particular household.) Many variables at the interval and ratio level are continuous, at least at the theoretical level. A researcher may settle for discrete indicators either because the study does not demand greater precision or because no tools exist that can measure the continuous variable with sufficient reliability. In some cases, researchers debate over whether a particular variable is discrete or continuous in nature. For example, we used social class as an illustration of an ordinal variable, suggesting that several distinct classes exist. Some argue that social class is inherently a continuous interval variable and that we only treat it as ordinal because of the lack of instruments that would permit researchers to measure it reliably as a true continuous, interval variable (Borgatta and Bohrnstedt 1981).
A variable, then, is continuous or discrete by its very nature, and the researcher cannot change that. It is possible to measure a continuous variable by specifying a number of discrete categories, as we typically do with age, but this does not change the nature of the variable itself. Whether variables are discrete or continuous may influence how we use them in data analysis. Knowing the level of measurement and whether variables are discrete or continuous has implications for selecting the best procedures for analyzing the data.
Evaluating MeasuresWe have seen that there normally are a number of indicators, sometimes a large number and at different levels of measurement, that we can use to measure a variable, but how do we choose the best of these measures for a particular study? A number of factors come into play in making this decision, including matters of feasibility (discussed in Chapter 4). Here, we want to discuss two additional and very important considerations in this regard—that is, the validity and reliability of measures (Alwin 2007).
ValidityValidity refers to the accuracy of a measure: Does it accurately measure the variable it is intended to measure? If we were developing a measure of self-concept, a major concern would be whether our measuring device measures the concept as it is theoretically defined. There must be a fairly clear and logical relationship between the way that a variable is nominally defined and the way that it is operationalized. For example, if we propose to measure self-concept on the basis of how stylishly people dress, then we probably would have an invalid measure. Many factors influence the way that people dress at any given time. The slight possibility that one of these factors might have something to do with self-concept is not sufficient to make the suggested measure valid. The validity of measures is very difficult to demonstrate with any finality. Several approaches to the question of validity exist, however, and they can offer evidence regarding the validity of a measure.
Face validity involves assessing whether a logical relationship exists between the variable and the proposed measure. It essentially amounts to a rather commonsense comparison of what makes up the measure and the theoretical definition of the variable: Does it seem logical to use this measure to reflect that variable? We might measure child abuse in terms of the reports that physicians or emergency room personnel make concerning injuries suffered by children. This is not a perfect measure, because health personnel might be wrong. It does, however, seem logical that an injury such people report might reflect actual abuse.
No matter how carefully done, face validity clearly is subjective in nature. All we have is logic and common sense as arguments for the validity of a measure. This makes face validity the weakest demonstration of validity, and it usually should be considered as no more than a starting point. All measures must pass the test of face validity. If they do, then we should attempt one of the more stringent methods for assessing validity.
An extension of face validity is called content validity, or sampling validity, which has to do with whether a measuring device covers the full range of meanings or forms that are included in a variable to measure. In other words, a valid measuring device provides an adequate, or representative, sample of all content, or elements, or instances, of the phenomenon being measured. For example, if one were measuring general self-esteem, it would be important to recognize that self-esteem can relate to many realms of people’s lives, such as work, school, or the family. Self-esteem might get expressed or come into play in all those settings. A valid measure of self-esteem, then, would take that variability into account. If a measure of self-esteem consisted of a series of statements to which people expressed degrees of agreement, then a valid measure would include statements that relate to those many settings in which self-esteem might be expressed. If all the statements in the measuring device had to do, say, with school, then it would be a less-valid measure of general self-esteem.
Content validity is a more extensive assessment of validity than is face validity, because it involves a detailed analysis of the breadth of the measured concept and its relationship to the measuring device. Content validity involves two distinct steps: (1) determining the full range or domain of the content of a variable and (2) determining whether all those domains are represented among the items that constitute the measuring device. It is still a somewhat subjective assessment, however, in that someone has to judge what the full domain of the variable is and whether a particular aspect of a concept is adequately represented in the measuring device. There are no agreed-on criteria that determine whether a measure has content validity. Ultimately, it is a judgment, albeit a more carefully considered judgment than occurs with face validity.
One way to strengthen confidence in face or content validity is to gather the opinions of other investigators, especially those who are knowledgeable about the variables involved, regarding whether particular operational definitions are logical measures of the variables. This extension of face or content validity, which sometimes is referred to as jury opinion, is still subjective, of course. Because more people serve as a check on bias or misinterpretation, however, jury opinion is superior to individual tests of face or content validity.
Criterion validity establishes validity by showing a correlation between a measurement device and some other criterion or standard that we know or believe accurately measures the variable under consideration. Or, we might correlate the results of the measuring device with some properties or characteristics of the variable that the measuring device is intended to measure. For example, a scale intended to measure risk of suicide, if it is to be considered valid, should correlate with the occurrence of self-destructive behavior. The key to criterion validity is to find a criterion variable against which to compare the results of the measuring device.
Criterion validity moves away from the subjective assessments of face validity and provides more objective evidence of validity. One type of criterion validity is concurrent validity, which compares the instrument under evaluation to some already-existing criterion, such as the results of another measuring device. (Presumably, any other measuring devices in this assessment have already been tested for validity.) Lawrence Shulman (1978), for example, used a form of concurrent validity to test an instrument intended to measure the practice skills of human service practitioners. This instrument consisted of a questionnaire in which clients rated the skills of practitioners. Shulman reasoned that clients would view more skilled practitioners as more helpful and that those practitioners would have more satisfied clients. Thus, Shulman looked for correlations between how positively clients rated a practitioner’s skills and the perceived helpfulness of practitioners or satisfaction of clients. These correlations offered evidence for the validity of the measure of practitioners’ skills.
Numerous existing measures can help establish the concurrent validity of a newly developed measure. (Following are only some of the compilations of such measures available in the social sciences and the human services: Bloom, Fischer, and Orme 2009; Corcoran and Fischer 2000; Fredman and Sherman 1987; Magura and Moses 1986; McDowell and Newell 1996; Miller and Salkind 2002; Robinson, Shaver, and Wrightsman 1991; Schutte and Malouff 1995; Touliatos et al. 2000.) More measures can be found in research articles in professional journals. In addition, the Consulting Psychologists Press and other organizations publish catalogs of measures they make available to assess a wide array of skills, behaviors, attitudes, and other variables. (This also suggests, as pointed out in Chapter 4, that a thorough review of the literature, undertaken before going through all the work of creating a new measure, may unearth an existing measure that meets one’s needs and has already been demonstrated to have adequate validity and reliability.) Then, it is a matter of applying both measures to the same sample and comparing the results. If a substantial correlation is found between the measures, we have reason to believe that our measure has concurrent validity. As a matter of convention, a correlation of r = .50 is considered to be the minimum required for establishing concurrent validity.
The inherent weakness of concurrent validity is the validity of the existing measure that is used for comparison. All we can conclude is that our measure is about as valid as the other one. If the measure that we select for comparison is not valid, then the fact that ours correlates with it hardly makes our measure valid. For this reason, researchers should use only those measures that have been established as being valid by research for comparison purposes in concurrent validity.
A second form of criterion validity is predictive validity, in which an instrument predicts some future state of affairs. In this case, the criteria that are used to assess the instrument are certain future events. The Scholastic Assessment Test (SAT), for example, can be subjected to predictive validity by comparing performance on the test with how people perform in college. If people who score high on the SAT do better in college than those who score low, then the SAT is, presumably, a valid measure of scholastic ability. Some measures are created for the specific purpose of predicting a given behavior, and these measures are obvious candidates for assessment by predictive validity. For example, researchers have attempted to develop a measure that can predict which convicted criminals are likely to revert to high involvement with crime after being released from prison (Chaiken and Chaiken 1984). Information about the number and types of crimes that people commit, the age at which they commit their first crime, and involvement with hard drugs serves as the basis for these predictions. Ultimately, a measure’s ability to make accurate predictions about who actually experiences high involvement with crime after release validates that measure.
Because this may require numerous applications and many years, the scales can be assessed initially for validity on the basis of their ability to differentiate between high and low crime involvement among current criminals. We expect that if a measure can make this differentiation, it also can predict future involvement in crime. This variation on predictive validity is the known groups approach to validity. If we know that certain groups are likely to differ substantially on a given variable, then we can use a measure’s ability to discriminate between these groups as an indicator of validity. Suppose, for example, we were working on a measure of prejudice. We might apply the measure to a group of ministers, whom we would expect to be low in prejudice, and to a group of people affiliated with the group Aryan Nation, whom we would expect to be high in prejudice. If these groups differed significantly in how they responded to the measurement instrument, then we would have reason to believe that the measure is valid. If the measure failed to show a substantial difference, we would certainly have doubt about its validity.
Despite the apparent potential of the known groups approach, it does have its limitations. Frequently, no groups are known to differ on the variable that we are attempting to measure. In fact, the purpose of developing a measure often is to allow the identification of groups who do differ on some variable. Thus, we cannot always use the known groups technique. When we do, we also have to consider a further limitation—namely, that it cannot tell us whether a measure can make finer distinctions between less-extreme groups than those used in the validation. Perhaps the measure of prejudice just described shows the members of Aryan Nation to be high in prejudice and the ministers to be low. With a broader sample, however, the measure may show that only the Aryan Nation members score high and that everyone else, not just ministers, scores low. Thus, the measure can distinguish between groups only in a very crude fashion.
Construct validity, the most complex of the types of validity that we discuss here, involves relating an instrument to an overall theoretical framework to determine whether the instrument is correlated with all the concepts and propositions that comprise the theory (Cronbach and Meehl 1955). In this case, instruments are assessed in terms of how they relate not to one criterion but, rather, to the numerous criteria that can be derived from some theory. For example, if we develop a new measure of socioeconomic status, we can assess construct validity by showing that the new measure accurately predicts the many hypotheses that can be derived from a theory of occupational attainment. In the theory, numerous propositions would relate occupational attainment and socioeconomic status to a variety of other concepts. If we do not find some or all of the predicted relationships, then we may question the validity of the new measuring instrument. (Of course, it may be that the theory itself is flawed; this possibility must always be considered when assessing construct validity.)
Construct validity takes some very complex forms. One is the multitrait—multimethod approach (Campbell and Fiske 1959). This is based on two ideas: First, two instruments that are valid measures of the same concept should correlate rather highly with each other even though they are different instruments. Second, two instruments, even if similar to each other, should not correlate highly if they measure different concepts. This approach to validity involves the simultaneous assessment of numerous instruments (multimethod) and numerous concepts (multitrait) through the computation of intercorrelations. Wolfe and colleagues (1987) used this technique to assess the validity of children’s self-reports about negative emotions, such as aggressiveness and depression. The point is that assessing construct validity can become highly complex, but this complexity offers greater evidence for the validity of the measures.
Eye on Ethics: The Ethics of Measuring Shameful, Harmful, or Deviant Behavior
How do you validly measure people’s willingness to engage in shameful, even harmful behavior in an experiment and remain ethical? For many, Stanley Milgram’s classic study on obedience to authority (Milgram 1974) exemplifies exposing participants to unacceptable harm in the conduct of research. Milgram set up a teaching laboratory where participants were told that the study concerned the effects of punishment on learning. Each participant was led to believe that he had been assigned the role of teacher who would administer electrical shocks to a “learner” in order to enhance learning. There was an imposing-looking shock generator machine, complete with red warning danger labels and appearing to administer electrical shocks up to 450 volts in 15-volt increments. Milgram measured how far up the scale participants would go in administering shocks as the “learner” on the other side of the wall expressed more distress with the increase in voltage, finally falling silent as if severely injured. The disturbing result was that 65 percent of participants continued administering shocks all the way to the maximum 450 volts.
Milgram’s last studies were conducted about the time that the U. S. Department of Health, Education, and Welfare was establishing its ethical guidelines and mandating Institutional Review Boards (see Chapter 3). Given the furor over perceived risk of psychological harm raised by Milgram’s work, it seemed unlikely that anyone would ever gain approval for similar studies from a modern IRB. But the question Milgram examined is still of vital interest today. The Holocaust and Abu Ghraib cause us to continue asking how people can engage in inhumane behavior.
Recently, psychologist Jerry Burger sufficiently addressed ethical concerns that he was able to secure IRB approval and thus conduct a modern replication of Milgram’s research. Burger resolved the ethical issues by modifying the dependent variable measurement through what he calls the “150 Volt Solution” (Burger 2009, p.2). Previous studies showed that about 79 percent of participants who were willing to administer shocks of 150 volts continued on through the full range to 450 volts. Burger argued that little additional data was gained by subjecting participants to demands to administer higher and higher levels of shock. He argued that the 150-volt limit was a valid measure of people’s willingness to engage in behavior that was very harmful to other people, but that it was ethical because it did not subject people to the great stress of thinking they were administering very large shocks. The researcher included other safeguards in order to gain IRB approval: a screening process for applicants, multiple reminders that they could withdraw their participation, immediate debriefing, and presence of a clinical psychologist who was instructed to end the session immediately at the sign of participant distress. So what did the study show? As with Milgram, most of Burger’s participants complied with the authority figure’s instructions and delivered the maximum shock.
The types of validity we have discussed so far—face, content, criterion, and construct—involve a progression in which each builds on the previous one. Each type requires more information than the prior ones but provides a better assessment of validity. Unfortunately, many studies limit their assessment to content validity, with its heavy reliance on the subjective judgments of individuals or juries. Although this sometimes is necessary, measures subjected only to content validity should be used with caution. The Eye on Ethics section discusses some ethical considerations that can arise in trying to develop valid measures of some behaviors.
ReliabilityIn addition to validity, measures also are evaluated in terms of their reliability, which refers to a measure’s ability to yield consistent results each time it is applied. In other words, reliable measures only fluctuate because of variations in the variable being measured. An illustration of reliability can be found at any carnival, where there usually is a booth with a person guessing people’s weights within a certain range of accuracy—say, plus or minus three pounds. The customer essentially bets that the carnie’s ability to guess weights is sufficiently unreliable that his or her estimate will fall outside the prescribed range, and if so, the customer will win a prize. A weight scale, of course, is a reliable indicator of a person’s weight because it records roughly the same weight each time the same person stands on it, and the carnie provides such a scale to assess his or her guess of the customer’s weight. Despite the fact that carnies who operate such booths become quite good at guessing weights, they do occasionally guess wrong—influenced, perhaps, by aspects of the customer other than his or her actual weight, such as loose clothing that obscures a person’s physique.
In general, a valid measure is reliable. So, if we were certain of the validity of a measure, then we would not need to concern ourselves with its reliability. Evidence of validity, however, is always less than perfect, and this is why we turn to other ways of evaluating measures, including reliability. Reliability gives us more evidence for validity, because a reliable measure may be valid. Fortunately, we can demonstrate reliability in a more straightforward manner than we can demonstrate validity. Many specific techniques exist for estimating the reliability of a measure, but all are based on one of two principles—namely, stability and equivalence. Stability is the idea that a reliable measure should not change from one application to the next, assuming that the concept being measured has not changed. Equivalence is the idea that all items that make up a measuring instrument should measure the same thing and, thus, be consistent with one another. The first technique for estimating reliability, test—retest reliability, uses the stability approach; the others discussed use the equivalence principle.
Test—RetestThe first and most generally applicable assessment of reliability is called test—retest. As the name implies, this technique involves applying a measure to a sample of people and then, somewhat later, applying the same measure to the same people again. After the retest, we have two scores on the same measure for each person, as illustrated in Table 5.4. We then correlate these two sets of scores with an appropriate statistical measure of association (see Chapter 15). Because the association in test—retest reliability involves scores obtained from two identical questionnaires, we fully expect a high degree of association. As a matter of convention, a correlation coefficient of .80 or better normally is necessary for a measure to be considered as reliable. In Table 5.4, the r means that the particular statistic used was the Pearson’s correlation coefficient, and the value of .98 indicates that the measurement instrument is highly reliable according to the test—retest method.
Table 5.4 Hypothetical Test-Retest Data
| Subjects | Initial Test | Retest |
| 12 | 15 | |
| 15 | 20 | |
| 22 | 30 | |
| 38 | 35 | |
| 40 | 35 | |
| 40 | 38 | |
| 40 | 41 | |
| 60 | 55 | |
| 70 | 65 | |
| 10 | 75 | 77 |
| r = .98 | ||
Lawrence Shulman (1978), in addition to subjecting his measure of practice skills to the tests of validity mentioned earlier, also tested its reliability. He did so by sending versions of the questionnaire to a set of clients and then sending an identical questionnaire two weeks later to the same clients. This provided him with a test—retest assessment of reliability, and he obtained a correlation coefficient of .75. When a reliability coefficient is close to the conventional level, such as in this case, then the researcher must make a judgment about whether to assume that the instrument is reliable (and the low coefficient is a result of factors other than the unreliability of the instrument) or to rework the instrument to obtain higher levels of association.
In actual practice, we cannot simply use the test—retest method as suggested, because exposing people to the same measure twice creates a problem known as multiple-testing effects (Campbell and Stanley 1963). Whenever we apply a measure to a group of people a second time, they may not react to it the same as they did the first time. They may, for example, recall their previous answers, and that could influence their second response. People might respond as they recall doing the first time to maintain consistency, or people might purposely change responses for the sake of variety. Either case can have a confounding effect on testing reliability. If people strive for consistency, then their efforts can mask actual unreliability in the instrument. If they deliberately change responses, then a reliable measure can appear to be less reliable.
A solution to this dilemma is to divide the test group randomly into two groups: an experimental group to test twice, and a control group to test only once. Table 5.5 illustrates the design for such an experiment. Ideally, the measure will yield consistent results in all three testing sessions; if it does, then we have solid reason to believe the measure is reliable. On the contrary, substantial differences among the groups may indicate unreliability. If, for example, the experimental group shows consistency in both sets of responses to the measurement instrument but the control group differs, then the measure may be unreliable and the consistency of the experimental group might result from the multiple-testing effects. On the contrary, if the experimental group yields inconsistent results but the control group shows responses similar to those of the experimental group’s initial test, this outcome also may be caused by multiple-testing effects and result from the experimental group’s changing answers during the retest. Despite the inconsistency in the experimental group, the measure still might be reliable if we observe this outcome. Finally, we may see that the results of all three testing sessions appear to be inconsistent. Such an outcome would suggest that the measure is not reliable. If either of the outcomes that leave the reliability of the measure in doubt occurs, researchers should conduct a second test—retest experiment with the hope of obtaining clearer results. If the same result occurs, then we should redesign the instrument.
Table 5.5 Design for Test-Retest
|
| Initial Test | Retest |
| Experimental group | Yes | Yes |
| Control group | No | Yes |
The test—retest method of assessing reliability has both advantages and disadvantages. Its major advantage is that we can use it with many measures, which is not true of alternative tests of reliability. Its disadvantage is that it is slow and cumbersome to use, with two required testing sessions and the desirability of a control group. In addition, as we have seen, the outcome may not be clear, leading to the necessity of repeating the whole procedure. Finally, we cannot use the test—retest method on measures of variables whose value might have changed during the interval between tests. For example, people’s attitudes can change for reasons that have nothing to do with the testing, and a measure of attitudes might appear to be unreliable when it is not.
Multiple FormsIf our measuring device is a multiple-item scale, as often is the case, we can approach the question of reliability through the technique of multiple forms. When developing the scale, we create two separate but equivalent versions made up of different items, such as different questions. We then administer these two forms successively to the same people during a single testing session. We correlate the results from the forms, as in test—retest, using an appropriate statistical measure of association, with the same convention of r = .80 or better required for establishing reliability. If the correlation between the two forms is sufficiently high, then we can assume that each scale is reliable.
Multiple forms have the advantages of requiring only one testing session and of needing no control group. These may be significant advantages if using either multiple-testing sessions or a control group is impractical. In addition, we need not worry about changes in a variable over time, because both forms are administered at the same time.
The multiple-forms technique relies on the two forms appearing to the respondents as though they were only one, long measure so that the respondents do not realize they are really taking the same test twice. This necessity of deluding people points out one of the disadvantages of multiple forms: To maintain the equivalence of the forms, the items in the two forms probably will be quite similar—so similar, in fact, that people may realize they are responding to essentially the same items twice. If this occurs, it raises the specter of multiple-testing effects and casts doubt on the accuracy of the reliability test. Another disadvantage of multiple forms is the difficulty of developing two measures with different items that really are equivalent. If we obtain inconsistent results from the two forms, it may be caused by differences in the forms rather than by the unreliability of either one. In a way, it is questionable whether multiple forms really test reliability and not just our ability to create equivalent versions of the same measure.
Internal Consistency ApproachesInternal consistency approaches to reliability use a single scale that is administered to one group of people to develop an estimate of reliability. For example, in the split-half approach to reliability, the test group responds to the complete measuring instrument. We then randomly divide the responses to the instrument into halves, treating each half as though it were a separate scale. We correlate the two halves by using an appropriate measure of association. Once again, we need a coefficient of r = .80 or better to demonstrate reliability. In his study of practice skills mentioned earlier, Shulman (1978) used a split-half reliability test on his instrument in addition to the test—retest method. He divided each respondent’s answers to his questions about practitioners’ skills into two roughly equivalent sets, correlated the two sets of answers, and found a correlation (following a correction, to be mentioned shortly) of .79. This is an improvement over the reliability that he found with the test—retest method, and it comes very close to the conventional level of .80.
One complication in using the split-half reliability test is that the correlation coefficient may understate the reliability of the measure because, other things being equal, a longer measuring scale is more reliable than a shorter one. Because the split-half approach divides the scale in two, each half is shorter than the whole scale and, thus, will appear to be less reliable than the scale as a whole. To correct for this, we can adjust the correlation coefficient by applying the Spearman—Brown formula, which Shulman did:
![]()
Where:
ri = uncorrected correlation coefficient
r = corrected correlation coefficient (reliability coefficient)
To illustrate the effect of the Spearman—Brown formula, suppose we have a 20-item scale with a correlation between the two halves of ri = .70, which is smaller than the minimum needed to demonstrate reliability. The Spearman—Brown formula corrects as follows:
![]()
It can be seen that the Spearman—Brown formula has a substantial effect, increasing the uncorrected coefficient from well below .80 to just over it. If we had obtained these results with an actual scale, we would conclude that its reliability was now adequate.
Using the split-half technique requires two preconditions that can limit its applicability. First, all the items in the scale must measure the same variable. If the scale in question is a jumble of items measuring several different variables, then it is meaningless to divide it and compare the halves. Second, the scale must contain a sufficient number of items so that, when it is divided, the halves do not become too short to be considered as scales themselves. A suggested minimum is 8 to 10 items per half (Goode and Hatt 1952, p. 236). Because many measures are shorter than these minimums, however, it may not be possible to assess their reliability with the split-half technique.
A number of other approaches to internal consistency reliability sometimes are used to overcome the weaknesses of the split-half approach. After all, the split-half approach only uses one random separation of the scale into two halves. Randomly dividing the items of a scale into halves could result in many different arrangements of items, and each would yield a slightly different correlation between the halves. One common approach to this problem is to use Cronbach’s alpha, which may be thought of as the average of all possible split-half correlations. Theoretically, the scale is divided into all possible configurations of two halves. Then, a correlation is computed for each possibility, and the average of those correlations is computed to derive alpha (Cronbach 1951). This is not actually how Cronbach’s alpha is calculated, but it does describe the logic of the procedure. Another approach to internal consistency reliability is to correlate each item in the scale with every other item and then use the average of these correlations as the measure of reliability. This also is done by correlating each item with the overall scale score. (Statistical packages such as SPSS contain procedures that will produce Cronbach’s alpha as well as other reliability tests based on inter-item correlations.)
Internal consistency reliability tests have several advantages. They require only one testing session and no control group. They also give the clearest indication of reliability. For these reasons, researchers prefer to use these methods of assessing reliability whenever possible. The only disadvantage, as we noted, is that we cannot always use them. Shulman’s approach teaches a lesson, however: Use more than one test, if possible, to assess both reliability and validity. These issues are sufficiently important that the expenditure of time is justified.
Measurement with Minority PopulationsResearchers often first assess the validity and reliability of measuring instruments by applying them to white, non-Hispanic respondents, because they find such people to be the most accessible. We should almost never assume, however, that such assessments can be generalized to minority populations (Becerra and Zambrana 1985; Tran and Williams 1994). The development of such instruments typically does not consider the unique cultural characteristics and attitudes of minorities. For some minorities, such as Asians and Hispanics, language differences mean that an English-language interview would have some respondents answering in a second language. Researchers cannot assume that such a respondent will understand words and phrases as well as—or in the same way as—a person for whom English is his or her first language. In addition, some concepts in English do not have a precise equivalent in another language.
It is important, therefore, to refine measuring instruments to assure that they are valid and reliable measures among minorities. A study of mental health among Native Americans, for example, had to drop the word “blue” as a descriptor of depression, because that word had no equivalent meaning among the Native Americans (Manson 1986). Researchers also had to add a category of “traditional healer” to a list of professionals to whom a Native American might turn for help. A study of Eskimos found that cultural context often caused different interpretations of questions. Because Eskimo culture emphasizes tolerance and endurance, Eskimos are less likely than Anglo-Americans to give in to pain by not working. A positive response from an Eskimo to a question like “Does sickness often keep you from doing your work?” is thus considered to be a much more potent indicator of distress than the same answer by an Anglo-American.
These illustrations should make clear that measurement in social research must be culturally sensitive. When conducting research on a group with a culture different from that of the researchers, the researchers can take a number of steps to produce more valid and reliable measurement instruments (Marin and VanOss Marin 1991; Tran and Williams 1994):
Researchers can immerse themselves in the culture of the group under study, experiencing the daily activities of life and the cultural products as the natives do.
Researchers should use key informants, people who participate routinely in the culture of the group under study, to help develop and assess the measurement instruments.
When translating an instrument from English into another language, researchers should use the most effective translation methods, usually double translation (translate from English into the target language and then back into English by an independent person), to check for errors or inconsistencies.
After developing or translating measurement instruments for use with minority populations, researchers should test the instruments for validity and reliability on the population they intend to study.
The range of precision in measurement is quite broad—from the cook who measures in terms of pinches, dashes, and smidgens to the physicist who measures in angstroms (0.003937 millionths of an inch). No matter whether a measurement is crude or precise, it is important to recognize that all measurement involves some component of error (Alwin 2007). There is no such thing as an exact measurement. Some measurement devices in the social sciences are fairly precise. Others, however, contain substantial error components, because most of our measures deal with abstract and shifting phenomena, such as attitudes, values, or opinions, which are difficult to measure with a high degree of precision. The large error component in many of our measurements means that researchers must pay close attention to the different types and sources of error. In measurement, researchers confront two basic types of error: random and systematic. In fact, we can modify the formula from the measurement theory introduced earlier in this chapter with the recognition that the error term in that formula, E, is actually made up of two components:
E = R + S
where R refers to random error and S refers to systematic error. Now, our measurement formula looks like this:
X = T + R + S
Our measurement or observation of a phenomenon is a function of the true nature of that phenomenon along with any random and systematic error that occurs in the measurement process.
Random ErrorsRandom errors are those that are neither consistent nor patterned; the error is as likely to be in one direction as in another. Essentially, random errors are chance errors that, in the long run, tend to cancel themselves out. In fact, in measurement theory, mathematicians often assume that R = 0 in the long run. For example, a respondent may misread or mismark an item on a questionnaire; a counselor may misunderstand and, thus, record incorrectly something said during an interview; a computer operator may enter incorrect data into a computerized data file. All these are random sources of error and can occur at virtually every point in a research project. Cognizant of the numerous sources of random error, researchers take steps to minimize them. Careful wording of questions, convenient response formats, and “cleaning” of computerized data all keep random error down. Despite researchers’ best efforts, however, the final data may contain some component of random error.
Because of their unpatterned nature, random errors are assumed to tend to cancel each other out. For example, the careless computer operator mentioned earlier would be just as likely to enter a score that was lower than the actual one as to enter a score that was higher. The net effect is that the random errors at least partly offset each other. The major problem with random error is that it weakens the precision with which a researcher can measure variables, thus reducing the ability to detect a relationship between variables when one is, in fact, present. For example, consider a hypothetical study concerning the relationship between empathy on the part of human service workers and client satisfaction with treatment. Assume that higher levels of client satisfaction actually are associated with higher levels of empathy. For such a study, measurements would be taken of the level of empathy that a worker expressed and of client satisfaction. Suppose we monitor five client interviews by each of five workers—a total sample of 25 cases—for level of worker empathy and client satisfaction. To the extent that random error is present in our measures, some interviews will be scored too high and some too low, even though the overall mean empathy and satisfaction scores can be expected to be quite close to the true averages. In terms of individual cases, however, random measurement will produce some empathy scores that are erroneously low for their associated satisfaction scores. Conversely, random error will produce some empathy scores that are high for their associated satisfaction scores. Thus, the random error tends to mask the true correlation between empathy and satisfaction. Despite the fact that worker empathy and client satisfaction really are correlated, too much of this type of random measurement error may result in the conclusion that the relationship between these variables does not exist.
Fortunately, researchers can combat random error with a variety of strategies. One is to increase the sample size. Instead of using five workers and five interviews per worker, the researcher might use 10 workers and 10 interviews per worker, for a total sample of 100. A second strategy is to increase the “dose,” or “contrast,” between levels of the independent variable. For example, researchers might select workers for the study according to their empathy skills to assure some cases with low expression of empathy and some with high expression. Finally, the researcher might increase the number of items on the measurement scales or, in other ways, more precisely refine the tools. Such strategies can reduce the impact of random error, but the same is not true for systematic error.
Systematic ErrorsSystematic error is consistent and patterned. Unlike random errors, systematic errors may not cancel themselves out. If there is a consistent over- or understatement of the value of a given variable, then the errors will accumulate. For example, we know that systematic error occurs when measuring crime using official police reports; the Uniform Crime Reports (UCR) of the Federal Bureau of Investigation (FBI) count only crimes that are reported to the police. The Department of Justice supplements these statistics with the National Crime Victimization Survey (NCVS), which measures the number of people who claim to be the victims of crime. Comparisons of these two measures consistently reveal a substantial amount of hidden crime—that is, crimes that are reported by victims but never brought to the attention of the police. For example, NCVS data indicate that only 40 percent of all violent and property crimes are reported to the police (Rand 2008). So, there is a large systematic error when measuring the amount of crime the way the UCR does because of the underreporting of most crimes (see Research in Practice 8.2 for a more detailed discussion of this issue).
Systematic errors are more troublesome to researchers than random errors, because they are more likely to lead to false conclusions. For example, official juvenile delinquency statistics consistently show higher rates of delinquency among children of families with lower socioeconomic status. Self-report studies of involvement with delinquency suggest, however, that the official data systematically overstate the relationship between delinquency and socioeconomic status (Binder, Geis, and Bruce 1988). It is easy to see how the systematic error in delinquency data could lead to erroneous conclusions regarding possible causes of delinquency as well as to inappropriate prevention or treatment strategies.
In Research in Practice 5.2, we suggest ways that concern about measurement—problems of reliability, validity, and error—have direct parallels in practice intervention.
Improving Validity and ReliabilityWhen a measurement device does not achieve acceptable levels of validity and reliability—that is, when much error occurs—researchers often attempt to redesign the device so that it is more valid and reliable. We will discuss how to develop valid and reliable measuring devices at length in other chapters, when we discuss how to design good measurement tools. Here, however, we mention a few techniques as a preview of what happens when a measurement device does not yield adequate validity and reliability:
More extensive conceptual development. Often, validity and reliability are compromised because the researcher is not sufficiently clear and precise about the nature of the concepts being measured and their possible indicators. Rethinking the concepts often helps in revising the measuring instrument to make it more valid.
Better training of those who will apply the measuring devices. This is especially useful when a measuring device is based on someone’s subjective assessment of an attitude or state. Researchers show the people applying the device how their judgments can be biased or produce error and how they can guard against it in their assessments.
Interview the subjects of the research about the measurement devices. Those under study may have some insight regarding why the verbal reports, observations, or archival reports are not producing accurate measures of their behavior. They may, for example, comment that the wording of questions is ambiguous or that members of their subculture interpret some words differently than the researcher intended.
Higher level of measurement. This does not guarantee greater validity and reliability, but a higher level of measurement can produce a more reliable measuring device in some cases. So, when the researcher has some options in terms of how to measure a variable, it is worth considering a higher level of measurement.
Use more indicators of a variable. This also does not guarantee enhanced reliability and validity, but a multiple-item measuring device can, in some cases, produce a more valid measure than a measuring device with fewer items can.
Conduct an item-by-item assessment of multiple-item measures. If the measuring device consists of a number of questions or items, perhaps only one or a few items are the problem: These are the invalid ones that are reducing the validity and reliability of the instrument, and deleting them may improve validity and reliability.
After revising a measuring device based on these ideas, researchers must, of course, subject the revised version to tests of validity and reliability.
Choosing a Measurement DeviceWe have seen that we can use a number of indicators, sometimes a large number and at different levels of measurement, to measure a variable. How do we choose the best of these measures to use in a particular study? If we are developing a new measuring device, how do we decide whether it is good or not? It is a complicated and sometimes difficult decision for researchers, but a number of factors, discussed in this or in earlier chapters, can serve as guidelines for making this decision:
Choose indicators that measure the variables in ways that are theoretically important in the research, as discussed in Chapter 2.
Choose indicators based on their proven validity and reliability.
If two measuring instruments are equivalent in all other ways except for level of measurement, choose the indicator at the higher level of measurement.
Choose indicators that produce the least amount of systematic and random error.
Choose indicators with matters of feasibility, as discussed in Chapter 4, in mind.
Research in Practice 5.2: Assessment of Client Functioning: Goal Attainment Scaling for Practice-Based Evidence
In Chapter 1, we introduced the concept of evidence-based practice, the proponents of which argue that human service practice should be based on the best possible evidence of practice effectiveness. By “best evidence,” proponents generally mean the results of a randomized, experimental research design, in which the researcher carefully structures all aspects of the study design to measure the effect of the intervention (see Chapter 10). Critics, however, point out that the world of experimental research, with all its scientific control, is quite different from everyday practice and that, in addition to demonstrating that an intervention can work under ideal conditions in a scientific study, it is important to show what works in the world of actual practice. So, as a compliment to evidence-based practice, there is a call for practice-based evidence—that is, measuring actual practice and using that data to demonstrate the robustness of an intervention. The challenge to practitioners is to find a measurement strategy that can document effectiveness under real-world practice conditions. One such measurement approach, initially developed by mental health practitioners and since adapted into many other fields, is known as goal attainment scaling, or GAS (Smith 1994).
With GAS, the practitioner measures progress toward achieving individualized goals of a human service client using a five-point continuum for anticipated outcome levels. Typically, three or more specific goals are identified for each participant, as illustrated in Figure 5.3. Each goal must be operationalized in observable terms, and a range of outcomes is listed, where (0) represents the most likely or expected outcome of intervention; (-1) and (+1) represent a somewhat less than expected and somewhat more than expected outcome, respectively; and (-2) and (+2) signify a much less than expected and much more than expected outcome, respectively. These values are uniquely defined for each participant, usually by the practitioner.
Figure 5.3 Sample Goal Attainment Scale in Medical Care Facility Patient Showing Goals, Goal Weights, and Attained Scores (adapted from an undergraduate student’s assignment)
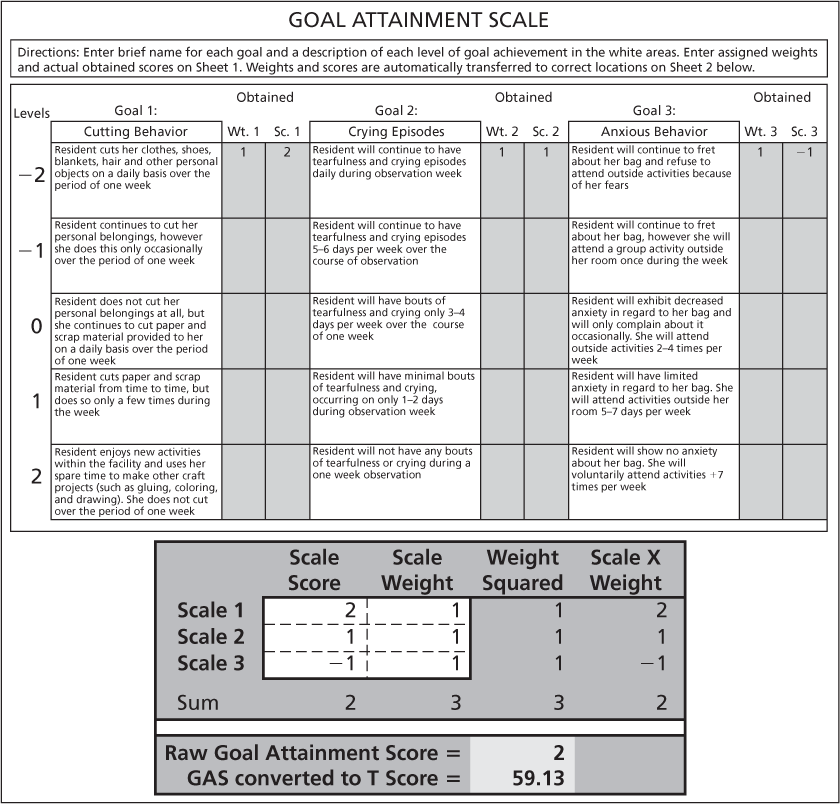
Participant progress may be evaluated only at program completion or at multiple points in time, such as program completion and three-month, six-month, and one-year follow-ups. Figure 5.4 shows how a practitioner might employ GAS to monitor progress over time on one goal for one program participant.
Figure 5.4 Goal Attainment Planning Sheet for Specifying a Range of Outcomes and Monitoring Progress
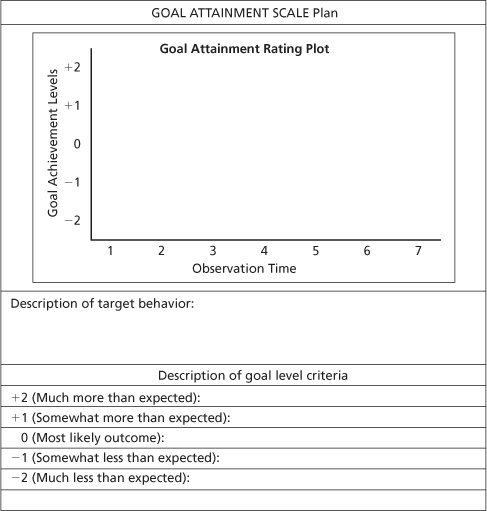
Human service users typically have several goals, and the primary appeal of GAS is its capacity to provide a single, summary measure of an individual’s progress across multiple goals that can be used to summarize program effect on a group of service users. Following this approach, the practitioner follows these steps (Schlosser 2004):
Select a set of individualized goals for each participant that the intervention will address. Typically, about three or four goals are employed.
Assign a weight to each goal if the goals are of unequal importance.
Specify a continuum of outcomes from (-2) to (+2).
Identify specific, observable criteria for each individual on each of the levels from (-2), or much less than expected attainment, to (+2), or much more than expected attainment.
Implement the intervention.
Determine each participant’s level of performance on each of the goals.
Compute an overall goal attainment score for each participant.
Developing criteria for each goal is undoubtedly the most difficult step—and one requiring considerable skill on the part of the practitioner. The range of outcomes must be realistic, must provide a continuity of outcome that does not overlap or have gaps, and should not use vague or ambiguous referents (Cardillo 1994).
In a typical application, the human service practitioner reviews progress at the termination of intervention or some specified follow-up date and rates the level of outcome actually obtained. The evaluator can then compute a summary score by combining the results of each goal. Assuming that all the goals are of equal weight, one approach is to simply take the average of the individual goal scores. We can illustrate this by using the data from Figure 5.3. There are three goals, with outcomes of (+2), (+1), and (-1), respectively, so the composite score is ((+2) + (+1) + (-1))/3 = 0.67. The expected outcome of each goal is “0,” so the positive value of 0.67 indicates greater than expected achievement. A negative value would have indicated lower than expected achievement.
Instead of using raw scores, the originators of GAS propose converting the results into T-scores (Cardillo and Smith 1994). T-scores are standardized scores, with a mean of 50 and a standard deviation of 10. The benefit of converting participant raw scores to T-scores is that the evaluator can compare and combine the score for that individual with the scores of other patients even though the number of goals and the specific targets differ from one participant to another. This means that GAS can produce equivalent data for large numbers of service users, and these data can then be used for research purposes. In other words, GAS produces practice-based evidence, which is another example of a linkage between practice and research.
The developers of GAS emphasize that its strength is in measuring participant change. The GAS scores reflect the amount of change in the individual, whatever the intervention target, rather than the absolute level of knowledge or skills that participants attain (Smith 1994). If the focus of evaluation is on how many participants in a remedial education program have achieved at least an eighth-grade reading level rather than how much each person has changed, it would be more appropriate to use a standardized academic achievement test rather than GAS. Those interested in applying GAS will find additional resources on the text Web site, including the spreadsheet used to produce the table in Figure 5.3. Another helpful Internet resource is the Goal Attainment Scaling page maintained by Stephen Marson (http://www.marson-and-associates.com/GAS/GAS_index.html).
Information Technology in Research: Computerized Data Collection: Enhancing Researcher-Practitioner Collaboration
Both practitioners and researchers need information, or data. Practitioners need it to assess the problems facing their clients as well as to satisfy the demands of agencies and monitoring organizations for documentation of progress and intervention outcome. Researchers need data to find solutions for social problems. Despite this common need for information, a gap often exists between research and practice (Clark 2002). Practitioners may see participating in research as an interference with practice and complain that the results of research are not helpful in guiding practice. Conversely, researchers may complain that practitioners are uncooperative and fail to provide the structured, controlled data collection valued for research.
The field of substance abuse provides an exciting example of collaboration between addiction treatment practitioners and researchers, a collaboration that helped to bridge that gap through the design and implementation of a computer-assisted method of data collection (Carise, Cornely, and Gurel 2002). The project involved the Treatment Research Institute, an organization specializing in substance-abuse treatment research, and a treatment provider, Fresh Start, which operates recovery houses. The implementation of a computerized data-collection system known as the Drug Evaluation Network System (DENS) proved both valuable to practitioners in delivering services and an excellent source of data for research.
The DENS features the Addiction Severity Index (ASI), a well-accepted instrument for measurement, as its primary data source. The ASI has been a popular assessment tool in substance abuse for more than two decades. Designed as a semistructured, 200-item interview, the index addresses seven potential problem areas in substance-abusing patients: medical status, employment and support, drug use, alcohol use, legal status, family/social status, and psychiatric status (McLellan et al. 1992). In its original paper-and-pencil format, a skilled interviewer requires about an hour to gather information on recent (past 30 days) and lifetime problems in all the problem areas. Practitioners have used the ASI with psychiatrically ill, homeless, pregnant, and prisoner populations, but mostly with adults seeking treatment for substance abuse problems.
Because treatment personnel use the ASI as an intake or assessment instrument, incorporating it into the DENS software system makes the DENS potentially useful to the treatment staff. The ASI also is widely used in clinical and health service research projects, so the DENS is of value to researchers who need scientifically valid information. Research cooperation in adopting the DENS program is especially attractive to the practitioner for two reasons: First, the computer form can be completed in less time and with fewer errors, thanks to an automatic error-checking feature, than the paper-and-pencil version of the ASI. Second, the software generates an admissions narrative report for clinical staff that serves as the basis for mandatory third-party reports to state regulatory agencies and insurance providers. The software also provides program administrators with aggregate comparison reports of their patients in terms of all intake variables. In short, the DENS helps the practitioner cope with that most dreaded feature of the job—paperwork. In the long term, research results should prove helpful in guiding practice, but the real selling point for the practitioner is this immediate, time-saving benefit.
For the researcher’s purposes, treatment program staff collects ASI data, which are then transferred electronically to the Treatment Research Institute’s computer server so that the researchers have immediate access to it. In addition, it is possible to add new questions to the data-collection instrument so that the researchers can follow emerging trends as they happen. At the time of reporting on the project, 72 treatment programs in five major cities were participating in the program.
A major factor in the success of this collaborative effort between researchers and practitioners was the fact that both parties clearly stood to benefit. Besides greater efficiency and reduced paperwork, the collaboration helped practitioners modify service delivery of the program to meet client needs. For example, when the data showed a high percentage of female clients reporting a history of sexual abuse, Fresh Start added a female staff member to provide group sessions aimed at the needs of women survivors of sexual abuse. Such benefits for practice motivated the clinicians to provide the best-quality data that the researchers required for valid, reliable measurement.
Review and Critical Thinking Main PointsMeasurement is the process of describing abstract concepts in terms of specific indicators by assigning numbers or other symbols to them.
An indicator is an observation that we assume to be evidence for the attributes or properties of some phenomenon. Social research measures most variables through verbal reports, observation, or archival records. Positivists and nonpositivists disagree about the nature of measurement.
The four levels of measurement are nominal, ordinal, interval, and ratio.
The nature of the variable itself and the way that it is measured determines the level of measurement achieved with a given variable.
Discrete variables have a limited number of distinct and separate values. Continuous variables theoretically have an infinite number of possible values.
Validity refers to a measure’s ability to measure accurately the variable it measures.
Face validity, content or sampling validity, jury opinion, criterion validity, and construct validity are techniques of assessing the validity of measures.
Reliability refers to a measure’s ability to yield consistent results each time it is applied.
Test—retest, multiple forms, and internal consistency, such as split-half, are techniques for assessing the reliability of measures.
Measurement in social research must be culturally sensitive; researchers should never assume a measurement instrument that is valid and reliable for a majority group will be so for minorities.
Random errors are neither consistent nor patterned and can reduce the precision with which variables are measured.
Systematic errors are consistent and patterned and, unless noted, can potentially lead to erroneous conclusions.
Researchers can take a number of steps to improve the validity and reliability of measurement devices.
Measurement devices are chosen on the basis of theoretical considerations, their validity and reliability, their level of measurement, the amount of systematic and random errors, and feasibility.
concurrent validity
construct validity
content validity
continuous variables
criterion validity
discrete variables
face validity
index
indicator
interval measures
item
jury opinion
level of measurement
measurement
multitrait—multimethod approach
nominal measures
ordinal measures
predictive validity
random errors
ratio measures
reliability
sampling validity
scale
systematic error
validity
Measurement is all about being careful and precise. It is about linking the abstract world of concepts and ideas to the concrete world of observations. Much can be learned from how scientists do these things and translated into tips for critically analyzing any information or situations that you might confront:
When something is being discussed, can you identify any explicit or implicit indicators (or operational definitions) that are being used? In other words, how do people know if that thing exists or how much of it exists?
Would any particular group’s values or interests be promoted by particular operational definitions? Does this produce any bias?
Is there any effort to evaluate these operational definitions (that is, assessment of validity and reliability)?
Could error in measurement be affecting what is being said or observed?
Many Web sites can help you find existing measurement tools, such as scales and indexes. An excellent example is the Web site of the Buros Institute of Mental Measurements (www.unl.edu/buros/index.html). The institute monitors the quality of commercially published tests and encourages improved test development by providing critical analysis of individual instruments. Buros publishes the Mental Measurements Yearbook, and its Web site lists thousands of instruments and provides access to critical reviews of the various scales.
Another site with information on specific scales and measurement tools is the WALMYR Publishing Co. home page (www.walmyr.com).
Another approach to finding Internet resources on measurement is to use a search engine and search for such terms as “measurement group” or “social work measurement.” The former term produced the Web site of The Measurement Group (www.themeasurementgroup.com), which is a private consulting firm that focuses on evaluation research and policy development, primarily in the health area. At this Web site, you will find much information about measurement with standardized tests and instruments as well as links to numerous other Web sites, journals, and professional associations relevant to measurement issues.
One specific area that you might find valuable to search through is psychometrics, which is the study of personality and mental states and attributes, often used for diagnostic and clinical (rather than research) purposes. Psychometrics, however, is a highly quantitative field and, thus, is a good area in which to explore measurement issues. You might try the home page of the American Psychological Association (www.apa.org), using its search feature or clicking on the “Testing Issues” button.
For Further ReadingBlythe, Betty J., and Tony Tripodi. Measurement in Direct Practice. Newbury Park, Calif.: Sage, 1989. This book looks at measurement issues from the standpoint of day-to-day efforts to apply successful interventions to help clients. It should be particularly useful for those who are currently in or planning to enter direct practice.
Campbell, Donald T., and M. Jean Russo. Social Measurement. Thousand Oaks, Calif.: Sage, 2001. This book provides a user-friendly presentation of Campbell’s essential work in social measurement. The book includes his arguments as to why qualitative approaches belong with quantitative ones as well as his debate with deconstructionists and social constructionists over measurement validity.
Geismar, Ludwig L., and Michael Camasso. The Family Functioning Scale: A Guide to Research and Practice. New York: Springer, 1993. This book provides an excellent illustration of measurement in both research and practice as it explores development of a family functioning scale for use in both realms. It is a good example of both the parallels and linkages between research and practice.
Hersen, Michel, editor-in-chief. Comprehensive Handbook of Psychological Assessment, Volumes 1–4. New York: Wiley, 2003. These volumes provide essential information about developing and using the major types of psychological assessment instruments. These assessment instruments address the same kinds of measurement issues as instruments used in research do.
Hindelang, Michael J., Travis Hirschi, and Joseph G. Weis. Measuring Delinquency. Beverly Hills, Calif.: Sage, 1980. A good description of the development of a measuring device related to a human service issue. The volume covers all the issues related to problems of measurement.
Kirk, Jerome, and Marc L. Miller. Reliability and Validity in Qualitative Research. Beverly Hills, Calif.: Sage, 1986. This work presents the measurement issues of reliability and validity as they apply to qualitative research, such as field research (see Chapter 9). Unfortunately, reliability and validity often are presented only in the context of quantitative research.
Martin, Lawrence L., and Peter M. Kettner. Measuring the Performance of Human Service Programs, 2d ed. Thousand Oaks, Calif.: Sage, 2009. This short book explains in detail how to measure and assess human service programs, especially with outcome measures. It includes such measures as levels of functioning scales and client satisfaction.
Miller, Delbert C., and Neil J. Salkind. Handbook of Research Design and Social Measurement, 6th ed. Thousand Oaks, Calif.: Sage, 2002. A good resource work for scales and indexes focusing on specific human service concerns
CHAPTER 7
The term survey both designates a specific way of collecting data and identifies a broad research strategy. Survey data collection involves gathering information from individuals, called respondents, by having them respond to questions. We use surveys to gather data as a part of many of the research methods discussed in other chapters, such as qualitative studies, quantitative studies, experiments, field research, and program evaluations. In fact, the survey probably is the most widely used means of gathering data in social science research. A literature search in the online database Sociological Abstracts (SocAbs) for the five-year period from 1998 to 2002 using the key-word search terms “social work” and “survey” identified more than 600 English-language journal articles. Surveys have been used to study all five of the human service focal areas discussed in Chapter 1. This illustrates a major attraction of surveys—namely, flexibility.
As a broad research strategy, survey research involves asking questions of a sample of people, in a fairly short period of time, and then testing hypotheses or describing a situation based on their answers. As a general approach to knowledge building, the strength of surveys is their potential for generalizability. Surveys typically involve collecting data from large samples of people; therefore, they are ideal for obtaining data that are representative of populations too large to deal with by other methods. Consequently, many of the issues addressed in this chapter center around how researchers obtain quality data that are, in fact, representative.
All surveys involve presenting respondents with a series of questions to answer. These questions may tap matters of fact, attitudes, opinions, or future expectations. The questions may be simple, single-item measures or complex, multiple-item scales. Whatever the form, however, survey data basically are what people say to the investigator in response to a question. We collect data in survey research in two basic ways: with questionnaires, or with interviews. A questionnaire contains recorded questions that people respond to directly on the questionnaire form itself, without the aid of an interviewer. A questionnaire can be handed directly to a respondent; can be mailed or sent online to the members of a sample, who then fill it out on their own and send it back to the researcher; or can be presented via a computer, with the respondent recording answers with the mouse and keypad. An interview involves an interviewer reading questions to a respondent and then recording his or her answers. Researchers can conduct interviews either in person or over the telephone.
Some survey research uses both questionnaire and interview techniques, with respondents filling in some answers themselves and being asked other questions by interviewers. Because both questionnaires and interviews involve asking people to respond to questions, a problem central to both is what type of question we should use. In this chapter, we discuss this issue first, and then we analyze the elements of questionnaires and interviews separately. An important point to emphasize about surveys is that they only measure what people say about their thoughts, feelings, and behaviors. Surveys do not directly measure those thoughts, feelings, and behaviors. For example, if people tell us in a survey that they do not take drugs, we have not measured actual drug-taking behavior, only people’s reports about that behavior. This is very important in terms of the conclusions that can be drawn: We can conclude that people report not taking drugs, but we cannot conclude that people do not take drugs. This latter is an inference we might draw from what people say. So, surveys always involve data on what people say about what they do, not what they actually do.
Designing Questions Closed-Ended versus Open-Ended QuestionsTwo basic types of questions are used in questionnaires and interviews: closed-ended, or open-ended (Sudman and Bradburn 1982). Closed-ended questions provide respondents with a fixed set of alternatives from which to choose. The response formats of multiple-item scales, for example, are all closed-ended, as are multiple-choice test questions. Open-ended questions require that the respondents write their own responses, much as for an essay-type examination question.
The proper use of open- and closed-ended questions is important for the quality of data generated as well as for the ease of handling that data. Theoretical considerations play an important part in the decision about which type of question to use. In general, we use closed-ended questions when we can determine all the possible, theoretically relevant responses to a question in advance and the number of possible responses is limited. For example, The General Social Survey question for marital status reads, “Are you currently—married, widowed, divorced, separated, or have you never been married?” A known and limited number of answers is possible. (Today, researchers commonly offer people an alternative answer to this question—namely, “living together” or cohabitating. Although cohabitation is not legally a marital status, it helps to accurately reflect the living arrangements currently in use.) Another obvious closed-ended question is about gender. To leave such questions open-ended runs the risk that some respondent will either purposefully or inadvertently answer in a way that provides meaningless data. (Putting “sex” with a blank after it, for example, is an open invitation for some character to write “yes” rather than the information wanted.)
Open-ended questions, on the other hand, are appropriate for an exploratory study in which the lack of theoretical development suggests that we should place few restrictions on people’s answers. In addition, when researchers cannot predict all the possible answers to a question in advance, or when too many possible answers exist to list them all, then closed-ended questions are not appropriate. Suppose we wanted to know the reasons why people moved to their current residence. So many possible reasons exist that such a question has to be open-ended. If we are interested in the county and state in which our respondents reside, then we can generate a complete list of all the possibilities and, thus, create a closed-ended question. This list would consume so much space on the questionnaire, however, that it would be excessively cumbersome, especially considering that respondents should be able to answer this question correctly in its open-ended form.
Some topics lend themselves to a combination of both formats. Religious affiliation is a question that usually is handled in this way. Although a great many religions exist, there are some to which only a few respondents will belong. Thus, we can list religions with large memberships in closed-ended fashion and add the category “other,” where a person can write the name of a religion not on the list (see Question 4 in Table 7.1). We can efficiently handle any question with a similar pattern of responses—numerous possibilities, but only a few popular ones—in this way. The combined format maintains the convenience of closed-ended questions for most of the respondents but also allows those with less common responses to express them.
Table 7.1 Formatting Questions for a Questionnaire
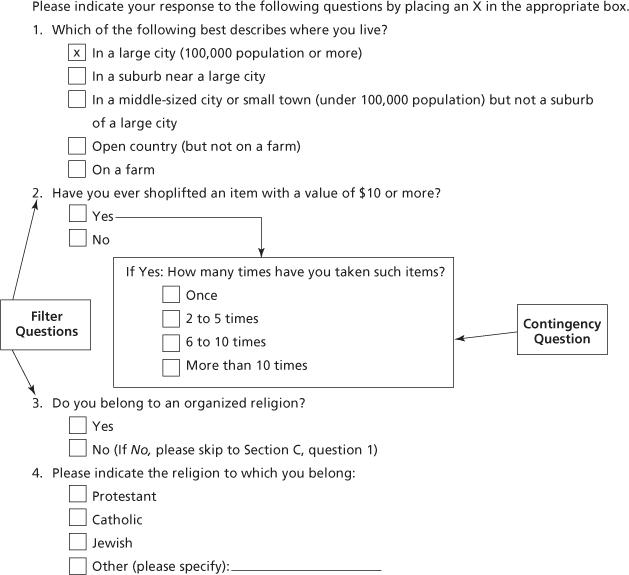
When we use the option of “other” in a closed-ended question, it is a good idea to request that respondents write in their response by indicating “Please specify.” We can then code these answers into whatever response categories seem to be appropriate for data analysis. Researchers should offer the opportunity to specify an alternative, however, even if, for purposes of data analysis, we will not use the written responses. This is done because respondents who hold uncommon views or memberships may be proud of them and desire to express them on the questionnaire. In addition, well-educated professionals tend to react against completely closed-ended questions as too simple, especially when the questions deal with complicated professional matters (Sudman 1985). The opportunity to provide a written response to a question is more satisfying to such respondents, and given this opportunity, they will be more likely to complete the questionnaire.
Another factor in choosing between open- and closed-ended questions is the ease with which we can handle each at the data analysis stage. Open-ended questions sometimes are quite difficult to work with. One difficulty is that poor handwriting or the failure of respondents to provide clear answers can result in data that we cannot analyze (Rea and Parker 2005). Commonly, some responses to open-ended questions just do not make sense, so we end up dropping them from analysis. In addition, open-ended questions are more complicated to analyze by computer, because we must first code a respondent’s answers into a limited set of categories and this coding not only is time-consuming but also can introduce error (see Chapter 14).
Another related difficulty with open-ended questions is that some respondents may give more than one answer to a question. For example, in a study of substance abuse, researchers might ask people why they use—or do not use—alcoholic beverages. As a response to this question, a researcher might receive the following answer: “I quit drinking because booze was too expensive and my wife was getting angry at me for getting drunk.” How should this response be categorized? Should the person be counted as quitting because of the expense or because of the marital problems created by drinking? It may be, of course, that both factors were important in the decision to quit. Researchers usually handle data analysis problems like this in one of two ways: First, the researchers may accept all the individual’s responses as data. This, however, creates difficulties in data analysis; some people give more reasons than others because they are talkative rather than because they actually have more reasons for their behavior. Second, the researchers may handle multiple responses by assuming that each respondent’s first answer is the most important one and considering that answer to be the only response. This assumption, of course, is not always valid, but it does solve the dilemma systematically.
The decision about whether to use open- or closed-ended questions is complex, often requiring considerable experience with survey methods. An important issue, it can have substantial effects on both the type and the quality of the data collected, as illustrated in a survey of attitudes about social problems confronting the United States. The Institute for Social Research at the University of Michigan asked a sample of people open- and closed-ended versions of essentially the same questions (Schuman and Presser 1979). The two versions elicited quite different responses. For example, with the closed-ended version, 35 percent of the respondents indicated that crime and violence were important social problems, compared with only 15.7 percent in the open-ended version. With a number of other issues, people responding to the closed-ended questions were more likely to indicate that particular issues were problems. One reason that the type of question has such an effect on the data is that the list of alternatives in the closed-ended questions tends to serve as a “reminder” to the respondent of issues that might be problems. Without the stimulus of the list, some respondents might not even think of some of these issues. A second reason is that people tend to choose from the list provided in closed-ended questions rather than writing in their own answers, even when provided with an “other” category.
In some cases, researchers can gain the benefits of both open- and closed-ended questions by using an open-ended format in a pretest or pilot study and then, based on these results, designing closed-ended questions for the actual survey.
Wording of QuestionsBecause the questions that make up a survey are the basic data-gathering devices, researchers need to word them with great care. Especially with questionnaires that allow the respondent no opportunity to clarify questions, ambiguity can cause substantial trouble. We will review some of the major issues in developing good survey questions (Sudman and Bradburn 1982). (In Chapter 13, we will discuss some problems of question construction having to do specifically with questions that are part of multiple-item scales.)
Researchers should subject the wording of questions, whenever possible, to empirical assessment to determine whether a particular wording might lead to unnoticed bias. Words, after all, have connotative meanings—that is, emotional or evaluative associations—that the researcher may not be aware of but that may influence respondents’ answers to questions. In a study of attitudes about social welfare policy in the United States, for example, researchers asked survey respondents whether they believed the government should spend more or less money on welfare (T.W. Smith 1987). Respondents, however, were asked the question in three slightly different ways. One group was asked about whether we were spending too much or too little on “welfare,” a second group about spending too much or too little on “assistance for the poor,” and a third group about money for “caring for the poor.” At first glance, all three questions seem to have much the same meaning, yet people’s responses to them suggested something quite different. Basically, people responded much more negatively to the question with the word “welfare” in it, indicating much less willingness to spend more money on “welfare” compared with spending money to “assist the poor.” For example, 64.7 percent of the respondents indicated that too little was being spent on “assistance to the poor,” but only 19.3 percent said we were spending too little on “welfare.” This is a very dramatic difference in opinion, resulting from what might seem, at first glance, to be a minor difference in wording. Although the study did not investigate why these differing responses occurred, it seems plausible that the word “welfare” has connotative meanings for many people that involve images of laziness, waste, fraud, bureaucracy, or the poor as being disreputable. “Assisting the poor,” on the other hand, is more likely associated with giving and Judeo-Christian charity. These connotations lead to quite different responses. In many cases, the only way to assess such differences is to compare people’s responses with different versions of the same question during a pretest.
In general, researchers should state questions in the present tense. Specialized questions that focus on past experiences or future expectations, however, are an exception. In these situations, researchers should use the appropriate past or future tense. Of major importance is making sure that tenses are not carelessly mixed. Failure to maintain consistent tense of questions can lead to an understandable confusion on the part of respondents and, therefore, to more measurement error.
Researchers should keep questions simple and direct, expressing only one idea, and avoid complex statements that express more than one idea. Consider the following double-negative question that appeared in a Roper Organization poll conducted in 1992 about the Holocaust: “Does it seem possible or does it seem impossible to you that the Nazi extermination of the Jews never happened?” (Smith 1995, p. 269). The results showed that 22 percent said “possible,” 65 percent “impossible,” and 12 percent “don’t know.” Could it be that more than one fifth of Americans had doubts about the Holocaust and more than one third questioned it or were uncertain that it had occurred? Considerable controversy erupted over the survey results. In a subsequent Gallup Poll, researchers asked respondents the same double-negative question with this follow-up question: “Just to clarify, in your opinion, did the Holocaust definitely happen, probably happen, probably not happen, or definitely not happen?” (Smith 1995, p. 277). Of those who had said it was possible that the Holocaust never happened in response to the first question, 97 percent changed their position to say that it did happen with the second question.
Statements that seem to be crystal clear to a researcher may prove to be unclear to many respondents. One common error is to overestimate the reading ability of the average respondent. For example, a national study of adult literacy found that more than 20 percent of adults in the United States demonstrate skills in the lowest level of prose, document, and quantitative literacy proficiencies. At this level, many people cannot total an entry on a deposit slip, identify a piece of specific information in a brief news article, or respond to many of the questions on a survey form (Kirsch et al. 1993). Such limited literacy skills are common among some clients of the human services, especially when English is a second language. Accordingly, the researcher should avoid the use of technical terms on questionnaires. For example, it would not be advisable to include such a statement as “The current stratification system in the United States is too rigid.” The word “stratification” is a technical term in the social sciences that many people outside the field do not understand in the same sense that social scientists do.
Another practice to avoid is making reference to things that we cannot clearly define or that depend on the respondent’s interpretation. For example, “Children who get into trouble typically have had a bad home life” is an undesirable statement, because it includes two sources of vagueness. The word “trouble” is unclear. What kind of trouble? Trouble with the law? Trouble at school? Trouble with parents? The other problem is the phrase “bad home life,” because what constitutes a “bad home life” depends on the respondent’s interpretation.
Finally, for the majority of questions designed for the general public, researchers should never use slang terminology. Slang tends to arise in the context of particular groups and subcultures. Slang terms may have a precise meaning within those groups, but such terms confuse people outside those groups. Occasionally, however, the target population for a survey is more specialized than the general population, and the use of their “in-group” jargon may be appropriate. It would demonstrate to the respondents that the researcher cared enough to “learn their language” and could increase rapport, resulting in better responses. Having decided to use slang, however, the burden is on the researcher to be certain that he or she uses it correctly.
Once a survey instrument is developed, it must be pretested to see if the questions are clearly and properly understood and are unbiased. We can handle pretesting by having people respond to the questionnaire or interview and then reviewing it with them to find any problems. The way that a group responds to the questions themselves also can point out trouble. For example, if many respondents leave a particular answer blank, then there may be a problem with that question. Once the instrument is pretested and modifications are made where called for, the survey should be pretested again. Any change in the questionnaire requires more pretesting. Only when it is pretested with no changes being called for is the questionnaire ready to use in research.
We present these and other problems that can arise in writing good survey questions in Table 7.2. One of the critical decisions in survey research—and it is a complex decision—is whether to collect data through questionnaires or through interviews. We discuss both types of surveys with an eye on the criteria to use in assessing which is more appropriate for a particular research project.
Table 7.2 Common Errors in Writing Questions and Statements
| Original Question | Problem | Solution |
| The city needs more housing for the elderly and property taxes should be raised to finance it. | Two questions in one: Some respondents might agree with the first part but disagree with the second. | Questions should be broken up into two separate statements, each expressing a single idea. |
| In order to build more stealth bombers, the government should raise taxes. | False premise: What if a person doesn’t want more bombers built? How do they answer? | First ask their opinion on whether the bomber should be built; then, for those who respond “Yes,” ask the question about taxes. |
| Are you generally satisfied with your job, or are there some things about it that you don’t like? | Overlapping alternatives: A person might want to answer “Yes” to the first part (i.e., they are generally satisfied) but “No” to the second part (i.e., there are also some things they don’t like). | Divide this into two questions: one measures their level of satisfaction while the other assesses whether there are things they don’t like. |
| How satisfied are you with the number and fairness of the tests in this course? | Double-barreled question: It asks about both the “number” and the “fairness,” and a person might feel differently about each. | Divide this into two questions. |
| What is your income? | Vague and ambiguous words: Does “income” refer to before-tax or after-tax income? To hourly, weekly, monthly, or yearly income? | Clarify: What was your total annual income, before taxes, for the year 2000? |
| Children who get into trouble typically have had a bad home life. | Vague and ambiguous words: The words trouble and bad home life are unclear. Is it trouble with the law, trouble at school, trouble with parents, or what? What constitutes a bad home life depends on the respondent’s interpretation. | Clarify: Specify what you mean by the words: trouble means “having been arrested” and bad home life means “an alcoholic parent.” |
Questionnaires are designed so that they can be answered without assistance. Of course, if a researcher hands a questionnaire to the respondent, as we sometimes do, the respondent then has the opportunity to ask the researcher to clarify anything that is ambiguous. A good questionnaire, however, should not require such assistance. In fact, researchers often mail questionnaires or send them online to respondents, who thus have no opportunity to ask questions. In other cases, researchers administer questionnaires to many people simultaneously in a classroom, auditorium, or agency setting. Such modes of administration make questionnaires quicker and less expensive than most interviews; however, they place the burden on researchers to design questionnaires that respondents can properly complete without assistance.
Structure and Design DirectionsOne of the simplest—but also most important—tasks of questionnaire construction is the inclusion of precise directions for respondents. Good directions go a long way toward improving the quality of data that questionnaires generate. If we want respondents to put an “X” in a box corresponding to their answer, then we tell them to do so. Questionnaires often contain questions requiring different kinds of answers as well, and at each place in the questionnaire where the format changes, we need to include additional directions.
Order of QuestionsAn element of questionnaire construction that requires careful consideration is the proper ordering of questions. Careless ordering can lead to undesirable consequences, such as a reduced response rate or biased responses to questions. Generally, questions that are asked early in the questionnaire should not bias answers to those questions that come later. For example, if we asked several factual questions regarding poverty and the conditions of the poor, and we later asked a question concerning which social problems people consider to be serious, more respondents will likely include poverty than would otherwise have done so. When a questionnaire contains both factual and opinion questions, we sometimes can avoid these potentially biasing effects by placing opinion questions first.
Ordering of questions also can increase a respondent’s interest in answering a questionnaire—this is especially helpful for boosting response rates with mailed questionnaires. Researchers should ask questions dealing with particularly intriguing issues first. The idea is to interest the recipients enough to get them to start answering, because once they start, they are more likely to complete the entire questionnaire. If the questionnaire does not deal with any topics that are obviously more interesting than others, then opinion questions should be placed first. People like to express their opinions, and for the reasons mentioned earlier, we should put opinion questions first anyway. A pitfall we definitely want to avoid is beginning a questionnaire with the standard demographic questions about age, sex, income, and the like. People are so accustomed to those questions that they may not want to answer them again—and may promptly file the questionnaire in the nearest wastebasket.
Question FormatsAll efforts at careful wording and ordering of the questions will be for naught unless we present the questions in a manner that facilitates responding to them. The goal is to make responding to the questions as straightforward and convenient as possible and to reduce the amount of data lost because of responses that we cannot interpret.
When presenting response alternatives for closed-ended questions, we obtain the best results by having respondents indicate their selection by placing an “X” in a box (![]() ) corresponding to that alternative, as illustrated in Question 1 of Table 7.1. This format is preferable to open blanks and check marks (✓), because it is easy for respondents to get sloppy and place check marks between alternatives, rendering their responses unclear and, therefore, useless as data. Boxes force respondents to give unambiguous responses. This may seem to be a minor point, but we can attest from our own experience in administering questionnaires that it makes an important difference.
) corresponding to that alternative, as illustrated in Question 1 of Table 7.1. This format is preferable to open blanks and check marks (✓), because it is easy for respondents to get sloppy and place check marks between alternatives, rendering their responses unclear and, therefore, useless as data. Boxes force respondents to give unambiguous responses. This may seem to be a minor point, but we can attest from our own experience in administering questionnaires that it makes an important difference.
Some questions on a questionnaire may apply to only some respondents and not others. These questions normally are handled by what are called filter questions and contingency questions. A filter question is a question whose answer determines which question the respondent goes to next. In Table 7.1, Questions 2 and 3 are both filter questions. In Question 2, the part of the question asking about “how many items they have taken” is called a contingency question, because whether a person answers it depends on—that is, it is contingent on—his or her answer to the filter question. Notice the two ways in which the filter question is designed with a printed questionnaire. With Question 2, the person answering “Yes” is directed to the next question by the arrow, and the question is clearly set off by a box. Also in the box, the phrase “If Yes” is included to make sure the person realizes that this question is only for those who answered “Yes” to the previous question. With Question 3, the answer “No” is followed by a statement telling the person which question he or she should answer next. Either format is acceptable; the point is to provide clear directions for the respondent. (When questionnaires are designed by special computer programs to be answered on a computer screen or online, the computer program automatically moves the respondent to the appropriate contingency question once the person answers the filter question.) By sectioning the questionnaire on the basis of filter and contingency questions, we can guide the respondent through even the most complex questionnaire. The resulting path that an actual respondent follows through the questionnaire is referred to as the skip pattern. As is true of many aspects of questionnaire design, it is important to evaluate the skip pattern by pretesting the questionnaire to ensure that respondents complete all appropriate sections with a minimum of frustration.
In some cases, a number of questions or statements may all have identical response alternatives. An efficient way of organizing such questions is in the form of a matrix question, which lists the response alternatives only once; a box to check, or a number or letter to circle, follows each question or statement. Table 13.1 on page 350 is an example of a matrix question. Multiple-item indexes and scales often use this compact way of presenting a number of items.
Researchers should use matrix questions cautiously, however, because these questions contain a number of weaknesses. One is that, with a long list of items in a matrix question, it is easy for the respondent to lose track of which line is the response for which statement and, thus, to indicate an answer on the line above or below where the answer should go. Researchers can alleviate this by following every third or fourth item with a blank line so that it is easier visually to keep track of the proper line on which to mark an answer. A second weakness of matrix questions is that they may produce response set. (We will discuss the problem of response set and techniques for alleviating it at length in Chapter 13.) A third weakness of matrix questions is that they may tempt the researcher, to be able to gain the efficiencies of the format, to force the response alternatives of some questions into that matrix format when another format would be more valid. Researchers should determine the response format of any question or statement by theoretical and conceptual considerations of what is the most valid way to measure a variable.
Response RateA major problem in many research endeavors is gaining people’s cooperation so that they will provide whatever data are needed. In surveys, we measure cooperation by the response rate, or the proportion of a sample that completes and returns a questionnaire or that agrees to an interview. With interviews, response rates often are very high—in the area of 90 percent—largely because people are reluctant to refuse a face-to-face request for cooperation. In fact, with interviews, the largest nonresponse factor is the inability of the interviewers to locate respondents. With mailed or online questionnaires, however, this personal pressure is absent, and people feel freer to refuse. This can result in many nonreturns, or people who refuse to complete and return a questionnaire. Response rates for questionnaires (especially mailed ones) vary considerably, from an unacceptably low 20 percent to levels that rival those of interviews.
Why is a low response rate of such concern? The issue is the representativeness of a sample, as we discussed in Chapter 6. If we selected a representative sample and obtained a perfect 100 percent response, then we would have confidence in the representativeness of the sample data. As the response rate drops below 100 percent, however, the sample may become less representative. Those who refuse to cooperate may differ in some systematic ways from those who do return the questionnaire that can affect the results of the research. In other words, any response rate less than 100 percent may result in a biased sample. Of course, we rarely achieve a perfect response rate, but the closer the response rate is to that level, the more likely that the data are representative. Researchers can take a number of steps to improve response rates. Most apply only to questionnaires, but we also can use a few of them to increase the response rates in interviews.
A Cover LetterA properly constructed cover letter can help increase the response rate. A cover letter accompanies a questionnaire and serves to introduce and explain it to the recipient. With mailed or online questionnaires, the cover letter may be the researcher’s only medium for communicating with the recipient, so the researcher must carefully draft the letter to include information that recipients will want to know and to encourage them to complete the questionnaire (see Table 7.3).
Table 7.3 Items to Include in the Cover Letter of a Questionnaire or the Introduction to an Interview
| Item | Cover Letter | Interview Introduction | |
| 1. | Sponsor of the research | yes | yes |
| 2. | Address/phone number of the researcher | yes | if required |
| 3. | How the respondent was selected | yes | yes |
| 4. | Who else was selected | yes | yes |
| 5. | The purpose of the research | yes | yes |
| 6. | Who will utilize or benefit from the research | yes | yes |
| 7. | An appeal for the person’s cooperation | yes | yes |
| 8. | How long it will take the respondent to complete the survey | yes | yes |
| 9. | Payment | if given | if given |
| 10. | Anonymity/confidentiality | if given | if given |
| 11. | Deadline for return | yes | not applicable |
Researchers should feature the name of the sponsor of the research project prominently in the cover letter. Recipients want to know who is seeking the information they are being asked to provide, and research clearly indicates that knowledge of the sponsoring organization influences the response rate (Goyder 1985; Rea and Parker 2005). Questionnaires sponsored by governmental agencies receive the highest response rates. University-sponsored research generates somewhat lower response rates. Commercially sponsored research produces the lowest rates of all. Apparently, if the research is at all associated with a governmental agency, stressing that in the cover letter may have a beneficial effect on the response rate. Researchers also can increase the response rates of particular groups if their research is sponsored or endorsed by an organization that people in the group believe has legitimacy. For example, we can increase response rates of professionals if the research is linked to relevant professional organizations, such as the National Association of Social Workers, the American Nurses Association, or the National Education Association (Sudman 1985).
The address and telephone number of the researcher also should appear prominently on the cover letter. In fact, using letterhead stationery for the cover letter is a good idea. Especially if the sponsor of the research is not well known, some recipients may desire further information before they decide to participate. Although relatively few respondents will ask for more information, including the address and telephone number gives the cover letter a completely open and above-board appearance that may further the general cooperation of recipients.
In addition, the cover letter should inform the respondent of how people were selected to receive the questionnaire. It is not necessary to go into great detail on this matter, but people receiving an unanticipated questionnaire are naturally curious about how they were chosen to be part of a study. A brief statement, for example, that they were randomly selected or selected by computer (if this is the case) should suffice.
Recipients also want to know the purpose of the research. Again, without going into great detail, the cover letter should explain why the research is being conducted, why and by whom it is considered to be important, and the potential benefits that are anticipated from the study. Investigations have shown clearly that we can significantly increase the response rate if we emphasize the importance of the research to the respondent. We must word this part of the cover letter carefully, however, so that it does not sensitize respondents in such a way that affects their answers to our questions. We can minimize sensitizing effects by keeping the description of the purpose general—certainly, do not suggest any of the research hypotheses. Regarding the importance of the data and the anticipated benefits, the researcher should resist the temptation of hyperbole and, instead, make honest, straightforward statements. Respondents will see claims about “solving a significant social problem” or “alleviating the problems of the poor” as precisely what they are—exaggerated.
The preceding information provides a foundation for the single most important component of the cover letter—namely, a direct appeal for the recipient’s cooperation. General statements about the importance of the research are no substitute for a personal appeal to the recipient as to why he or she should take time to complete the questionnaire. Respondents must believe that their responses are important to the outcome (as, of course, they are). A statement to the effect that “your views are important to us” is a good approach that stresses the importance of each individual respondent and emphasizes that the questionnaire will allow the expression of opinions, which people like.
The cover letter also should indicate that the respondent will remain anonymous or that the data will be treated as confidential, whichever is the case. “Anonymous” means that no one, including the researcher, can link a particular respondent’s name to his or her questionnaire. “Confidential” means that even though the researcher can match a respondent’s name to his or her questionnaire, the researcher will treat the information collectively and will not link any individuals publicly to their responses.
With mailed questionnaires, two techniques assure anonymity (Sudman 1985). The best is to keep the questionnaire itself completely anonymous, with no identifying numbers or symbols; instead, the respondent gets a separate postcard, including his or her name, to mail back at the same time that he or she mails back the completed questionnaire. This way, the researcher knows who has responded and need not send reminders, yet no one can link a particular respondent’s name with a particular questionnaire. A second way to ensure anonymity is to attach a cover sheet to the questionnaire with an identifying number and assure the respondents that the researcher will remove and destroy the cover sheet once receipt of the questionnaire has been recorded. This second procedure provides less assurance to the respondent, because an unethical researcher might retain the link between questionnaires and their identification numbers. The first procedure, however, is more expensive because of the additional postcard mailing, so a researcher may prefer the second procedure for questionnaires that do not deal with highly sensitive issues that sometimes make respondents more concerned about anonymity. If the material is not highly sensitive, then assurances of confidentiality are adequate to ensure a good return rate. No evidence indicates that assuring anonymity rather than confidentiality increases the response rate in nonsensitive surveys (Moser and Kalton 1972).
Finally, the cover letter should include a deadline for returning the questionnaire—that is, a deadline calculated to take into account mailing time and a few days to complete the questionnaire. The rationale for a fairly tight deadline is that it encourages the recipients to complete the questionnaire soon after they receive it and not set it aside, where they can forget or misplace it.
PaymentResearch consistently shows that we also can increase response rates by offering a payment or other incentives as part of the appeal for cooperation and that these incentives need not be large to have a positive effect. Studies find that, depending on the respondents, an incentive of between $2 and $20 can add 10 percent to a response rate (Warriner et al. 1996; Woodruff, Conway, and Edwards 2000). For the greatest effect, researchers should include such payments with the initial mailing instead of promising payment on return of the questionnaire. One study found that including the payment with the questionnaire boosted the return rate by 12 percent over promising payment on the questionnaire’s return (Berry and Kanouse 1987). Researchers have used other types of incentives as well, such as entering each respondent in a lottery or donating to charity for each questionnaire returned, but these have shown mixed results as far as increasing response rates.
Mailing procedures also affect response rates. It almost goes without saying that researchers should supply a stamped, self-addressed envelope for returning the questionnaire to make its return as convenient as possible for the respondent. The type of postage used also affects the response rate, with stamps bringing about a 4 percent higher return rate compared with bulk-printed postage (Yammarino, Skinner, and Childers 1991). Presumably, the stamp makes the questionnaire appear more personal and less like unimportant junk mail. A regular stamped envelope also substantially increases the response rate in comparison with a business reply envelope (Armstrong and Luck 1987).
Follow-UpsThe most important procedural matter affecting response rates is the use of follow-up letters or other contacts. A substantial percentage of those who do not respond to the initial mailing will respond to follow-up contacts. With two follow-ups, researchers can achieve 15 to 20 percent increases over the initial return (James and Bolstein 1990; Woodruff, Conway, and Edwards 2000). Such follow-ups are clearly essential; researchers can do them by telephone, if the budget permits and speed is important. With aggressive follow-ups, the difference in response rates between mailed questionnaires and interviews declines substantially (Goyder 1985).
In general, researchers use two-step follow-ups. Some send follow-up letters to nonrespondents that encourage return of the questionnaire once the response to the initial mailing drops off. This letter should include a restatement of the points in the cover letter, with an additional appeal for cooperation. When response to the first follow-up declines, the researcher then sends a second follow-up to the remaining nonrespondents and includes another copy of the questionnaire in case people have misplaced the original. After two follow-ups, we consider the remaining nonrespondents to be a pretty intransigent lot, because additional follow-ups generate relatively few further responses.
Length and AppearanceTwo other factors that affect the rate of response to a mailed questionnaire are the length of the questionnaire and its appearance. As the length increases, the response rate declines. No hard-and-fast rule, however, governs the length of mailed questionnaires. Much depends on the intelligence and literacy of the respondents, the degree of interest in the topic of the questionnaire, and other such matters. It probably is a good idea, though, to keep the questionnaire to less than five pages, requiring no more than 30 minutes to fill out. Researchers must take great care to remove any extraneous questions, or any questions that are not essential to the hypotheses under investigation (Epstein and Tripodi 1977). Although keeping the questionnaire to less than five pages is a general guide, researchers should not strive to achieve this by cramming so much material onto each page that the respondent has difficulty using the instrument—because, as mentioned, the appearance of the questionnaire also is important in generating a high response rate. As discussed earlier, the use of boxed response choices and smooth transitions through contingency questions help make completing the questionnaire easier and more enjoyable for the respondent, which in turn increases the probability that he or she will return it.
Other Influences on Response RateMany other factors can work to change response rates. In telephone surveys, for example, the voice and manner of the interviewer can have an important effect (Oksenberg, Coleman, and Cannell 1986). Interviewers with higher-pitched, louder voices and clear, distinct pronunciation have lower refusal rates. The same is true for interviewers who sound competent and upbeat. Reminders of confidentiality, however, can negatively affect the response rate (Frey 1986): If an interviewer reminds a respondent of the confidentiality of the information partway through the interview, the respondent is more likely to refuse to respond to some of the remaining questions compared with someone who does not receive such a reminder. The reminder may work to undo whatever rapport the interviewer has already built up with the respondent.
A survey following all the suggested procedures should yield an acceptably high response rate. Specialized populations may, of course, produce either higher or lower rates. Because so many variables are involved, we offer only rough guidelines for evaluating response rates with mailed questionnaires. The desired response rate is 100 percent, of course. Anything less than 50 percent is highly suspect as far as its representativeness is concerned. Unless some evidence of the representativeness can be presented, we should use great caution when generalizing from such a sample. In fact, it might be best to treat the resulting sample as a non-probability sample from which we cannot make confident generalizations. In terms of what a researcher can expect, response rates in the 60 percent range are good; anything more than 70 percent is very good. Even with these response rates, however, we should use caution about generalizing and check for bias as a result of nonresponse. The bottom line, whether the response rate is high or low, is to report it honestly so that those who are reading the research can judge its generalizability for themselves.
Checking for Bias Due to NonresponseEven if researchers obtain a relatively high rate of response, they should investigate possible bias due to nonresponse by determining the extent to which respondents differ from nonrespondents (Groves 2004; Miller and Salkind 2002; Rea and Parker 2005). One common method is to compare the characteristics of the respondents with the characteristics of the population from which they were selected. If a database on the population exists, then we can simplify this job. For example, if researchers are studying a representative sample of welfare recipients in a community, the Department of Social Services is likely to have data regarding age, sex, marital status, level of education, and other characteristics for all welfare recipients in the community. The researchers can compare the respondents with this database on the characteristics for which data have already been collected. A second approach to assessing bias from non-response is to locate a subsample of nonrespondents and interview them. In this way, we can compare the responses to the questionnaire by a representative sample of nonrespondents with those of the respondents. This is the preferred method, because we can measure directly the direction and the extent of any bias that results from nonresponse. It is, however, the most costly and time-consuming approach.
Any check for bias from nonresponse, of course, informs us only about those characteristics on which we make comparisons. It does not prove that the respondents are representative of the whole sample on any other variables—including those that might be of considerable importance to the study. In short, we can gather some information regarding such bias, but in most cases, we cannot prove that bias from nonresponse does not exist.
The proper design of survey instruments is important to collecting valid data. Research in Practice 7.1 describes some of the key elements that are designed into a questionnaire used during an applied research project on the human services.
An Assessment of Questionnaires AdvantagesAs a technique of survey research, questionnaires have a number of desirable features. First, they gather data far more inexpensively and quickly than interviews do. Mailed questionnaires require only four to six weeks, whereas obtaining the same data by personal interviews would likely take a minimum of several months. Mailed questionnaires also save the expense of hiring interviewers, interviewer travel, and other costs.
Research in Practice 7.1: Needs Assessment: The Pregnancy Risk Assessment Monitoring System
During the 1980s, policymakers in the United States became increasingly aware of distressing statistics regarding pregnancy risk. For example, although infant mortality rates were declining, they were still distressingly high, and the prevalence of low-birth-weight infants showed little change. At the same time, such maternal behaviors as smoking, drug use, and limited use of prenatal and pediatric care services were recognized as being contributors to this lack of improvement. As a result of these concerns, the Centers for Disease Control and Prevention (CDC) developed the Pregnancy Risk Assessment Monitoring System, or PRAMS (Colley et al. 1999). According to the CDC, the PRAMS survey (actually a questionnaire) is a “surveillance system” that focuses on maternal behaviors and experiences before and during a woman’s pregnancy and during her child’s early infancy. The PRAMS supplements data from vital records for planning and assessing perinatal health programs within states. As of 1999, almost half of all states had grants to participate in the program, which currently covers more than 40 percent of all U.S. births. The PRAMS is an excellent example of how researchers can put the advantages of questionnaires to use in applied research and social policy development.
The survey provides each state with data that are representative of all new mothers in the state. For a sampling frame, the PRAMS relies on eligible birth certificates. Every month, researchers select a stratified sample of 100 to 250 new mothers in each participating state. Once the sample has been selected, the project is persistent in its efforts to reach the potential respondents. The sequence for PRAMS contact is as follows:
Pre-letter. This letter introduces the PRAMS to the sampled mother and informs her that a questionnaire will soon arrive.
Initial Mail Questionnaire Packet. This packet goes to all sampled mothers 3-7 days after the pre-letter. It contains a letter explaining how and why the mother was chosen and eliciting her cooperation. The letter provides instructions for completing the questionnaire, explains any incentive or reward provided, and includes a telephone number that she may call for additional information. The questionnaire booklet itself is 14 pages long, with an attractive cover and an extra page for the mother’s comments. A question-and-answer brochure contains additional information to help convince the mother to complete the questionnaire and a calendar to serve as a memory aid when answering the survey questions. Finally, the packet contains a participation incentive, such as coupons for birth certificates, a raffle for a cash award, postage stamps, bibs, or other inexpensive items.
Tickler. The tickler serves as a thank-you/reminder note and is sent 7-10 days after the initial mail packet.
Second Mail Questionnaire Packet. This packet is sent 7-14 days after the tickler to all sampled mothers who did not respond.
Third Mail Questionnaire Packet (Optional). This third packet goes to all remaining nonrespondents 7-14 days after the second questionnaire.
Telephone Follow-Up. Researchers initiate telephone follow-up for all nonrespondents 7-14 days after mailing the last questionnaire.
For 1997, the PRAMS reported survey response rates that ranged from a low of 69 percent for West Virginia to a high of 80 percent for Maine.
Because the PRAMS data are based on good samples that are drawn from the whole population, we can generalize findings from its data analyses to an entire state’s population of women having live births. The questionnaire consists of a core component and a state-specific component that can ask questions addressing the particular data needs of a state.
According to the CDC, findings from analysis of the PRAMS data have enhanced states’ understanding of maternal behaviors and experiences as well as their relationship with adverse pregnancy outcomes. Thus, these data are used to develop and assess programs and policies designed to reduce those outcomes. Some states have participated since 1987, and continuous data collection also permits states to monitor trends in key indicators over time. For example, one specific topic about which participants are queried is infant sleep position, because infants who sleep on their backs are less susceptible to Sudden Infant Death Syndrome. Analysis of the data from 1996 to 1997 indicated that 6 of the 10 participating states reported a significant decrease in the prevalence of the stomach (prone) sleeping position.
In addition to illustrating the principles of sound survey design in action, the PRAMS project demonstrates the value of survey research as a tool in applied research. Although the data the PRAMS generates certainly may be of use in expanding our knowledge of human behavior, its primary role is as a tool for informing social policy, identifying needs requiring intervention, and assessing progress toward meeting policy objectives. Readers who would like to learn more about this project should go to the CDC’s Division of Reproductive Health Web site (www.cdc.gov/reproductivehealth/DRH).
Second, mailed questionnaires enable the researcher to collect data from a geographically dispersed sample. It costs no more to mail a questionnaire across the country than it does to mail a questionnaire across the city. Costs of interviewer travel, however, rise enormously as the distance increases, making interviews over wide geographic areas an expensive process.
Third, with questions of a personal or sensitive nature, mailed questionnaires may provide more accurate answers than interviews. People may be more likely to respond honestly to such questions when they are not face to face with a person who they perceive as possibly making judgments about them. In practice, researchers may use a combination of questionnaires and interviews to address this problem. Written questions, or computer-assisted self-interviewing, has been proven to generate more accurate information (Newman et al. 2002). In addition, a self-administered questionnaire increased reporting of male-to-male sexual activity over standard interview procedures in the General Social Survey (Anderson and Stall 2002).
Finally, mailed questionnaires eliminate the problem of interviewer bias, which occurs when an interviewer influences a person’s response to a question by what he or she says, his or her tone of voice, or his or her demeanor. Because no interviewer is present when the respondent fills out the questionnaire, an interviewer cannot bias the answers to a questionnaire in any particular direction (Cannell and Kahn 1968).
DisadvantagesDespite their many advantages, mailed questionnaires have important limitations that may make them less desirable for some research efforts (Moser and Kalton 1972). First, mailed questionnaires require a minimal degree of literacy and facility in English, which some respondents may not possess. Substantial nonresponse is, of course, likely with such people. Nonresponse because of illiteracy, however, does not seriously bias the results of most general-population surveys. Self-administered questionnaires are more successful among people who are better educated, motivated to respond, and involved in issues and organizations. Often, however, some groups of interest to human service practitioners do not possess these characteristics. If the survey is aimed at a special population in which the researcher suspects lower-than-average literacy, personal interviews are a better choice.
Second, all the questions must be sufficiently easy to comprehend on the basis of printed instructions. Third, there is no opportunity to probe for more information or to evaluate the nonverbal behavior of the respondents. The answers they mark on the questionnaire are final. Fourth, the researcher has no assurance that the person who should answer the questionnaire is the one who actually does. Fifth, the researcher cannot consider responses to be independent, because the respondent can read through the entire questionnaire before completing it. Finally, all mailed questionnaires face the problem of nonresponse bias.
InterviewsDuring an interview, the investigator or an assistant reads the questions directly to the respondents and then records their answers. Interviews offer the investigator a degree of flexibility that is not available with questionnaires. One area of increased flexibility relates to the degree of structure built into an interview.
The Structure of InterviewsThe element of structure in interviews refers to the degree of freedom that the interviewer has in conducting the interview and that respondents have in answering questions. We classify interviews in terms of three levels of structure: (1) unstandardized, (2) nonschedule-standardized, and (3) schedule-standardized.
The unstandardized interview has the least structure. All the interviewer typically has for guidance is a general topic area, as illustrated in Figure 7.1. By developing his or her own questions and probes as the interview progresses, the interviewer explores the topic with the respondent. The approach is called “unstandardized” because each interviewer asks different questions and obtains different information from each respondent. There is heavy reliance on the skills of the interviewer to ask good questions and to keep the interview going; this can only be done if experienced interviewers are available. This unstructured approach makes unstandardized interviewing especially appropriate for exploratory research. In Figure 7.1, for example, only the general topic of parent—child conflicts guides the interviewer. The example also illustrates the suitability of this style of interviewing for exploratory research, where the interviewer is directed to search for as many areas of conflict as can be found.
Figure 7.1 Examples of Various Interviewer Structures
| The Unstandardized Interview | |||||
| Instructions to the interviewer: Discover the kinds of conflicts that the child has had with the parents. Conflicts should include disagreements, tensions due to past, present, or potential disagreements, outright arguments and physical conflicts. Be alert for as many categories and examples of conflicts and tensions as possible. | |||||
| The Nonschedule-Standardized Interview | |||||
| Instructions to the interviewer: Your task is to discover as many specific kinds of conflicts and tensions between child and parent as possible. The more concrete and detailed the account of each type of conflict the better. Although there are 12 areas of possible conflict which we want to explore (listed in question 3 below), you should not mention any area until after you have asked the first two questions in the order indicated. The first question takes an indirect approach, giving you time to build up a rapport with the respondent and to demonstrate a nonjudgmental attitude toward teenagers who have conflicts with their parents.
(Possible probes: Do they always agree with their parents? Do any of your friends have “problem parents”? What other kinds of disagreements do they have?)
(Possible probes: Do they cause you any problems? In what ways do they try to restrict you? Do you always agree with them on everything? Do they like the same things you do? Do they try to get you to do some things you don’t like? Do they ever bore you? Make you mad? Do they understand you? etc.)
| |||||
| The Schedule-Standardized Interview | |||||
| Interviewer’s explanation to the teenage respondent: We are interested in the kinds of problems teenagers have with their parents. We need to know how many teenagers have which kinds of conflicts with their parents and whether they are just mild disagreements or serious fights. We have a checklist here of some of the kinds of things that happen. Would you think about your own situation and put a check to show which conflicts you, personally, have had and about how often they have happened? Be sure to put a check in every row. If you have never had such a conflict then put the check in the first column where it says “never.” | |||||
| (Hand him the first card dealing with conflicts over the use of the automobile, saying, “If you don’t understand any of those things listed or have some other things you would like to mention about how you disagree with your parents over the automobile let me know and we’ll talk about it.”) (When the respondent finishes checking all rows, hand him card number 2, saying, “Here is a list of types of conflicts teenagers have with their parents over their friends of the same sex. Do the same with this as you did the last list.”) | |||||
| Automobile | Never | Only Once | More Than Once | Many Times | |
| 1. | Wanting to learn to drive |
|
|
|
|
| 2. | Getting a driver’s license |
|
|
|
|
| 3. | Wanting to use the family car |
|
|
|
|
| 4. | What you use the car for |
|
|
|
|
| 5. | The way you drive it |
|
|
|
|
| 6. | Using it too much |
|
|
|
|
| 7. | Keeping the car clean |
|
|
|
|
| 8. | Putting gas or oil in the car |
|
|
|
|
| 9. | Repairing the car |
|
|
|
|
| 10. | Driving someone else’s car |
|
|
|
|
| 11. | Wanting to own a car |
|
|
|
|
| 12. | The way you drive your own car |
|
|
|
|
| 13. | What you use your car for |
|
|
|
|
| 14. | Other |
|
|
|
|
SOURCE: From Raymond L. Gorden, Interviewing: Strategy, Techniques, and Tactics, 4th ed. Copyright © 1987 by the Dorsey Press. Reprinted by permission of the estate of Raymond Gorden.
Nonschedule-standardized interviews add more structure, with a narrower topic and specific questions asked of all respondents. The interview, however, remains fairly conversational; the interviewer is free to probe, to rephrase questions, or to ask the questions in whatever order best fits that particular interview. Note in Figure 7.1 that specific questions are of the open-ended type, allowing the respondent full freedom of expression. As in the case of the unstandardized form, success with this type of interview requires an experienced interviewer.
The schedule-standardized interview is the most structured type. An interview schedule contains specific instructions for the interviewer, specific questions to be asked in a fixed order, and transition phrases for the interviewer to use. Sometimes, the schedule also contains acceptable rephrasings for questions and a selection of stock probes. Schedule-standardized interviews are fairly rigid, with neither interviewer nor respondent allowed to depart from the structure of the schedule. Although some questions may be open-ended, most are closed-ended. In fact, some schedule-standardized interviews are quite similar to a questionnaire, except that the interviewer asks the questions rather than having the respondent read them. In Figure 7.1, note the use of cards with response alternatives handed to the respondent. This is a popular way of supplying respondents with a complex set of closed-ended alternatives. Note also the precise directions for the interviewer as well as verbatim phrases to read to the respondent. Relatively untrained, part-time interviewers can conduct schedule-standardized interviews, because the schedule contains nearly everything they need to say. This makes schedule-standardized interviews the preferred choice for studies with large sample sizes and many interviewers. The structure of these interviews also ensures that all respondents receive the same questions in the same order. This heightens reliability and makes schedule-standardized interviews popular for rigorous hypothesis testing. Research in Practice 7.2 explores some further advantages of having more or less structure in an interview.
Contacting RespondentsAs with researchers who mail questionnaires, those who rely on interviewers face the problem of contacting respondents and eliciting their cooperation. Many interviews are conducted in the homes of the respondents; locating and traveling to respondents’ homes are two of the more troublesome—and costly—aspects of interviewing. It has been estimated that as much as 40 percent of a typical interviewer’s time is spent traveling (Sudman 1965). Because so much time and cost are involved, and because researchers desire high response rates, they direct substantial efforts at minimizing the rate of refusal. The first contact of prospective respondents has a substantial impact on the refusal rate.
Research in Practice 7.2: Needs Assessment: Merging Quantitative and Qualitative Measures
That survey research is necessarily quantitative in nature probably is a common misconception. Virtually every edition of the evening news presents the results from one or more surveys, indicating that a certain percentage of respondents hold a given opinion or plan to vote for a particular candidate, or offers other information that is basically quantitative or reduced to numbers. However, survey research is not limited to quantitative analysis. In fact, as we noted in the discussion of Figure 7.1, interviews run the gamut from totally quantitative in the highly structured type to fully qualitative in the least structured variety—as well as any combination in between. Some researchers combine both quantitative and qualitative measures in individual studies to obtain the benefits of each approach.
Two studies of homeless families headed by females illustrate such a merging of interview styles. Shirley Thrasher and Carol Mowbray (1995) interviewed 15 homeless families from three shelters, focusing primarily on the experiences of the mothers and their efforts to take care of their children. Elizabeth Timberlake (1994) based her study on interviews with 200 families not in shelters and focused predominantly on the experiences of the homeless children. In both studies, the researchers used structured interview questions to provide quantitative demographic information about the homeless families, such as their race/ethnicity, length of homelessness, and employment status.
As important as this quantitative information might be, the researchers in both studies wanted to get at the more personal meaning of—and feelings about—being homeless. For this, they turned to the unstructured parts of the interviews (sometimes called ethnographic interviews), which were designed to get the subjects to tell their stories in their own words. The goal of both studies was to assess the needs of the homeless families either to develop new programs to assist them or to modify existing programs to better fit their needs. The researchers felt that the best way to accomplish this goal was to get the story of being homeless, in as pure a form as possible, from the people who lived it, and without any distortion by the researchers’ preconceived notions. The open-ended questions that Timberlake asked the homeless children illustrate this unstructured approach: “Tell me about not having a place to live.” “What is it like?” “What do you do?” “How do you feel?” “How do you handle being homeless?” “Are there things that you do or say?” The questions that Thrasher and Mowbray asked the homeless mothers were similar. Both studies used probes as needed to elicit greater response and to clarify vague responses.
An example from Thrasher and Mowbray illustrates how responses to open-ended questions provide insight into what the respondent is experiencing. Those researchers found that a common experience of the women in the shelters was that, before coming to the shelter, they had bounced around among friends and relatives, experiencing a series of short-term and unstable living arrangements. The researchers present the following quote from 19-year-old “Nancy”:
I went from friend to friend before going back to my mother and her boyfriend. And all my friends they live with their parents, and so you know, I could only stay like a night, maybe two nights before I had to leave. So, the only thing I could do was to come here to the shelter and so that’s what I did. After all, there is only so many friends. I went to live once with my grandmother for a week who lives in a senior citizens’ high rise. But they don’t allow anyone to stay there longer than a week as a visitor. So, I had to move on. I finally went to my social worker and told her I don’t have any place to stay. She put me in a motel first because there was no opening in the shelter. Then I came here.
As this example illustrates, there is no substitute for hearing the plight of these people in their own words to help those who are not homeless gain some understanding of what it is like not to have a stable place to call home.
In part because of her much larger sample, Timberlake did not tape-record her interviews and so made no verbatim transcripts. Instead, she took field notes that summarized the responses of the homeless children. This resulted in a different approach to analysis, because she did not have the long narratives that Thrasher and Mowbray had. Instead, she had a large number of summarized statements from her notes. She ended up doing a more quantitative analysis by categorizing the respondents’ statements into more abstract categories. Timberlake found that the responses clustered around three themes: separation/loss, care-taking/nurturance, and security/protection. Within each theme were statements along two dimensions, which Timberlake refers to as “deprivation” and “restoration,” respectively—the negative statements about what is bad about being homeless, and the positive statements about what the children still have and how they cope. So, children’s statements such as “we got no food” and “Daddy left us” were categorized as reflecting deprivation related to caretaking/nurturance. “Mama stays with us” and “I still got my clothes” were seen to reflect restoration related to separation/loss. Timberlake tabulated the number of each kind of statement. It seems rather indicative of the devastation of homelessness on the children that Timberlake found approximately three times as many deprivation statements as she did restoration statements. It is important to note that these categories and themes were not used by the respondents themselves but were created by Timberlake in an effort to extract some abstract or theoretical meaning from the narratives.
Neither of these studies used an interview format that would be suitable for interviewing a large, randomly selected sample of homeless people with the purpose of estimating the demographic characteristics of the entire homeless population. Imagine trying to organize and summarize data from several thousand interviews like those conducted by Thrasher and Mowbray! To reasonably accomplish such a population estimate, a schedule-standardized interview format, producing quantitative data, is far more appropriate. If the goal of the research project is to gain an understanding of the personal experiences and reactions to being homeless, however, as in the two studies just discussed, then presenting results in the respondents’ own words is more effective. However, if researchers wanted to design a schedule-standardized survey project to do a population description of the homeless, studies such as the two discussed here would be invaluable for determining what concepts to measure and for developing the quantitative indicators that such a study would demand.
These two studies illustrate that both qualitative and quantitative approaches are essential to social research. Which approach is most appropriate in a given situation depends on the particular goals of the research; in some cases, a blend of both quantitative and qualitative approaches in the same project obtains the desired results.
Two approaches to contacting respondents that might appear logical to the neophyte researcher have, in fact, an effect opposite of that desired. It might seem that telephoning to set up an appointment for the interview is a good idea. In reality, telephoning greatly increases the rate of refusal. In one experiment, for example, the part of the sample that was telephoned had nearly triple the rate of refusal of those who were contacted in person (Brunner and Carroll 1967). Apparently, it is much easier to refuse over the relatively impersonal medium of the telephone than in a face-to-face encounter with an interviewer. Sending people a letter asking them to participate in an interview has much the same effect (Cartwright and Tucker 1967). The letter seems to give people sufficient time before the interviewer arrives to develop reasons why they do not want to cooperate. Those first contacted in person, on the other hand, have only those excuses they can muster on the spur of the moment. Clearly, then, interviewers obtain the lowest refusal rates by contacting interviewees in person.
Additional factors also can affect the refusal rate (Gorden 1987). For example, information regarding the research project should blanket the total survey population through the news media to demonstrate general community acceptance of the project. With a few differences, information provided to the media should contain essentially the same information as provided in a cover letter for a mailed questionnaire (see Table 7.3). Pictures of the interviewers and mention of any equipment they carry, such as laptop computers or video or audio recording devices, should be included. This information assists people in identifying interviewers and reduces possible confusion of interviewers with salespeople or solicitors. In fact, it is a good idea to equip the interviewers with identification badges or something else that is easily recognizable so that they are not mistaken for others who go door to door. When the interviewers go into the field, they should take along copies of the news coverage as well. Then, if they encounter a respondent who has not seen the media coverage, they can show the clippings during the initial contact.
The timing of the initial contact also affects the refusal rate. It is preferable to contact interviewees at a time that is convenient for them to complete the interview without the need for a second call. Depending on the nature of the sample, predicting availability may be fairly easy or virtually impossible. For example, if interviewers can obtain the information that is required from any household member, then almost any reasonable time of day will do. On the other hand, if the interviewer must contact specific individuals, then timing becomes more critical. If we must interview the breadwinner in a household, for example, then we probably should make the contacts at night or on weekends (unless knowledge of the person’s occupation suggests a different time of greater availability). Whatever time the interviewer makes the initial contact, however, it still may not be convenient for the respondent, especially if the interview is lengthy. If the respondent is pressed for time, use the initial contact to establish rapport, and set another time for the interview. Even though callbacks are costly, this is certainly preferable to the rushed interview that results in inferior data.
When the interviewer and potential respondent first meet, the interviewer should include certain points of information in the introduction. One suggestion is the following (Smith 1981):
Good day. I am from the Public Opinion Survey Unit of the University of Missouri (shows official identification). We are doing a survey at this time on how people feel about police-community relationships. This study is being done throughout the state, and the results will be used by local and state governments. The addresses at which we interview are chosen entirely by chance, and the interview only takes 45 minutes. All information is entirely confidential, of course.
Respondents will be looking for much the same basic information about the survey as they do with mailed questionnaires. As the preceding example illustrates, interviewers also should inform respondents of the approximate length of the interview. After the introduction, the interviewer should be prepared to elaborate on any points the interviewee questions. To avoid biasing responses, however, the interviewer must exercise care when discussing the purpose of the survey.
Conducting an InterviewA large-scale survey with an adequate budget often turns to private research agencies to train interviewers and conduct interviews. Often, however, smaller research projects cannot afford this and have to train and coordinate their own team of interviewers, possibly with the researchers themselves doing some of the interviewing. It is important, therefore, to know how to conduct an interview properly.
The Interview as a Social RelationshipThe interview is a social relationship designed to exchange information between the respondent and the interviewer. The quantity and quality of information exchanged depend on how astute and creative the interviewer is at understanding and managing that relationship (Fowler and Mangione 1990; Holstein and Gubrium 2003). Human service workers generally are knowledgeable regarding the properties and processes of social interaction; in fact, much human service practice is founded on the establishment of social relationships with clients. A few elements of the research interview, however, are worth emphasizing, because they have direct implications for conducting interviews.
A research interview is a secondary relationship in which the interviewer has a practical, utilitarian goal. It is easy, especially for an inexperienced interviewer, to be drawn into a more casual or personal interchange with the respondent. Especially with a friendly, outgoing respondent, the conversation might drift off to topics like sports, politics, or children. That, however, is not the purpose of the interview. The goal is not to make friends or to give the respondent a sympathetic ear but, rather, to collect complete and unbiased data following the interview schedule.
We all recognize the powerful impact that first impressions have on perceptions. This is especially true during interview situations, in which the interviewer and the respondent are likely to be total strangers. The first impressions that affect a respondent are the physical and social characteristics of the interviewer. So, we need to take considerable care to ensure that the first contact enhances the likelihood of the respondent’s cooperation (Warwick and Lininger 1975). Most research suggests that interviewers are more successful if they have social characteristics similar to those of their respondents. Thus, such characteristics as socioeconomic status, age, sex, race, and ethnicity might influence the success of the interview—especially if the subject matter of the interview relates to one of these topics. In addition, the personal demeanor of the interviewer plays an important role; interviewers should be neat, clean, and businesslike but friendly.
After exchanging initial pleasantries, the interviewer should begin the interview. The respondent may be a bit apprehensive during the initial stages of an interview. In recognition of this, the interview should begin with fairly simple, nonthreatening questions. A schedule, if used, should begin with these kinds of questions. The demographic questions, which are reserved until the later stages of a mailed questionnaire, are good to begin an interview. The familiarity of respondents with this information makes these questions nonthreatening and a good means of reducing tension in the respondent.
ProbesIf an interview schedule is used, then the interview progresses in accordance with it. As needed, the interviewer uses probes, or follow-up questions, intended to elicit clearer and more complete responses. In some cases, the interview schedule contains suggestions for probes. In less-structured interviews, however, interviewers must develop and use their own probes. These probes can take the form of a pause in conversation that encourages the respondent to elaborate or an explicit request to clarify or elaborate on something. A major concern with any probe is that it not bias the respondent’s answer by suggesting the answer (Fowler and Mangione 1990).
Recording ResponsesA central task of interviewers, of course, is to record the responses of respondents. The four most common ways are classifying responses into predetermined categories, summarizing key points, taking verbatim notes (by hand writing or with a laptop computer), or making an audio or video recording of the interview.
Recording responses generally is easiest when we use an interview schedule. Because closed-ended questions are typical of such schedules, we can simply classify responses into the predetermined alternatives. This simplicity of recording is another factor making schedule-standardized interviews suitable for use with relatively untrained interviewers, because no special recording skills are required.
With nonschedule-standardized interviewing, the questions are likely to be open-ended and the responses longer. Often, all we need to record are the key points the respondent makes. The interviewer condenses and summarizes what the respondent says. This requires an experienced interviewer who is familiar with the research questions who can accurately identify what to record and then do so without injecting his or her own interpretation, which would bias the summary.
Sometimes, we may want to record everything the respondent says verbatim to avoid the possible biasing effect of summarizing responses. If the anticipated responses are reasonably short, then competent interviewers can take verbatim notes. Special skills, such as shorthand, may be necessary. If the responses are lengthy, then verbatim note taking can cause difficulties, such as leading the interviewer to fail to monitor the respondent or to be unprepared to probe when necessary. It also can damage rapport by making it appear that the interviewer is ignoring the respondent. Making audio or video recordings of the interviews can eliminate problems such as this but also can increase the costs substantially, both for the equipment and for later transcription of the materials (Gorden 1987). Such recordings, however, also provide the most accurate account of the interview.
The fear some researchers have that tape recorders increase the refusal rate appears to be unwarranted (Gorden 1987). If the recorder is explained as a routine procedure that aids in capturing complete and accurate responses, few respondents object.
Controlling InterviewersOnce interviewers go into the field, the quality of the resulting data depends heavily on them. It is a naive researcher, indeed, who assumes that, without supervision, they will all do their job properly, especially when part-time interviewers who have little commitment to the research project are used. Proper supervision begins during interviewer training by stressing the importance of contacting the right respondents and meticulously following established procedures.
Although sloppy, careless work is one concern, a more serious issue is interviewer falsification, or the intentional departure from the designed interviewer instructions, unreported by the interviewer, which can result in the contamination of data (American Association for Public Opinion Research Standards Committee 2003). A dramatic illustration of this was discovered in a National Institutes of Health (NIH) survey of AIDS and other sexually transmitted diseases (Marshall 2000). Eleven months into the study, a data-collection manager was troubled by the apparent overproductivity of one interviewer. A closer look revealed that, although the worker was submitting completed interviews, some were clearly falsified. For example, the address of one interview site turned out to be an abandoned house. The worker was dismissed, and others came under suspicion. It took months to root out what was referred to as an “epidemic of falsification” on this research project. A cessation of random quality checks was identified as a major contributing factor to the problem.
Falsified data is believed to be rare, but survey organizations take this problem seriously and follow established procedures to address it. Factors that contribute to falsification include pressure on interviewers to obtain very high response rates and the use of long, complicated questionnaires that may frustrate both interviewer and respondent. The problem can be prevented by careful recruitment, screening, and training of interviewers; by recognizing incentives for falsification created by work quotas and pay structures; and by monitoring and verifying interviewer work (Bushery et al. 1999).
Minorities and the Interview RelationshipMany respondents in surveys have different characteristics than those of the interviewers. Does it make a difference in terms of the quantity or quality of data collected in surveys when the interviewer and the interviewee have different characteristics? It appears that it does. In survey research, three elements interact to affect the quality of the data collected: (1) minority status of the interviewer, (2) minority status of the respondent, and (3) minority content of the survey instrument. Researchers should carefully consider the interrelationships among these elements to ensure that the least amount of bias enters the data-collection process.
As we have emphasized, an interview is a social relationship in which the interviewer and the respondent have cultural and subcultural expectations for appropriate behavior. One set of expectations that comes into play is the social desirability of respondents’ answers to questions. Substantial research documents a tendency for people to choose more desirable or socially acceptable answers to questions in surveys (DeMaio 1984; Holstein and Gubrium 2003), in part from the desire to appear sensible, reasonable, and pleasant to the interviewer. In all interpersonal contacts, including an interview relationship, people typically prefer to please someone rather than to offend or alienate. For cases in which the interviewer and the respondent are from different racial, ethnic, or sexual groups, respondents tend to give answers that they perceive to be more desirable—or, at least, less offensive—to the interviewer; this is especially true when the questions are related to racial, ethnic, or sexual issues. A second set of expectations that comes into play and affects responses during interviews is the social distance between the interviewer and the respondent, or how much they differ from each other on important social dimensions, such as age or minority status. Generally, the less social distance between people, the more freely, openly, and honestly they will talk. Racial, sexual, and ethnic differences often indicate a degree of social distance.
The impact of cross-race interviewing has been studied extensively with African-American and white respondents (Anderson, Silver, and Abramson 1988; Bachman and O’Malley 1984; Bradburn and Sudman 1979; Dailey and Claus 2001). African-American respondents, for example, express more warmth and closeness for whites when interviewed by a white person and are less likely to express dissatisfaction or resentment over discrimination or inequities against African Americans. White respondents tend to express more pro-black attitudes when the interviewer is African American. This race-of-interviewer effect can be quite large, and it occurs fairly consistently. Some research concludes that it plays a role mostly when the questions involve race or other sensitive topics, but recent research suggests that its effect is more pervasive, affecting people’s responses to many questions on a survey, not just the racial or sensitive questions (Davis 1997).
Fewer researchers have studied the impact of ethnicity on interviews, probably because in most cases, the ethnicity of both the interviewer and the respondent is not as readily apparent as is race, which is visibly signified by skin color. In one study, both Jewish and non-Jewish interviewers asked questions about the extent of Jewish influence in the United States (Hyman 1954). Respondents were much more willing to say that Jews had too much influence when they were being interviewed by a non-Jew.
Gender has an effect on interviews as well. Women are much more likely to report honestly about such topics as rape, battering, sexual behavior, and male—female relationships in general when women interview them instead of men (Eichler 1988; Reinharz 1992). In a study of sexual behaviors with Latino couples, men reported fewer sexual partners and were less likely to report sex with strangers when they were interviewed by women than when they were interviewed by other men; male respondents also were more likely to report sex with prostitutes or other men to older interviewers than to younger interviewers. Women were less likely to report oral sex to older interviewers (Wilson et al. 2002).
Some researchers recommend routinely matching interviewer and respondent for race, ethnicity, or gender in interviews on racial or sensitive topics, and this generally is sound advice. Sometimes, however, a little more thought is called for. The problem is that we are not always sure in which direction bias might occur. If white respondents give different answers to white as opposed to black interviewers, which of their answers most accurately reflect their attitudes? For the most part, we aren’t sure. We generally assume that same-race interviewers gather more accurate data (Fowler and Mangione 1990). A more conservative assumption, however, is that the truth falls somewhere between the data that the two interviewers of different race collect.
When minorities speak a language different from that of the dominant group, conducting the interview in the dominant group’s language can affect the quality of data collected (Marin and VanOss Marin 1991). For example, a study of Native-American children in Canada found that these children expressed a strong white bias in racial preferences when the study was conducted in English; however, this bias declined significantly when interviewers used the children’s native Ojibwa language (Annis and Corenblum 1986). This impact of language should not be surprising, considering that language is not just a mechanism for communication but also reflects cultural values, norms, and a way of life. So, when interviewing groups in which a language other than English is widely used, it is appropriate to consider conducting the interviews in that other language.
An Assessment of Interviews AdvantagesPersonal interviews have several advantages compared with other data-collection techniques. First, interviews can help motivate respondents to give more accurate and complete information. Respondents have little motivation to be accurate or complete when responding to a mailed questionnaire; they can hurry through it if they want to. The control that an interviewer affords, however, encourages better responses, which is especially important as the information sought becomes more complex.
Second, interviewing offers an opportunity to explain questions that respondents may not otherwise understand. Again, if the information being sought is complex, then this can be of great importance, and interviews virtually eliminate the literacy problem that may accompany mailed questionnaires. Even lack of facility in English can be handled with multilingual interviewers. (When we conducted a needs assessment survey in some rural parts of Michigan’s Upper Peninsula several years ago, we employed one interviewer who was fluent in Finnish, because a number of people in the area spoke Finnish but little or no English.)
Third, the presence of an interviewer allows control over factors that are uncontrollable with mailed questionnaires. For example, the interviewer can ensure not only that the proper person responds to the questions but also that he or she does so in sequence. Furthermore, the interviewer can arrange to conduct the interview so that the respondent does not consult with and is not influenced by other people before responding.
Fourth, interviewing is a more flexible form of data collection than questionnaires. The style of interviewing can be tailored to the needs of the study. A free, conversational style, with much probing, can be adopted in an exploratory study. In a more developed study, a highly structured approach can be used. This flexibility makes interviewing suitable for a far broader range of research situations compared with mailed questionnaires.
Finally, the interviewer can add observational information to the responses. What was the respondent’s attitude toward the interview? Was he or she cooperative? Indifferent? Hostile? Did the respondent appear to fabricate answers? Did he or she react emotionally to some questions? This additional information helps us better evaluate the responses, especially when the subject matter is highly personal or controversial (Gorden 1987).
DisadvantagesSome disadvantages associated with personal interviews may lead the researcher to choose another data-collection technique. The first disadvantage is cost. Researchers must hire, train, and equip interviewers and also pay for their travel. All these expenses are costly.
The second limitation is time. Traveling to respondents’ homes requires a lot of time and limits each interviewer to only a few interviews each day. In addition, to contact particular individuals, an interviewer may require several time-consuming callbacks. Project start-up operations, such as developing questions, designing schedules, and training interviewers, also require considerable time.
A third limitation of interviews is the problem of interviewer bias. Especially in unstructured interviews, the interviewers may misinterpret or misrecord something because of their personal feelings about the topic. Furthermore, just as the interviewer’s characteristics affect the respondent, so the characteristics of the respondent similarly affect the interviewer. Sex, age, race, social class, and a host of other factors may subtly shape the way in which the interviewer asks questions and interprets the respondent’s answers.
A fourth limitation of interviews, especially less structured interviews, is the possibility of significant but unnoticed variation in wording either from one interview to the next or from one interviewer to the next. We know that variations in wording can produce variations in response, and the more freedom that interviewers have in this regard, the more of a problem this is. Wording variation can affect both reliability and validity (see Chapter 5).
Telephone SurveysFace-to-face interviews tend to be a considerably more expensive means of gathering data than either mailed questionnaires or telephone surveys (Rea and Parker 2005). As Table 7.4 shows, face-to-face interviews can be more than twice as expensive as phone or mail surveys. The table shows that face-to-face interviews incur substantially higher costs for locating residences, contacting respondents, conducting interviews, traveling, and training interviewers. Mail or telephone surveys require no travel time, fewer interviewers, and fewer supervisory personnel. Although telephone charges are higher in telephone surveys, these costs are far outweighed by other savings. The cost advantages of the less-expensive types of surveys make feasible much research that otherwise would be prohibitively expensive.
Table 7.4 Cost Comparison of Telephone, Mail, and Face-to-Face Surveys, with a Sample Size of 520
| A. Mail Survey | Total Cost (dollars) | ||
| Prepare for survey |
| ||
|
| Purchase sample list in machine-readable form | 375 | |
| Load database of names and addresses | 17 | ||
| Graphic design for questionnaire cover (hire out) | 100 | ||
| Print questionnaires: 4 sheets, legal-size, folded, 1,350 @ $.15 each (includes paper) (hire out) | 203 | ||
| Telephone | 100 | ||
| Supplies |
| ||
|
| Mail-out envelopes, 2,310 @ $.05 each, with return address | 116 | |
|
| Return envelopes, 1,350 @ $.05 each, pre-addressed but no return address | 68 | |
|
| Letterhead for cover letters, 2,310 @ $.05 each | 116 | |
|
|
| Miscellaneous | 200 |
| First mail-out (960) |
| ||
|
| Print advance-notice letter | 25 | |
|
| Address envelopes | 25 | |
|
| Sign letters, stamp envelopes | 50 | |
|
| Postage for mail-out, 960 @ $.34 each | 326 | |
|
| Prepare mail-out packets | 134 | |
| Second mail-out (960) |
| ||
|
| Print cover letter | 25 | |
|
| Address envelopes | 25 | |
|
| Postage for mail-out, 960 @ $.55 each | 528 | |
| Postage for return envelopes, 960 @ $.55 each | 528 | ||
|
| Sign letters, stamp envelopes | 100 | |
|
| Prepare mail-out packets | 118 | |
| Third mail-out (960) |
| ||
|
| Pre-stamped postcards, 4 bunches of 250 @ $.20 each | 200 | |
|
| Address postcards | 25 | |
|
| Print message and sign postcards | 50 | |
|
| Process, precode, edit 390 returned questionnaires, 10 min each | 545 | |
| Fourth mail-out (475) |
| ||
|
| Print cover letter | 25 | |
|
| Address envelopes | 25 | |
|
| Sign letters, stamp envelopes | 25 | |
|
| Prepare mail-out packets | 168 | |
|
| Postage for mail-out, 475 @ $.55 each | 261 | |
|
| Postage for return envelopes, 475 @ $.55 each | 261 | |
|
| Process, precode, edit 185 returned questionnaires, 10 min each | 250 | |
| Total, excluding professional time | 5,025 | ||
| Professional time (120 hrs @ $35,000 annual salary plus 20% fringe benefits) | 2,423 | ||
| Total, including professional time | 7,418 | ||
| B. Telephone Survey | Total Cost (dollars) | ||
| Prepare for survey |
| ||
| Use add-a-digit calling based on systematic, random sampling from directory | 84 | ||
|
| Print interviewer manuals | 37 | |
|
| Print questionnaires (940) | 84 | |
|
| Train interviewers (12-hour training session) | 700 | |
|
| Miscellaneous supplies | 25 | |
| Conduct the survey |
| ||
|
| Contact and interview respondents; edit questionnaires; 50 minutes per completed questionnaire | 2,786 | |
|
| Telephone charges | 3,203 | |
| Total, excluding professional time | 6,919 | ||
| Professional time (120 hrs @ $35,000 annual salary plus 20% fringe benefits) | 2,423 | ||
| Total, including professional time | 9,342 | ||
| C. Face-to-Face Survey | Total Cost (dollars) | ||
| Prepare for survey |
| ||
|
| Purchase map for area frame | 200 | |
|
| Print interviewer manuals | 29 | |
|
| Print questionnaires (690) | 379 | |
|
| Train interviewers (20-hour training session) | 1,134 | |
|
| Miscellaneous supplies | 25 | |
| Conduct the survey |
| ||
|
| Locate residences; contact respondents; conduct interviews; field-edit questionnaires; 3.5 completed interviews per 8-hour day | 9,555 | |
| Travel cost ($8.50 per completed interview; interviewers use own car) | 4,420 | ||
| Office edit and general clerical (6 completed questionnaires per hour) | 728 | ||
| Total, excluding professional time | 16,570 | ||
| Professional time (160 hrs @ $35,000 annual salary plus 20% fringe benefits) | 3,231 | ||
| Total, including professional time | 19,801 | ||
SOURCE: Adapted from Priscilla Salant and Don A. Dillman, How to Conduct Your Own Survey, pp. 46-49. Copyright © 1994 by John Wiley & Sons, Inc. Reproduced with permission of John Wiley & Sons, Inc.
The speed with which a telephone survey can be completed also makes it preferable at times. If we want people’s reactions to a particular event, for example, or repeated measures of public opinion, which can change rapidly, then the speed of telephone surveys makes them preferable in these circumstances.
Certain areas of the country and many major cities contain substantial numbers of non—English speaking people. These people are difficult to accommodate with mailed questionnaires and personal interviews unless we know ahead of time what language a respondent speaks. We can handle non—English speaking people fairly easily, however, with telephone surveys. All we need are a few multilingual interviewers. (Spanish speakers account for the vast majority of non—English speaking people in the United States.) If an interviewer contacts a non—English speaking respondent, then he or she can simply transfer that respondent to an interviewer who is conversant in the respondent’s language. Although multilingual interviewers can be—and are—used in personal interviews, this process is far less efficient, probably involving at least one callback to arrange for an interviewer with the needed language facility. A final advantage of telephone interviews is that supervision is much easier. The problem of interviewer falsification is eliminated, because supervisors can monitor the interviews at any time. This makes it easy to ensure that specified procedures are followed and any problems that might arise are quickly discovered and corrected.
Despite these considerable advantages, telephone surveys have several limitations that may make the method unsuitable for many research purposes. First, telephone surveys must be quite short in duration. Normally, the maximum length is about 20 minutes, and most are even shorter. This is in sharp contrast to personal interviews, which can last for an hour or longer. The time limitation obviously restricts the volume of information that interviewers can obtain and the depth to which they can explore issues. Telephone surveys work best when the information desired is fairly simple and the questions are uncomplicated.
A second limitation stems from the fact that telephone communication is only voice to voice. Lack of visual contact eliminates several desirable characteristics of personal interviews. The interviewer cannot supplement responses with observational information, for example, and it is harder for an interviewer to probe effectively without seeing the respondent. Furthermore, a phone interview precludes the use of cards with response alternatives or other visual stimuli. The inability to present complex sets of response alternatives in this format can make it difficult to ask some questions that are important.
Finally, as we noted in Chapter 6, surveys based on samples drawn from listings of telephone numbers may have considerable noncoverage, because some people do not have telephones at all, others have unlisted numbers, and still others have cell phones, which may have unlisted numbers and are not linked to specific geographic locations, such as a household. In addition, some people today have both a cell phone (sometimes more than one) and a landline; this means that, even with random-digit dialing, people with multiple phones have a greater likelihood of being selected for a sample than people with only one phone (or no phone) do. Although modern telephone sampling techniques, such as random-digit dialing, eliminate some problems, sampling bias remains a potential problem when using telephone numbers as a sampling frame. Because some human service clients are heavily concentrated in the population groups that are more likely to be missed in a telephone sample, we should exercise special care when using a telephone survey. The Eye on Ethics section discusses some ethical considerations that arise when surveying people on their cell phones.
Computer-mediated communications technologies now assist survey research through computer-assisted interviewing (CAI), or using computer technology to assist in designing and conducting questionnaires and interviews. One important form this takes is computer-assisted telephone interviewing (CATI), where an interview is conducted over the telephone: In CATI, the interviewer reads questions from a computer monitor instead of a clipboard and records responses directly into the computer via the keyboard instead of a paper form. Superficially, CATI replaces the paper-and-pencil format of interviewing with a monitor-and-keyboard arrangement, but the differences are much more significant. Some of the special techniques possible with CATI include personalizing the wording of questions based on answers to previous questions and automatic branching for contingency questions. These features speed up the interview and improve accuracy. CATI software enters the data from respondents directly into a data file for analysis. CATI programs help prevent errors from entering the data during the collection phase. For example, with a question that requires numerical data, such as “How old are you?,” the program can require that only numerical characters be entered. Range checks also catch errors. Assuming one is interviewing adults, the age range might be set to 18–99 years. Any response outside that range would result in an error message or a request to recheck the entry.
Online SurveysThe emergence of the Internet has led to the growth of surveys conducted online rather than in person, through the mail, or by telephone. “Internet surveys,” or “Web surveys,” sometimes are sent as e-mail or an e-mail attachment or are made available at a Web site. Online surveys are similar to other surveys in many respects, in that the basic data still involves people’s answers to questions. The differences, however, are sufficiently important that they need to be discussed.
Eye on Ethics: Ethical Use of Cell Phones in Survey Research
New technologies create new challenges for researchers, sometimes in terms of conducting ethical research. In Chapter 6, we discussed the implications of cell phones for sampling in survey research. These new technologies also introduce some important ethical considerations to be addressed by researchers who contact survey respondents on the respondent’s cell phone (Lavrakas et al. 2007). First, people sometimes answer their cell phones when they are engaging in actions that are made more difficult or dangerous by talking on the phone, such as driving a car or operating harmful machinery. In some localities, talking on a cell phone while driving is illegal. Since the survey researcher is initiating the call, he or she incurs some ethical responsibility for possibly increasing the difficulties of the respondents. One way to handle this would be to not contact people on cell phones; however, as we saw in Chapter 6, this would have significant ramifications for the representativeness of samples. So, another option is to ask, after a brief introduction, if respondents are in a safe and relaxed environment where they can adequately respond to the questions. The downside of this strategy, of course, is that it gives the respondent a ready-made excuse to refuse to participate. But other things being equal, ethical considerations would take precedence over concerns about response rate.
Another ethical concern is that calling a cell phone may incur a cost to the recipient if the cell phone contract requires a charge for each call received. This can be handled by offering to reimburse the recipient for the charge.
A third ethical concern is that people often answer cell phones in public places, and this may impact on their ability to keep their responses private and confidential. Once again, this can be handled by asking respondents if they are in a location where they feel comfortable answering questions.
Finally, federal regulations control the use of cell phones, and researchers need to be careful not to violate them. For example, some interpretations of these regulations suggest that you are prohibited from using “mechanical dialers” to call cell phones unless the person has given prior consent to being called. Many researchers do use such devices when doing Random Digit Dialing with large samples (see Chapter 6). This problem can be avoided by manually calling the cell phone numbers, but this increases time and cost. It also may have an impact on respondent cooperativeness because some cell phone owners believe that such mass phone contacts are completely prohibited.
Online surveys have many advantages. Among the major advantages are their speed, low cost, and ability to reach respondents anywhere in the world (Fricker and Schonlau 2002; Schonlau et al. 2004). Most studies find that compared with mailed or telephone surveys, online surveys can be done much less expensively and that the responses are returned much more quickly.
Another advantage of online surveys is the versatility and flexibility offered by the technology. The questionnaire text can be supplemented with a variety of visual and auditory elements, such as color, graphics, images (static and animated), and even sound (Couper, Tourangeau, and Kenyon 2004). (This is discussed in Chapter 13 as a measurement issue.) The technology also can provide randomized ordering of questions for each respondent, error checking, and automatic skip patterns so that respondents can move easily through the interview. In addition, the data can be entered directly into a database once the respondent submits it.
The anonymity and impersonal nature of online interaction also may have advantages in research. For example, we discuss in this chapter the problem of interviewer effects—that is, how interviewer characteristics, such as race or gender, and behavior may influence people’s responses to questions. When answering questions online, there is no interviewer to produce such effects (Duffy et al. 2005). Similarly, the absence of an interviewer reduces the impact of social desirability—that is, respondents’ concerns about how their responses appear to other people. Researchers may even find computer surveys to be a more ethical approach in terms of minimizing the harm associated with revealing sensitive data, such as child maltreatment (Black and Ponirakis 2000). It also provides a good way to contact and collect data from groups that are difficult to access in other ways, possibly because they are relatively rare in the population or because of their involvement in undesirable or deviant interests or activities (Duffy et al. 2005; Koch and Emrey 2001). In fact, people seem to be more likely to admit their involvement in undesirable activities during online surveys compared with other types of surveys.
Online surveys also have their disadvantages, of course. Sampling and representativeness are especially problematic (Duffy et al. 2005; Kaplowitz, Hadlock, and Levine 2004; Schonlau et al. 2004). One problem is that not everyone has access to or actually uses the Internet. A second problem is that, even among those with Internet access, not everyone chooses to respond to requests to fill out an online survey. Given these problems, some argue that online surveys should be considered to be convenience samples rather than probability samples, with all the limitations in statistical analysis and generalizability that this implies (see Chapter 6). The population of people who use the Internet tends to be skewed toward those who are affluent, well educated, young, and male. So, unless the research has a clearly defined population, all of whose members have access to and actually use the Internet, questions about the representativeness of online respondents are difficult to resolve. Even with a clearly defined population and sampling frame, nonresponse can significantly distort results. For example, an online survey of the faculty members at a university probably would involve a population where all members have Internet access; however, it may be the younger faculty or those from particular academic disciplines who are most likely to respond. Thus, researchers need to scrutinize the issues of response rate and representativeness, just as they do with other types of surveys. For needs assessment surveys, however, and some kinds of qualitative research where probability samples are not critical, researchers may find online surveys quite useful.
Strategies are being developed to deal with these problems of sampling and representativeness. One approach uses the random selection of telephone numbers to identify a probability sample of people who are representative of a particular population. These people are then contacted and asked to participate. Those who agree are supplied with Internet equipment and an Internet service connection (or they can use their own equipment). This panel of study members can then be repeatedly contacted by e-mail and directed to a Web site to complete a survey (KnowledgeNetworks is one organization that does this: www.knowledgenetworks.com).
Another difficulty with online surveys is formatting: Different computer systems can change formatting in unpredictable ways. A survey that looks fine on the designer’s computer screen may become partially unintelligible when e-mailed to a respondent’s computer. In addition, all Internet browsers and servers may not support the design features in some Web page design software. Earlier in this chapter, we mentioned the importance of survey appearance in terms of achieving high response rates and gathering complete and valid responses. If respondents with various computers receive differently formatted surveys, this may influence their willingness to participate or their responses (and introduce error into the measurement). This is a serious concern, although technological improvements undoubtedly will reduce the seriousness of this problem in the future.
Focus GroupsResearch situations sometimes arise in which the standardization found in most surveys and interviews is not appropriate and researchers need more flexibility in the way they elicit responses to questions. One area in which this is likely to be true is exploratory research. Here, researchers cannot formulate questions into precise hypotheses, and the knowledge of some phenomena is too sketchy to allow precise measurement of variables. This also is true in research on personal and subjective experiences that are unlikely to be adequately tapped by asking the same structured questions of everyone.
In such research situations, the focus group, or group depth interview, is a flexible strategy for gathering data (Krueger and Casey 2008; Morgan 1994). As the name implies, this is an interview with a whole group of people at the same time. Focus groups originally were used as a preliminary step in the research process to generate quantitative hypotheses and to develop questionnaire items, and they are still used in this way. Survey researchers, for example, sometimes use focus groups as tools for developing questionnaires and interview schedules. Now, however, researchers also use focus groups in applied research as a strategy for collecting data in their own right, especially when the researchers are seeking people’s subjective reactions and the many levels of meaning that are important to human behavior. Today, tens of millions of dollars are spent each year on focus groups in applied research, marketing research, and political campaigns. One example of this is a study of the barriers that women confront in obtaining medical care to detect and treat cervical cancer, a potentially fatal disease that is readily detected and treated if women obtain Pap smears on a regular basis and return for follow-up care when necessary. These researchers decided that a focus group “would allow free expression of thoughts and feelings about cancer and related issues” and would provide the most effective mechanism to probe women’s motivations for not seeking appropriate medical care (Dignan et al. 1990, p. 370).
A focus group usually consists of at least one moderator and up to 10 respondents, and it lasts for up to three hours. The moderator follows an interview guide that outlines the main topics of inquiry and the order in which they will be covered, and he or she may have a variety of props, such as audiovisual cues, to prompt discussion and elicit reactions. Researchers select focus group members on the basis of their usefulness in providing the data called for in the research. Researchers chose the women for the study on cervical cancer, for example, because, among other things, all had had some previous experience with cancer. Normally, focus group membership is not based on probability samples, which Chapter 6 points out as the most likely to be representative samples. This, therefore, can throw the generalizability of focus group results into question. In exploratory research, however, such generalizability is not as critically important as it is in other research. In addition, most focus group research enhances its representativeness and generalizability by collecting data from more than one focus group. The cervical cancer study, for example, involved four separate focus groups of 10 to 12 women each, and some research projects use 20 or more focus groups.
The moderator’s job in a focus group is to initiate discussion and facilitate the flow of responses. Following an outline of topics to cover, he or she asks questions, probes unclear areas, and pursues lines of inquiry that seem fruitful. A focus group, however, is not just 10 in-depth interviews. Rather, the moderator uses knowledge of group dynamics to elicit data that an interviewer might not have obtained during an in-depth interview. For example, a status structure emerges in all groups, including focus groups; some people become leaders and others followers. The moderator uses this group dynamic by encouraging the emergence of leaders and then using them to elicit responses, reactions, or information from other group members. Group members often respond to other group members differently than they respond to the researcher/moderator. People in a focus group make side comments to one another—something obviously not possible in a one-person interview—and the moderator makes note of these comments, possibly encouraging group members to elaborate. In fact, in a well-run focus group, the members may interact among themselves as much as they do with the group moderator. In a standard interview, the stimulus for response is the interviewer’s questions; in contrast, focus group interviews provide a second stimulus for people’s responses—namely, the group experience itself.
The moderator also directs the group discussion, usually from more general topics in the beginning to more specific issues toward the end (Krueger and Casey 2000). For example, in the focus group study of cervical cancer, the moderators began with questions about general life concerns and the perceived value of health, and they ended with specific questions about cancer, cancer screening, and Pap smears. The general questions provided a foundation and a context, without which the women might not have been as willing—or as able—to provide useful answers to the more specific questions. Group moderators take great care in developing these sequences of questions. The moderator also observes the characteristics of the participants in the group to ensure effective participation by all members. For example, the moderator constrains a “rambler” who talks a lot but doesn’t say much and encourages “shy ones” who tend to say little to express themselves. In short, moderating a focus group is a complex job that calls for both an understanding of group dynamics and skills in understanding and working with people.
During a focus group session, too much happens too fast to engage in any useful data analysis on the spot. The focus group produces the data, which are preserved on videotape or a tape recording for later analysis. During this analysis, the researcher makes field notes from the recordings and then prepares a report summarizing the findings and presenting conclusions and implications. Data from a focus group usually are presented in one of three forms (Krueger and Casey 2000). In the raw data format, the researcher presents all the comments that group participants made about particular issues, thus providing the complete range of opinions the group expressed. The researcher offers little interpretation other than to clarify some nonverbal interaction or nuance of meaning that could be grasped only in context. The second format for presentation is the descriptive approach, in which the researchers summarize in narrative form the kinds of opinions expressed by the group, with some quotes from group members as illustrations. This calls for more summary on the part of the researcher, but it also enables him or her to cast the results in a way that best conveys the meaning communicated during the group session. The third format is the interpretive model, which expands on the descriptive approach by providing more interpretation. The researcher can provide his or her own interpretations of the group’s mood, feelings, and reactions to the questions. This may include the moderator’s impression of the group members’ motivations and unexpressed desires. The raw data model is the quickest manner of reporting results, but the interpretive model provides the greatest depth of information from the group sessions. Of course, the interpretive approach, because it does involve interpretation, is more likely to exhibit some bias or error.
Focus groups have major advantages over more structured, single-person interviews: The focus groups are more flexible, cost less, and can provide quick results. In addition, focus groups use the interaction between people to stimulate ideas and to encourage group members to participate. In fact, when run properly, focus groups have high levels of participation and, thus, elicit reactions that interviewers might not have obtained in a one-on-one interview setting. Unfortunately, focus groups also have disadvantages: The results are less generalizable to a larger population, and the data are more difficult and subjective to analyze. Focus groups also are less likely than interviews to produce quantitative data; in fact, focus group data may more closely resemble the field notes that are produced in field research, which we will discuss in Chapter 9.
Practice and Research Interviews ComparedThe interview is undoubtedly the most commonly employed technique in human service practice. Therefore, it is natural for students in the human services to wonder how research interviewing compares with practice interviewing. The fundamental difference is the purpose of the interview. Practitioners conduct interviews to help a particular client, whereas researchers conduct interviews to gain knowledge about a particular problem or population. The practitioner seeks to understand the client as an individual and, often, uses the interview to effect change; the researcher uses the data collected on individuals to describe the characteristics of and variations in a population. To the practitioner, the individual client system is central. To the researcher, the respondent is merely the unit of analysis, and the characteristics and variability of the population are of primary concern.
Information Technology in Research: Survey Design and Data Collection
An ever-expanding array of online survey tools is now available to researchers. A quick Web search with the term “online surveys” generates a substantial list of Web sites promising quick, easy survey design and delivery that any novice can use to gather data and report results. At the other end of the spectrum are sophisticated survey sites which are relied upon by universities, research centers, and major corporations for survey design, delivery, analysis, and reporting. Examples of organizations offering extensive survey tools include Qualtrics (www.qualtrics.com/), Survey Methods (www.surveymethods.com/), and QuestionPro (www.questionpro.com/).
Our experience has been primarily with Qualtrics, but many of the features described here are common to other providers as well. Modern Web-based survey organizations go beyond simply permitting a researcher to post survey questions on a Web site; they provide tools and services that cover the entire research process, including survey instrument design, sample selection, question delivery, data gathering, data analysis, and report generation and dissemination. Because they can incorporate all the media of the Internet, in addition to questions in text form, they employ audio and video presentations to elicit responses. Participants may record answers by typing words, clicking radio buttons, or manipulating a slide image among other means.
To aid researchers in survey design, a question library is available. During the design process, the researcher can select individual questions or blocks of questions with a mouse click. In addition to drawing on hundreds of standard questions, researchers can store their own questions as they develop them for use in future surveys and use a survey that they have created as a template for future surveys. Many different question formats are available. Once the survey has been developed, it can be printed for completion by hand, but completion online is generally preferred in order to take advantage of the full range of Web features.
For example, the practice of using the concept of contingency questions, or “skip-logic,” is especially applicable to Web surveys. The Web survey only displays those questions that are relevant to a respondent based upon previous answers. As respondents progress through the survey, they need not deal with irrelevant items or be depended upon to follow directions such as “If your answer to question 5 was X, then go to Section 7.” Similarly, individual answer options that are irrelevant to certain respondents can be dropped from the display, which simplifies and speeds up completion by the respondent. Response choices and blocks of questions can also be randomized to help detect and avoid bias due to response order. If the researcher wishes to imbed an experiment in the survey (such as comparing the effect of a question worded in two different ways), a simple menu choice within the program results in respondents’ randomly getting one question version or the other.
An obvious advantage of online surveys is that the data are stored directly in a database without the need for manual data entry. However, these programs not only store data, but they can generate instant statistical analyses, including graphs and charts, and enable the user to distribute the results via the Web or in printed reports. The data can also be downloaded for analysis with statistical software programs such as SPSS. Survey quality control is also facilitated because the program can provide overall survey statistics, such as drop-out rates, average response time per question, completion percentages, and start times. These are only some of the features that make Web-based surveys so appealing. More in-depth coverage of Web survey methodology can be found at the Qualtrics Web site under “Survey University.”
For those situations where respondents have access to the Internet, such as many business organization and educational settings, online services are ideal. However, the temptation to employ Web-based research because of ease of use, power, rapid results, and visual appeal can generate misleading results if a significant part of the population being studied lacks Internet access.
The difference in purpose is the basis for the differences between practice and research interviewing. Whereas we select respondents to represent a population, we accept clients because they have individual needs that the agency serves. Research interviews typically are brief (often single encounters); practice relationships are often intensive, long-term relationships. Clients (or clients’ needs) often determine the topic and focus of a practice interview, whereas the nature of the research project predetermines the content of the research interview. The ideal research interview presents each respondent with exactly the same stimulus to obtain validly comparable responses. The ideal practice interview provides the client with a unique situation that maximizes the potential to help that individual.
An emphasis on the differences between the two forms of interviewing, however, should not obscure their similarities. Both require that the interviewer make clear the general purpose of the interview. Both require keen observational skills and disciplined use of self according to the purpose of the interview. This last point is crucial to answering another question about interviewing: Do practitioners make good research interviewers? The answer depends on the nature of the particular interview task and on the interviewer’s capacity to perform that task. Interviewers who display warmth, patience, compassion, tolerance, and sincerity best serve some situations; other situations require reserved and controlled interviewers who bring an atmosphere of objective, detached sensitivity to the interview (Kadushin and Kadushin 1997). Some researchers have found that verbal reinforcement—both positive comments to complete responses and negative feedback to inadequate responses—results in obtaining more complete information from respondents (Vinokur, Oksenberg, and Cannell 1979). Although successful in terms of amount of information gained, such techniques might be foreign to the style of interviewing that a practitioner uses. Thus, for the structured, highly controlled interview, a practitioner who is used to improvising questions and demonstrating willingness to help may be a poor choice as an interviewer. In situations requiring in-depth, unstructured exploratory interviews, however, that same practitioner’s skills might be ideal. Again, the purpose of the interview and the nature of the task determine the compatibility of human service skills with the research interview.
Review and Critical Thinking Main PointsSurveys are of two general types: (1) questionnaires completed directly by respondents, and (2) interviews with the questions read and the responses recorded by an interviewer.
Closed-ended questions provide a fixed set of response alternatives from which respondents choose.
Open-ended questions provide no response alternatives, leaving respondents complete freedom of expression.
Once developed, survey instruments should be pretested for clearly understood and unbiased questions; after changes are made in the instrument, it should be pretested again.
Questionnaires must provide clear directions, both to indicate what respondents should do and to guide them through the questionnaire.
Researchers should order questions so that early questions maximize the response rate but do not affect the responses to later questions.
Obtaining a high response rate (the percentage of surveys actually completed) is very important for representativeness in survey research.
The cover letter, use of payments and follow-up letters, and length and appearance of the questionnaire are all central in efforts to maximize the response rate with the mailed questionnaire.
Interviews are classified by their degree of structure as unstandardized, nonschedule-standardized, or schedule-standardized.
Probes elicit clearer and more complete responses during interviews.
Telephone surveys offer significant savings in terms of time and cost compared with interviews or mailed questionnaires and, in many cases, are a suitable alternative.
Online surveys are fast and inexpensive compared to other surveys and permit flexible formatting and design, but they raise serious questions regarding sampling and representativeness.
Focus groups rely on group dynamics to generate data that would not be discovered using a standard questionnaire or interview format.
Web sites are now widely available that will conduct surveys from beginning to end—from designing the survey instrument to the analysis of the data and the preparation of a report.
closed-ended questions
computer-assisted interviewing
computer-assisted telephone interviewing
contingency question
cover letter
filter question
focus group
group depth interview
interview
interview schedule
interviewer falsification
matrix question
open-ended questions
probes
questionnaire
response rate
survey
survey research
The research techniques discussed in this chapter involve observations of what people say about the thoughts, feelings, or behaviors of themselves or others. This kind of research technique has advantages, but it also has drawbacks. Practitioners and policymakers, as well as people in their everyday lives, need to be cautious when confronted with information or conclusions based on similar data. Consider the following:
Are the topic and the conclusions best addressed by what people say about their thoughts or behavior (a survey) or by direct observation? Is it legitimate to conclude something about people’s behavior from what they have said?
What questions were asked and how were they asked? Do they contain any of the flaws that could produce bias or misinterpretation? Is there anything in their design (wording, context, etc.) that might lead to misunderstanding, misinterpretation, or bias in the information that results?
What about reactivity? Could the manner in which the information was gathered have influenced what people said?
What about sampling? Could the manner in which the information was gathered, such as by telephone, by cell phone, or online, have influenced who the observations were made on?
Most major survey research centers maintain Web sites, and some of them are extremely useful. At many sites, you can find a basic overview of survey research, a discussion of ethics in surveys, and information on how to plan a survey. Some even provide the opportunity to examine questions used in actual surveys. It also is possible to download and read entire questionnaires and survey instruments. By reviewing these surveys, you can explore how the researchers structured the instrument and ordered the questions, and you will see skip patterns and other features that enhance the research instrument’s quality. Not only will you become more familiar with major survey projects around the world, you can learn a great deal about how to design good survey questions.
Here is a list of some worthwhile sites:
The Odum Institute for Research in Social Science (www.irss.unc.edu/odum/jsp/home.jsp)
The General Social Survey (www.norc.org/GSS+website/)
Courses in Applied Social Surveys (in England) (www.s3ri.soton.ac.uk/cass)
American Association for Public Opinion Research (www.aapor.org; the “Best Practices” link is especially informative on planning and conducting surveys)
Survey Research Methods Section of the American Statistical Association (www.amstat.org/sections/SRMS)
Use the search engine on the Web browser available to you to look for other survey research centers, such as these:
UK Data Archive (http://www.data-archive.ac.uk/).
Statistics Canada (www.statcan.gc.ca).
National Center for Health Statistics (www.cdc.gov/nchs/surveys.htm).
Dillman, Don A., J. D. Smyth, and L. M. Christian. Internet, Mail, and Mixed-Mode Surveys: The Tailored Design Method, 3rd ed. New York: Wiley, 2009. This is an excellent introduction to survey research, and it also provides the most up-to-date overview of how to conduct surveys through the mail and on the Internet.
Gorden, Raymond. Basic Interviewing Skills. Itasca, Ill.: Peacock, 1992. This useful how-to book on interviewing covers everything from developing questions to motivating good responses to evaluating respondents’ nonverbal behavior.
Gubrium, Jaber F., and James A. Holstein. Handbook of Interview Research: Context and Method. Thousand Oaks, Calif.: Sage, 2001. This complete handbook covers many forms of interviewing, including survey, qualitative, in-depth, and therapy. The book addresses technical issues, distinctive respondents, and analytic strategies.
Kadushin, Alfred, and Goldie Kadushin. The Social Work Interview: A Guide for Human Service Professionals, 4th ed. New York: Columbia University Press, This is the standard text for social work interviewing. It covers all aspects of the helping interview, and it presents a solid comparison for the survey interview.
Krueger, Richard A., and Mary Anne Casey. Focus Groups: A Practical Guide for Applied Research, 4th ed. Thousand Oaks, Calif.: Sage, 2008. This book is the standard for learning how to conduct a focus group. The third edition compares market research, academic, nonprofit, and participatory approaches to focus group research, and it describes how to plan focus group studies and do the analysis, including step-by-step procedures.
Salant, Priscilla, and Don Dillman. Conducting Surveys: A Step-by-Step Guide to Getting the Information You Need. New York: Wiley, 1994. As the title states, this is a very useful guide to all the steps in conducting sound survey research.
Schuman, Howard, and Stanley Presser. Questions and Answers in Attitude Surveys: Experiments on Question Form, Wording, and Content. Thousand Oaks, Calif.: Sage, 1996. This is a comprehensive handbook on the rules, problems, and pitfalls of designing survey questions. It goes far beyond what this chapter is able to cover on this important topic.
Sue, Valerie M., and Lois A. Ritter. Conducting Online Surveys. Los Angeles: Sage, 2007. This volume is a comprehensive guide to the creation, implementation, and analysis of e-mail and Web-based surveys. The authors specifically address issues unique to online survey research such as selecting software, designing Web-based questionnaires, and sampling from online populations.


