Teaching Project

Demographic Assessment Project NURS 4404: Community Health Nursing Course Objectives
Design the nursing process to promote health with community partners across the life span in community settings with both predictable and unpredictable circumstances.
Create partnerships with communities in the customized therapeutic care process to protect, promote, and restore optimal community health.
Analyze practice decisions within the community utilizing critical thinking.
Evaluate strategies to improve community health through scholarship.
8. Develop and exhibit self-directed behaviors in the community health setting.
9. Demonstrate behaviors that are professional in nature in accordance with the American Nurses Association and the Texas Board of Nursing (Essential VIII)
Explain how community-focused nursing supports health assessments and interventions of communities and populations
Module 3Examine the role of informatics in community health nursing
Module 4Explain how chronic illnesses affect the health of a community.
Module 6Describe how the community health nurse supports the healthcare needs of families in the community
Module 7Compare and contrast the role of the community health nurse with the public health nurse.
Experiential Learning Practice Objectives:1. Demonstrate cultural sensitivity when formulating customized therapeutic nursing care with the community.
5. Demonstrate leadership, initiative and professionalism in the community health setting and demonstrate accountability for behavior.
6. Seek appropriate assistance and utilize guidance to facilitate own learning.
7. Demonstrate behaviors that are professional in nature in accordance with the American Nurses Association and the Texas Board of Nursing (Essential VIII)
Assignment Goal:The students will be able to analyze critical data to identify health threats and risks in their assigned community.
Assignment Objectives:The student will locate demographic data and vital statistics that relate to the assigned community.
The student will summarize the collected data
The student will identify 2 strengths and weaknesses of the community based on the summary
The students will formulate a nursing diagnosis based upon the analysis of the data.
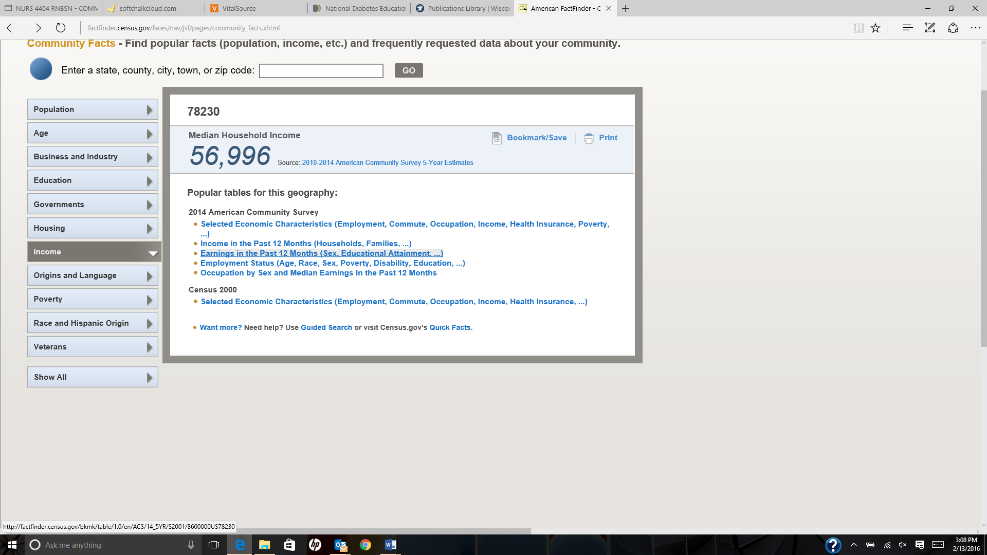
This assignment utilizes data mining, a tool of nursing informatics, to locate critical information about your community. The US Census, performed by law stated in The US Constitution, is collected every ten years. The results of the census are found here. The information gleaned here is immensely valuable in assessing and planning interventions for a community. This is a routine practice for public health nurses and community nurses.
It is important to understand that the date from the US Census is self- reported. It may or may not be accurate. You may notice that the percentages do not always add up to 100 percent (or they add up to more than 100 percent). Sometimes people fill the census forms out a little differently than instructed, which gives interesting results! Report the numbers as they are stated in the Census documents and relax.
The assignment is another piece of an actual community assessment. The assignment will teach you how to discover facts about the population you serve whatever practice specialty you choose. When the public health nurse completes the community assessment, the nurse engages with many partners at the national, state, and local level. Now that much of the vital statistics and demographic information is online, that engagement can seem invisible. You also engage with community leaders and members of the population in a variety of roles and professions.
This assignment will take 10 hours to complete.
Overview InstructionsComplete all of the tables below using the zip code information (enter that into the zip code column). Then, go back to the above link and enter your county. Complete all of the tables using the county information. Next, go back to the above link and enter your state. Complete all of the tables using the state information. Please note that on some tables, the only information available is the actual count (rate) or percent. Please fill in what is available and do not panic. You will not be marked off for not filling in what is not available. Put NA in the blank.
Write a short summary sentence for each table.
Write a summary statement (as many sentences as you need) to explain the conclusions you have drawn about the community. For example: The population of zip code 78230 averages 1 to 2 members in each household. There is a high rate of teenage pregnancy. Diabetes is the leading cause of death.
Locate the information requested on this form. Submit your results, your hours and your daily log.
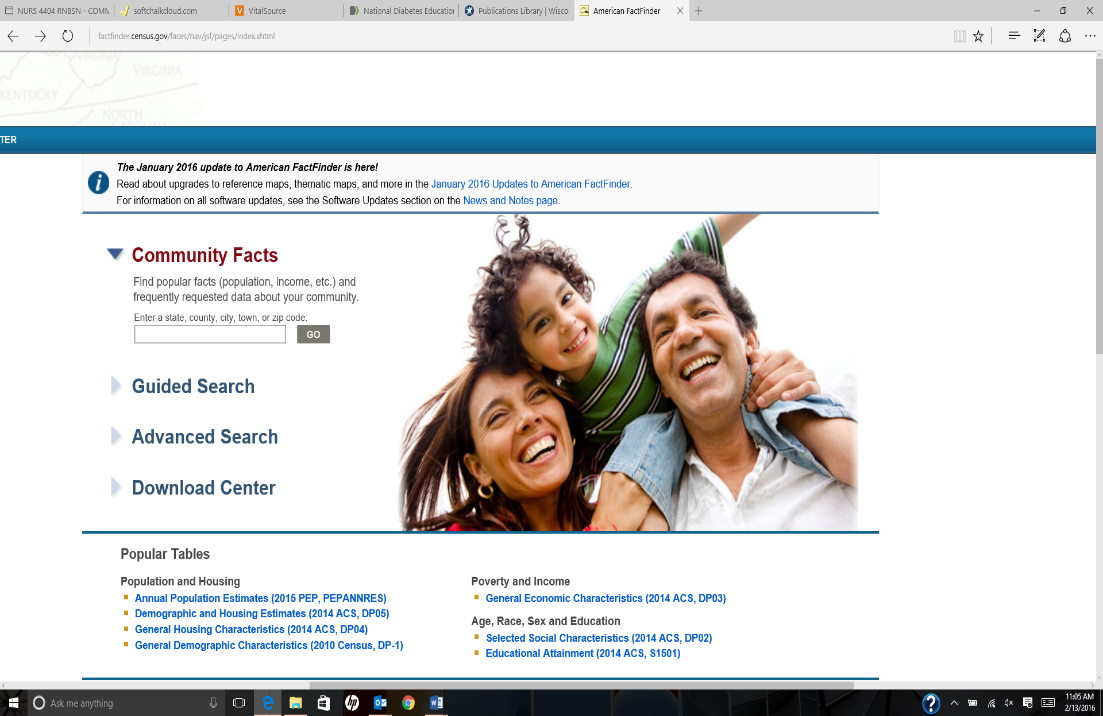
Log onto the Internet. Go to American Factfinder. In the Community Fact box, enter your zip code.
![Teaching Project 2]()
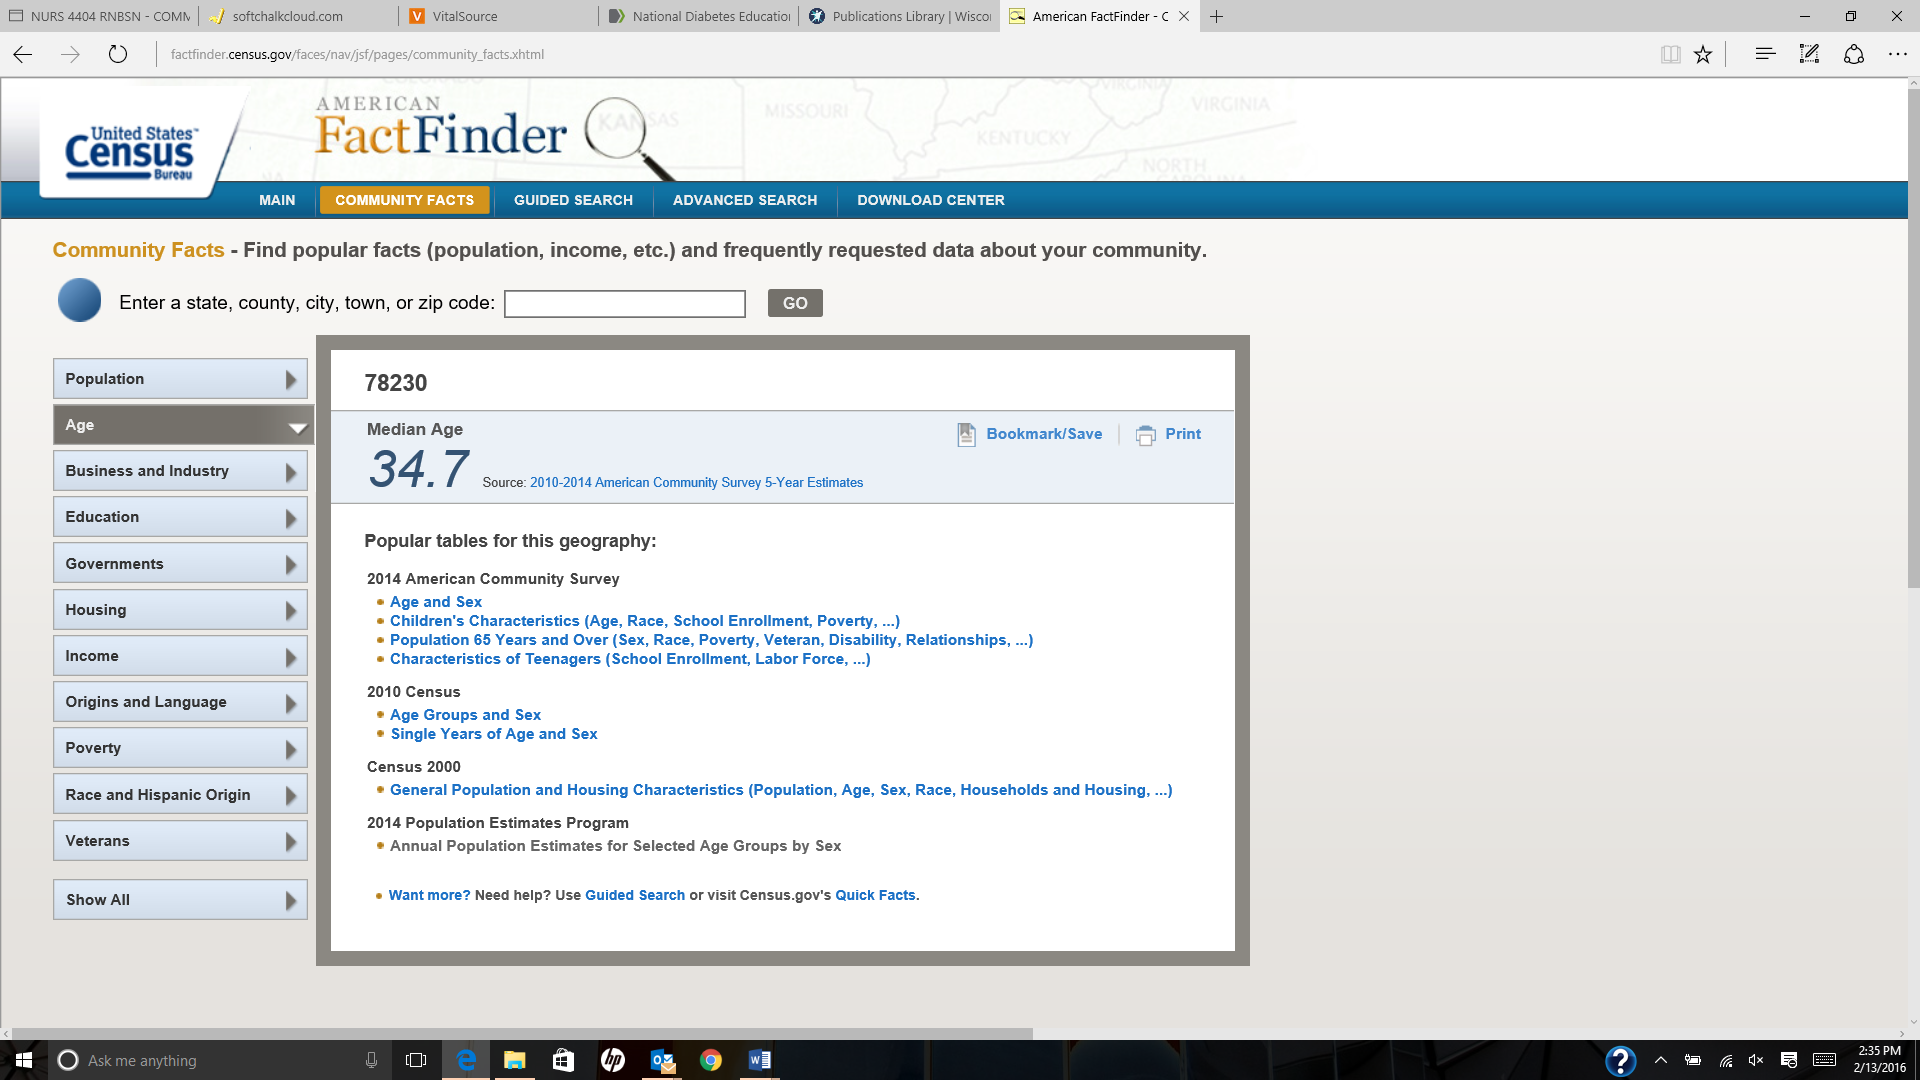
Select the Age Tab on the left. Click on Age and Sex. Then complete the table below.
Population by Age (combine the smaller groups of ages in the interest of time)
| Age | Zip Code | Percent | County | Percent | State of Texas | Percent |
| Under 5 | 8.8 | 7.9 | 7.4 | |||
| 5-19 | N/A | N/A | N/A | |||
| 20-39 | N/A | N/A | N/A | |||
| 40-64 | N/A | N/A | N/A | |||
| 65-84 | 8.3 | 8.9 | 11.2 | |||
| 84 and older | 1.0 | 1.0 | 1.3 | |||
| Total Population | 54,555 | 18.1 | 4,346,362 | 17.8 | 26,538,614 | 19.9 |
Write an Age Summary Statement:
In zip code, County, The State of Texas 65-84 all have around the same percentage with a little over 1% in the older population.
Next:
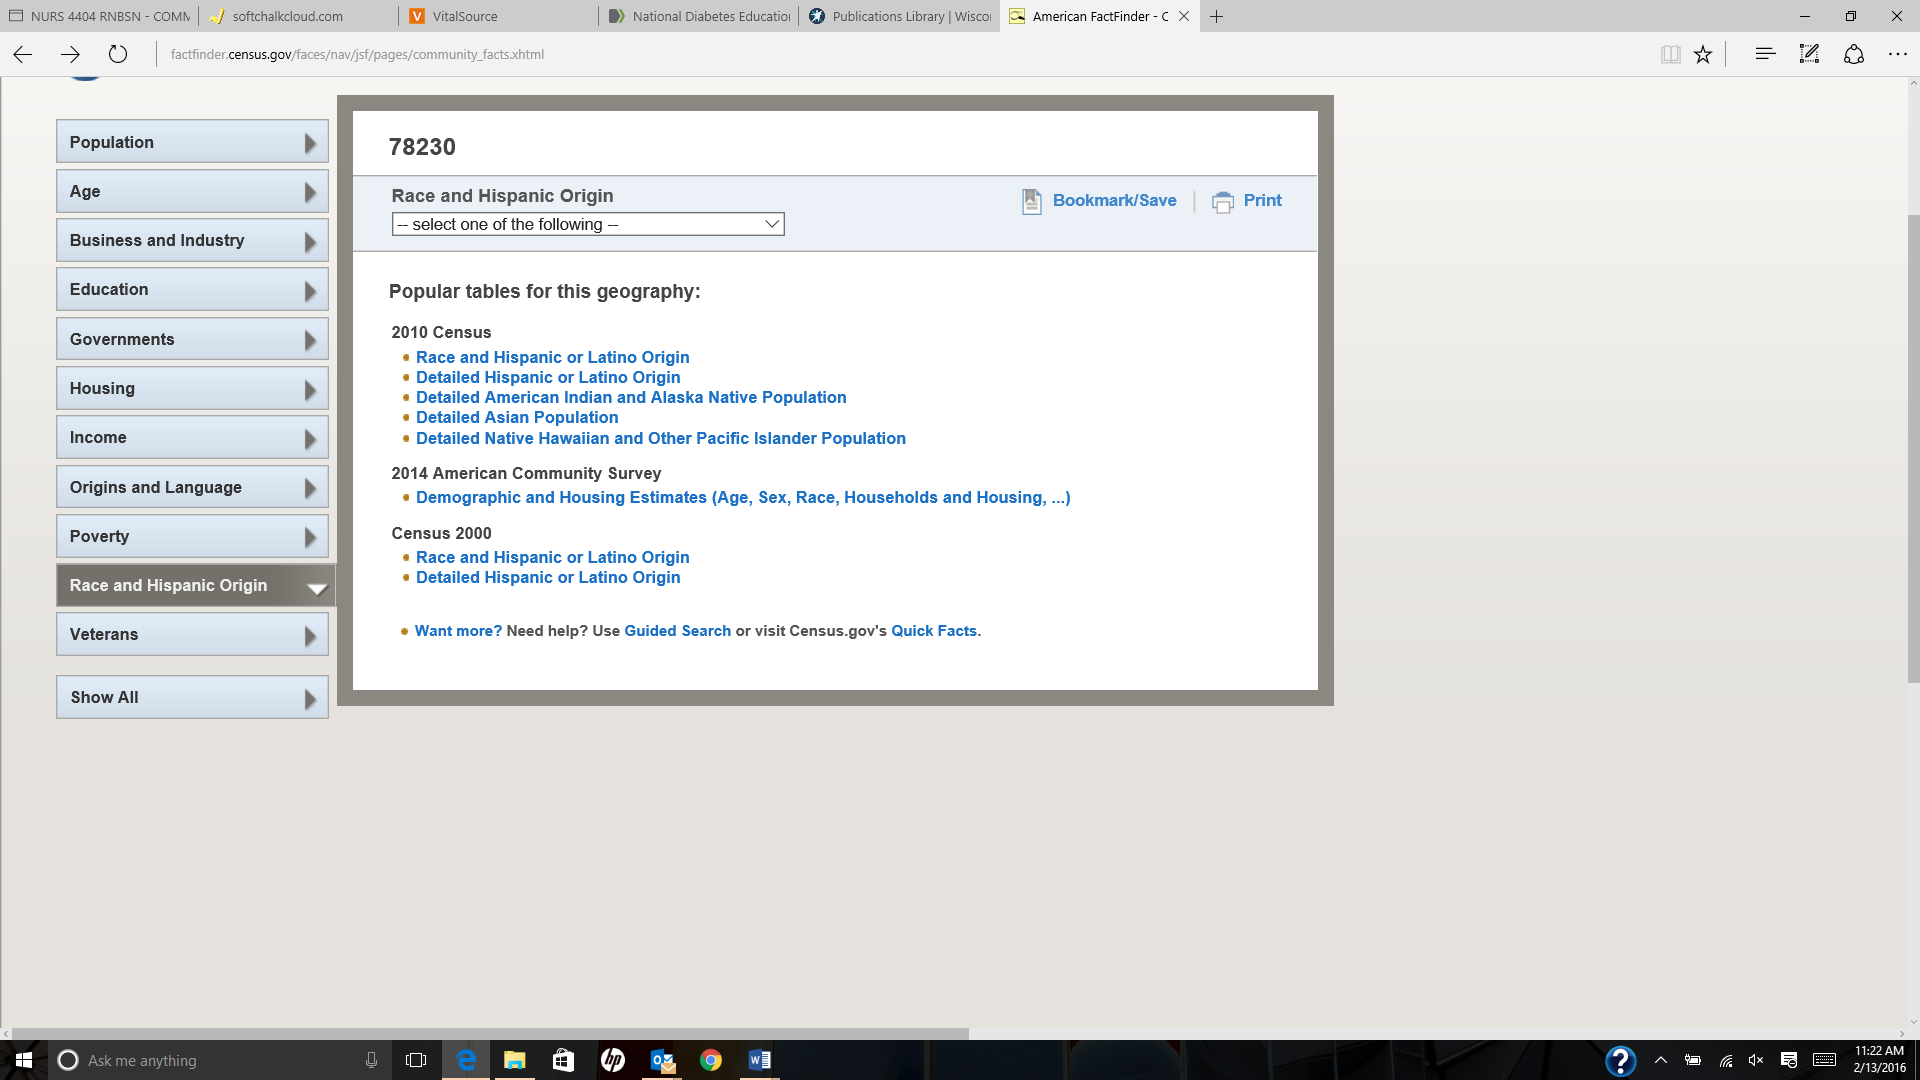
Select the Race and Hispanic Origin tab on the left:
Select Race and Hispanic Origin
Complete the table below
Population by Race (the names of each race are set by the US Government)
Write a Race Summary Statement:
| Race | Zip Code | Percent | County | Percent | State of Texas | Percent |
| White | 19,857 | 56.6 | 2,318,254 | 56.6 | 17,701,552 | 7.4 |
| Black or African-American | 16,229 | 18.9 | 775,492 | 18.9 | 2,979,598 | 11.8 |
| American Indian or Alaska Native | 260 | 0.7 | 27,763 | 0.7 | 170,972 | 0.7 |
| Asian | 6,998 | 6.2 | 253,032 | 6.2 | 964,596 | 3.8 |
| Native Hawaiian and other Pacific Islander | 17 | 0.1 | 3,018 | 0.1 | 21,656 | 01 |
| Some other race | 4,649 | 14.3 | 583,566 | 14.3 | 2,628,186 | 10.9 |
| Two or more races | 1,890 | 3.2 | 74,924 | 3.2 | 305,206 | 2.7 |
| Hispanic or Latino | 49,900 | 40.8 | 4,092,459 | 40.8 | 25,145,561 | 37.6 |
| Race and Hispanic or Latino | 14,588 | 3.8 | 1,671,540 | 3.8 | 9,460,921 | 36.2 |
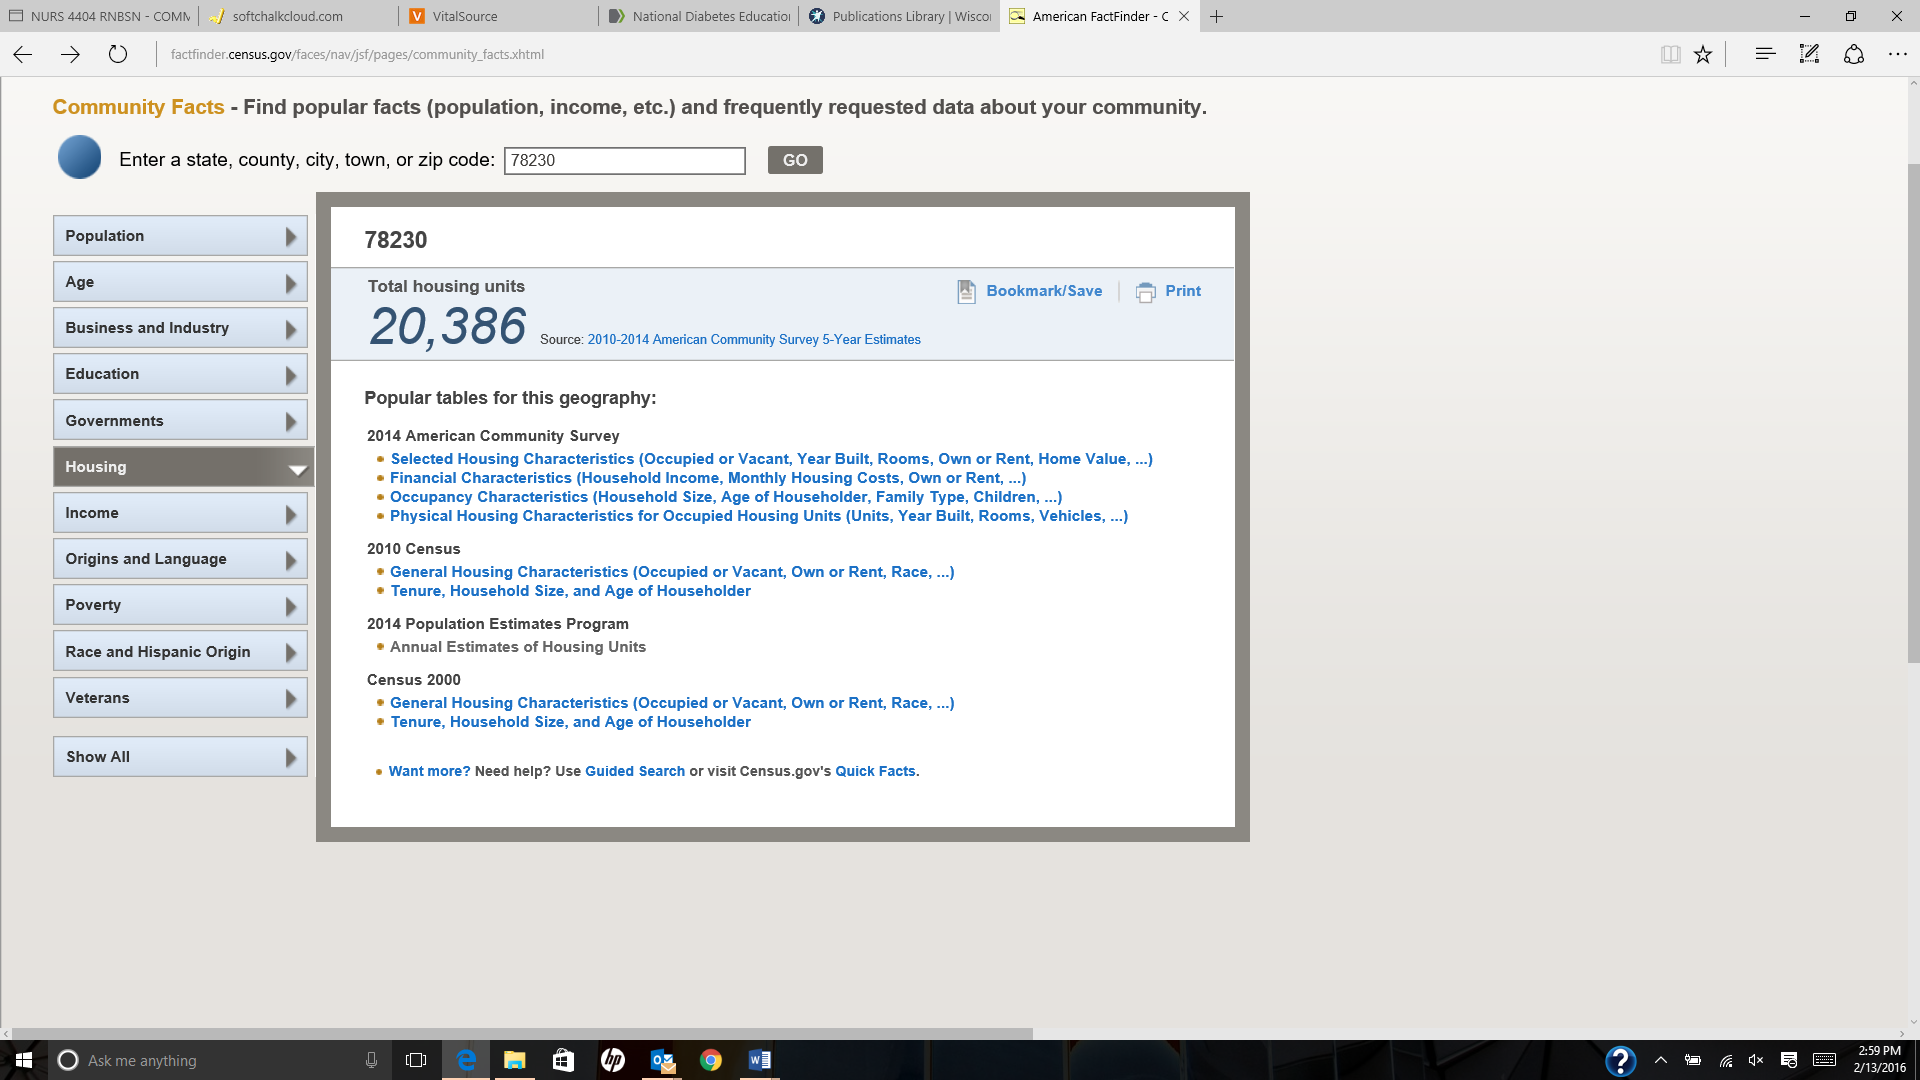
Select Housing, then Occupancy Characteristics
| Occupancy Characteristics | Zip Code | Percent | County | Percent | State of Texas | Percent |
| 1 Person Household | N/A | 32.9 | N/A | 26.1 | N/A | 25.0 |
| 2 Person Household | N/A | 27.8 | N/A | 28.9 | N/A | 31.4 |
| 3 Person Household | N/A | 18.5 | N/A | 16.5 | N/A | 16.5 |
| 4 Person Household | N/A | 20.8 | N/A | 28.5 | N/A | 27.1 |
| Married-couple Family | N/A | 36.8 | N/A | 46.9 | N/A | 50.2 |
| Other family | N/A | 24.4 | N/A | 21.4 | N/A | 19.4 |
| Male householder only | N/A | 5.3 | N/A | 5.8 | N/A | 5.1 |
| Female householder only | N/A | 19.1 | N/A | 15.6 | N/A | 14.3 |
| Non-family | N/A | 38.8 | N/A | 26.1 | N/A | 25.5 |
| With Children under 18 | N/A | 34.5 | N/A | 38.6 | N/A | 37.4 |
| With Children under 6 | N/A | 9.2 | N/A | 7.5 | N/A | 7.0 |
Write Occupancy Characteristics Summary Statement:
Married couples with children under 18 is very high, while non family and one-person household are in the middle range. The least in the group is male household.
IncomeSelect Income from the tab on the left
Select “Selected Economic Characteristics” (Employment, Commute, Occupation, Income…). You will use this for the next several tables
Complete the tables below
| Income For Households | Zip Code | Percent | County | Percent | State of Texas | Percent |
| Less than $10,000 | 1,420 | 6.6 | 101,436 | 6.8 | 658,087 | 7.2 |
| $10,000 to $14,999 | 906 | 4.6 | 72,245 | 4.8 | 469,798 | 5.1 |
| $15,000 to $24,999 | 2,258 | 10.5 | 160,466 | 10.7 | 979,868 | 10.7 |
| $25,000 to $34,999 | 2,955 | 13.8 | 154,954 | 10.3 | 946,768 | 10.3 |
| $35,000 to $49,999 | 3,220 | 15.0 | 200,417 | 13.4 | 1,246,304 | 13.6 |
| $50,000 to $74,999 | 4,390 | 20.5 | 260,121 | 17.3 | 1,628,091 | 17.8 |
| $75,000 to $99,999 | 2,244 | 10.5 | 169,165 | 11.3 | 1,075,935 | 11.8 |
| $100,000 to $149,999 | 2,231 | 10.4 | 194,574 | 13.0 | 1,193,463 | 13.1 |
| $150,000 to $199,999 | 876 | 4.1 | 83,066 | 5.5 | 463,766 | 5.1 |
| $200,000 or more | 952 | 4.4 | 103,084 | 6.9 | 484,116 | 5.3 |
| Median Household Income | 49,813 | 54,457 | 53,207 | |||
| Median Earnings Males | 46,219 | 46,448 | 46,332 | |||
| Median Earnings Females | 35,235 | 38,067 | 36,664 | |||
| With Supplemental Social Security | 666 | 3.1 | 63,511 | 4.2 | 446,461 | |
| With Public Assistance | 468 | 2.2 | 23,156 | 1.5 | 154,152 | 1.7 |
| With Food Stamps | 2,970 | 13.8 | 197,818 | 13.2 | 1,229.337 | 13.4 |
Write Income Summary Statement:
The average income is higher in Harris county, 49,000-53,000 and male average income is more than female income. Food stamp is more prevalent in Harris county.
Occupation (In same section of the website)
| Occupation | Zip Code | Percent | County | Percent | State of Texas | Percent |
| Management, business, science, and arts occupations | 11,032 | 38.5 | 721,575 | 34.7 | 4,246,418 | 35.1 |
| Service occupations | 4,915 | 17.1 | 362,173 | 17.4 | 2,137,635 | 17.7 |
| Sales and office occupations | 8,102 | 28.2 | 489,776 | 23.5 | 2,950,995 | 24.4 |
| Natural resources, construction, and maintenance occupations | 2,000 | 7.0 | 239,282 | 11.5 | 1,314,287 | 10.9 |
| Production, transportation, and material moving occupations | 2,641 | 9.2 | 269,083 | 12.9 | 1,444,927 | 11.9 |
| Agriculture, forestry, fishing and hunting, and mining | 4.1 | 2,897 | 3.3 | 405,569 | 3.4 | |
| Construction | 1,072 | 5.4 | 161,797 | 9.4 | 947,689 | 7.8 |
| Manufacturing | N/A | 6.6 | N/A | 10.4 | 1,105,985 | 9.1 |
| Wholesale trade | N/A | 2.3 | N/A | 3.7 | 363,612 | 3.0 |
| Retail trade | N/A | 16.1 | N/A | 10.9 | 1,403,859 | 11.6 |
| Transportation and warehousing, and utilities | 1,548 | 5.6 | 129,459 | 6.2 | 660,396 | 5.5 |
| Information | 593 | 2.1 | 27,446 | 1.3 | 215,594 | 1.8 |
| Finance and insurance, and real estate and rental and leasing | 2,043 | 7.1 | 120,954 | 5.8 | 794,643 | 6.6 |
| Professional, scientific, and management, and administrative and waste management services | 4,090 | 114.3 | 271,028 | 13.0 | 1,3337,372 | 11.1 |
| Educational services, and health care and social assistance | 5,977 | 20.8 | 392,293 | 18.8 | 2,617,242 | 21.6 |
| Arts, entertainment, and recreation, and accommodation and food services | 2,406 | 8.4 | 179,073 | 8.6 | 1,076,415 | 8.9 |
| Other services, except public administration | 1,402 | 4.9 | 122,370 | 5.9 | 645,308 | 5.3 |
| Public administration | 679 | 2.4 | 53,757 | 2.6 | 520,578 | 4.3 |
Write Occupation Summary Statement
Professional, Scientific, management and, administrative and waste management is the highest in Alief followed by management and business. Information and wholesale which rank the lowest.
Poverty (In same section of the website)
People Living Below the Poverty Level
| Type of Person or Family | Zip Code Only percent | Percent | County Only percent | Percent | State of Texas Only percent | Percent |
| Female head of household no husband present | 35,235 | 24.7 | 38,068 | 32.9 | 36,664 | 32.8 |
| Under 18 | 19.8 | 12.6 | 19.9 | |||
| Under 5 | 15.0 | 28.8 | 18.6 | |||
| 18-64 | 10.6 | 15.1 | 15.1 | |||
| 65 and older | 14.9 | 11.5 | 11.1 |
Write Poverty Summary Statement
Living below the poverty level is 65 and older at 11.5% county and statewide 11.1%. Which female head of household are in the 32% statewide. Poverty seems mostly to affect the 65 and older population.
Health Insurance (In same section of the website)
| Zip Code Only percent | Percent | County Only percent | Percent | State of Texas Only percent | Percent | |
| All persons | N/A | N/A | N/A | N/A | ||
| Civilian noninstitutionalized population | 54,369 | 4,335,831 | 26,062,431 | |||
| With Health Insurance | 40,610 | 74.7 | 3,315.80 | 76.5 | 20,698, | 79.4 |
| Without Health Insurance | 13,759 | 25.3 | 10,020,252 | 23.5 | 5,363,985 | 11.7 |
Write Health Insurance Summary Statement
Among the groups it appears majority are insured.
Return to link and select Education on the left tab
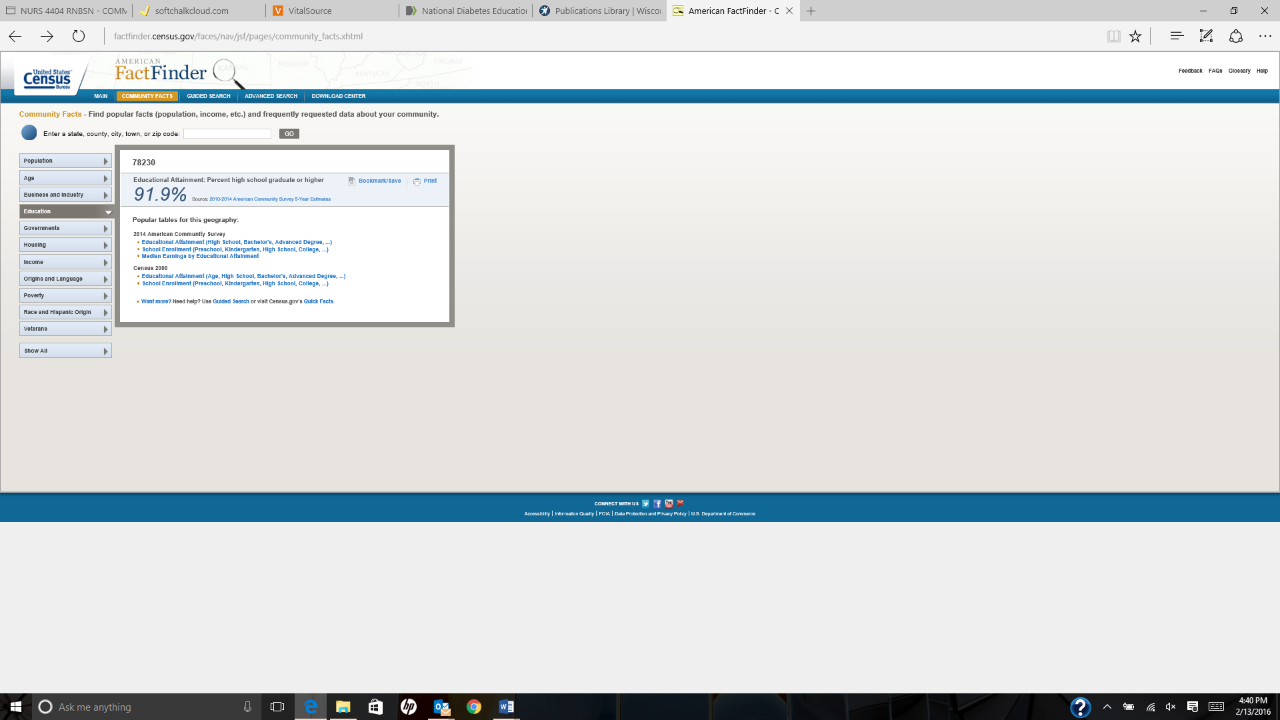
Add all age groups together
| Some high school | Zip Code | Percent Only count | County | Percent Only count | State of Texas | Percent Only count |
| High School Graduate or Equivalency | 833,353 | 55.1 | 131,512 | 53.8 | 463,866 | 55.9 |
| Some college or associate degree | 1,207,307 | 46.9 | 176,525 | 46.9 | 1,297,307 | 44.5 |
| Bachelor Degree | 209,935 | 23.4 | 37,937 | 18.9 | 3,054,382 | 7.7 |
| Graduate or Professional Degree | 1,568,834 | 12.2 | 287,827 | 10.5 | 1,568,834 | 9.4 |
| Poverty Rate for less than high school | 22.5 | 27.6 | 28.9 | |||
| Poverty Rate for high school graduate | 11.6 | 16.4 | 14.9 | |||
| Poverty Rate for some college or associate degree | 10.7 | 10.8 | 9.9 | |||
| Poverty Rate for Bachelor degree or higher | 6.9 | 4.5 | 4.3 |
Write Educational Attainment Summary Statement
In Alief TX the high school graduate or equivalency are high, indicating that high schoolers are obtain their diplomas or degree. Texas overall shows there is a high percentage going and graduating college. On the other hand, in the state of Texas, the poverty level of non-graduate is extremely high.
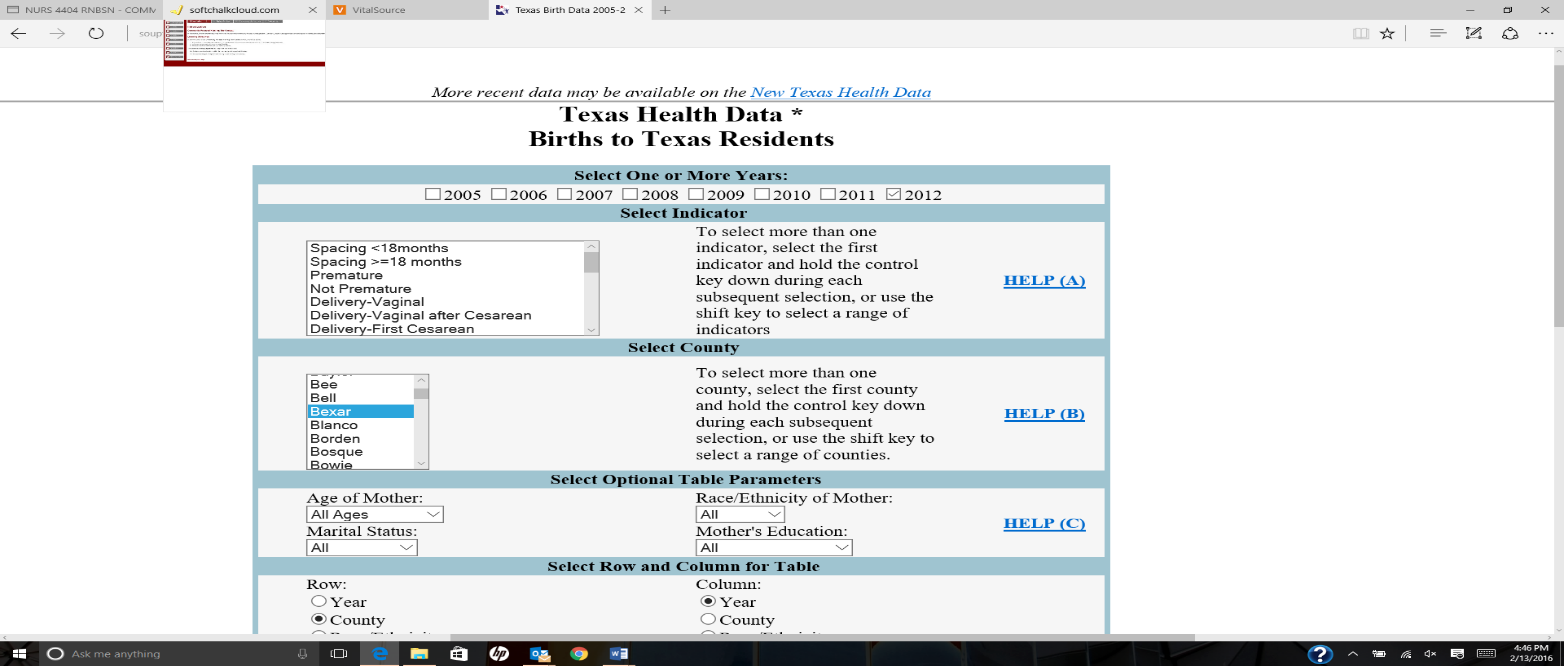
Now we will look at a few vital statistics from the Texas Health Data Site.
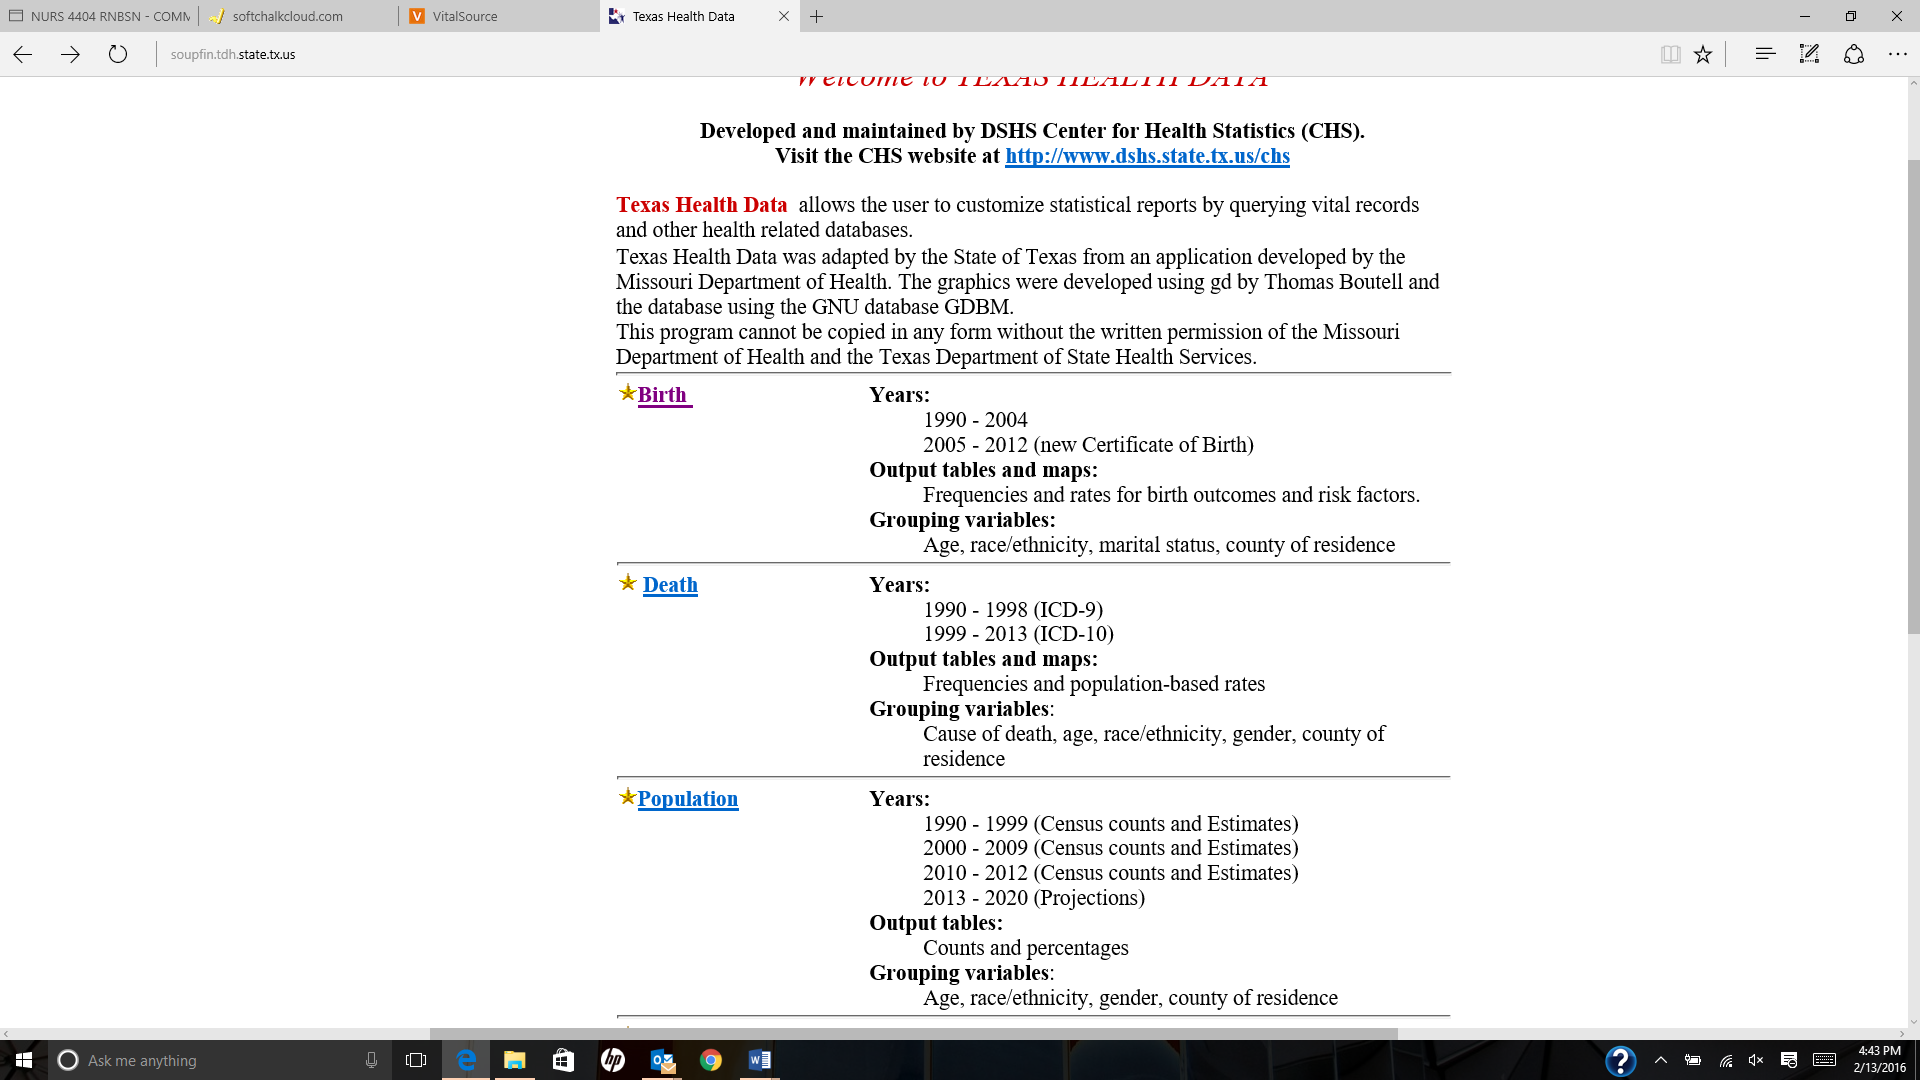
At the bottom of the page there are 2 columns of links. You will select birth and then death data.
(If you live in a state other than Texas, see if you can find it on your state’s health department site. If you can’t, email me and I will help you find it!)
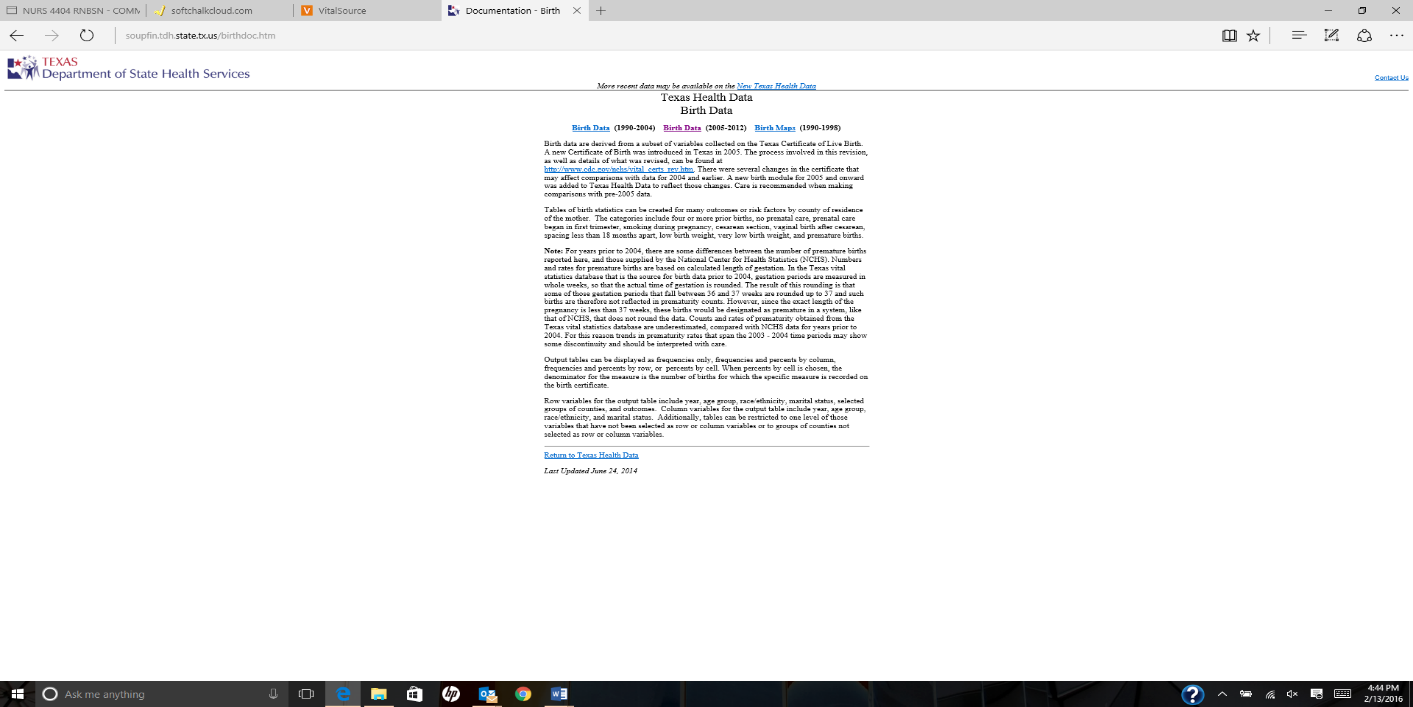
Select Birth Data
Select the 2005-2012 data
Select 2012 and find your county on the drop down menu
Select Submit query at the bottom of the page. Your birth rate will appear.
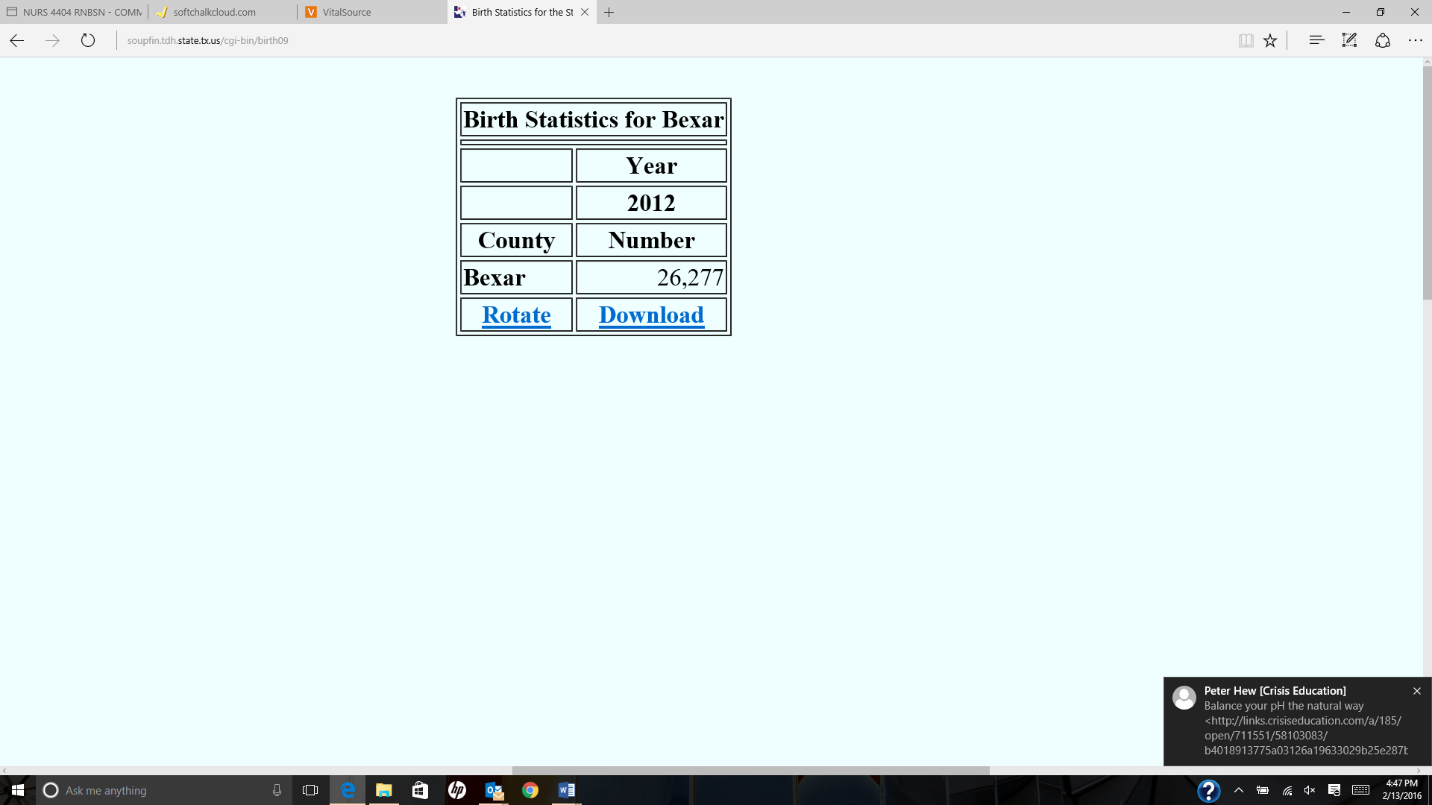
Repeat the process for each of the Rates below
| Birth Rate | 67,354 |
| Death Rate (All causes) | 23,409 |
To search for death by these causes, hold the control key down and click on each of these causes. Select the most recent year and then select submit query. Leave all other settings at the default (the ones already set)
| Death by Causes | County |
| Diabetes | 720 |
| Diseases of the Heart | 5,147 |
| Cardiovascular Disease | 1,222 |
| Influenza and Pneumonia | 383 |
| Accidents | 1,342 |
| Suicide | 431 |
| Homicide | 356 |
Go to http://healthdata.dshs.texas.gov/HealthFactsProfiles
Locate the infant mortality rate
| Infant Mortality Rate | Texas | Percent | County | Percent |
| 2,253 | 5.8 | Harris | 6.8 |
For the county: Go to the top right of the page and click on the “By County” tab, and select your county from the dropdown list on the right side of the page.
For the State information: Go to the top right of the page and click on “By State.”
Infant mortality rates are the single most important determining factor of the health of a population.
At the center of the page, toward the bottom, there is a box that lists the most prevalent communicable diseases. State the one with the highest rate here:
| Communicable disease with most cases | State | County |
| Chlamydia | 125,114 | 23,278 |
Write Vital Statistics Summary Statement
Disease of the Heart is the leading cause of death in Harris county, follow by accident and cardiovascular disease. Influenza and pneumonia rank the lowest.
After completing all of the above tables, indicate at least 2 weaknesses and 2 strengths of your community:
Weaknesses- The weakness is STD’S, Heart disease.
Strengths-Education and income levels
Write Summary Statement
STD’S rank, heart disease, and cardiovascular disease are the highest. As far as STD’S Chlamydia rank the highest of all the communicable diseases.
Community Nursing Diagnosis
Based on the data you collected from your windshield survey and demographic assessments, you are now ready to formulate a community nursing diagnosis. Please see your text, page 49 for more information.
Risk for sexual transmitted disease, among the young to middle age groups, in Houston Texas due to being asymptomatic.
Deficient Knowledge regarding condition in Alief due to social economic.
The format for the diagnosis is the following:
State the problem or risk
State the population affected
State the causative or related factor
An example is:
Risk of learning disabilities among children living in Flint, Michigan, due to severely elevated lead levels in the water supply
Please do not hesitate to ask for assistance in formulating the diagnosis. This is the analyses and synthesis of the entire assessment process you have completed.
There is a great wealth of vital statistic information available which will be helpful to your practice. You were instructed to look at this very small slice in order to make you aware of the resource and to see the impact of specific diseases and condition on the lifespan of your population. You can find more information at the DSHS Health Statistics site.
Select Health Status of Texas, Health Status Supplement, and Texas Health Indicators.
Demographic Assessment Grading Guide| Category | Potential points | Points earned | Comments |
| Each table is complete, or as complete as possible (some information is not available at all levels) | |||
| Population by Age | |||
| Population by Race | |||
| Occupancy Characteristics | |||
| Occupancy | |||
| Income | |||
| Occupation | |||
| Poverty | |||
| Health Insurance | |||
| Education Attainment | |||
| Vital Statistics | |||
| Summary Statement after each table | 20 (2 points per table) | ||
| Identified 2 strengths and 2 weaknesses of the community | 10 | ||
| Community Nursing Diagnosis formulated | 20 | ||
| Total | 100 | ||
20


