etermine your terminal value using a going-out cap rate, then estimate your net sale proceeds. See Real Estate Principles: A Value Approach, Exhitbit 19-3.
| 727 Inc |
727 Inc is a Buffalo Gastropub specializing in craft beer and new age pub food.
Food and BeerWe offer 50 craft beers on tap. 10 of them from local western new York breweries. Our food menu specializes in fresh game burgers. Such as Elk, Venison, Ostrich, Duck and Buffalo Meat. We also have the best mac and cheese in western new York. The award winning recipe can be used to mac any kind of mac and cheese that you can think of. From Jalapeno Cheddar Mac to Lobster to Soft Pretzel Mac. All of which pair nicely with Our craft brew on tap.
30 something financially mobile peopleWe cater to the upwardly mobile 30 something crowd that has a small disposable income and the taste to spend it wisely.
600,000 Financial HighlightsAs you can see from the graph below our first year at 727 Inc has been a great success. Our revenue has climbed to almost 800,000 dollars. B keeping our costs down and using our vendors frugally we have managed to Net over 600,000.
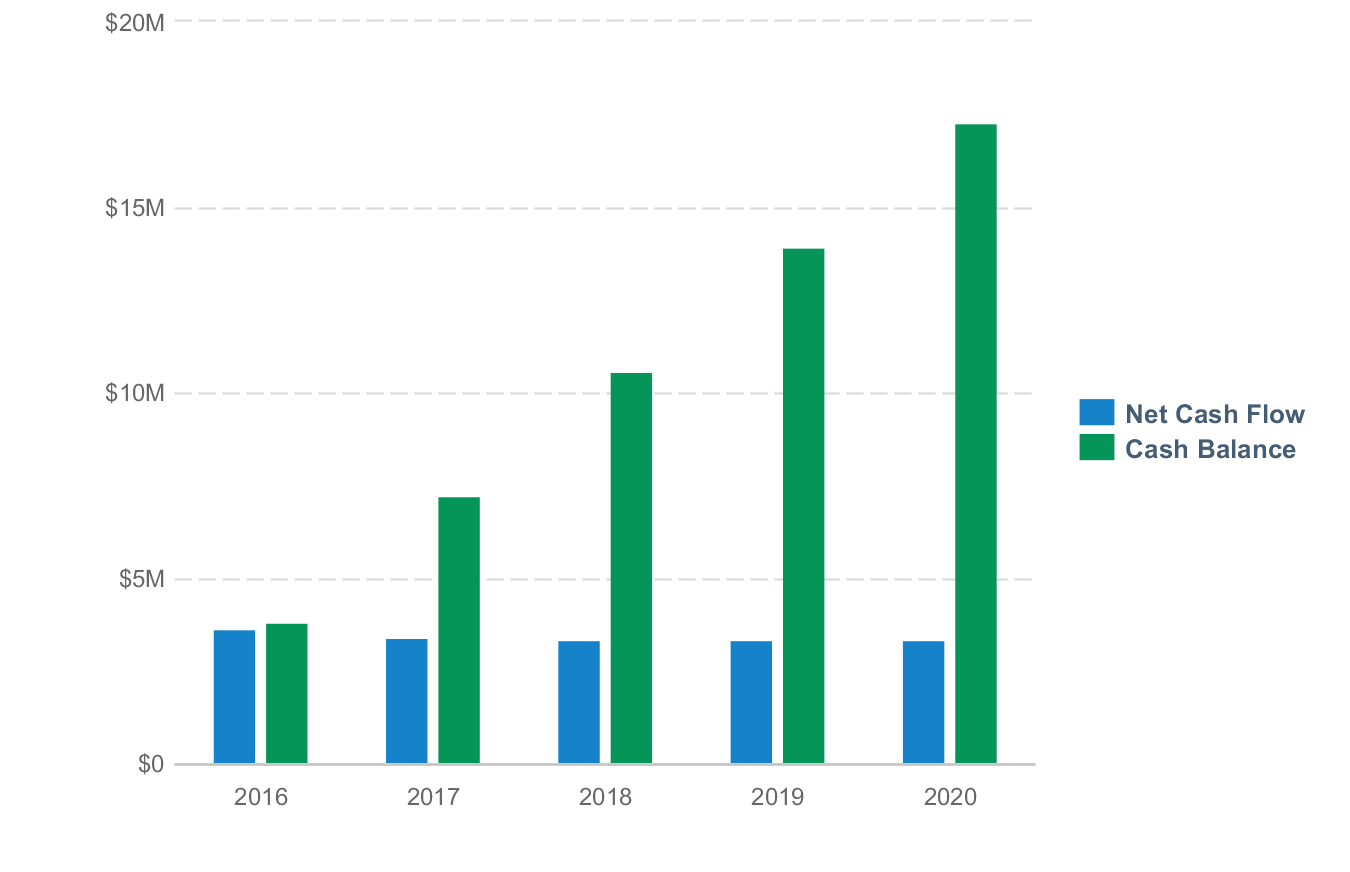
Financial Highlights by Year
The business is already self sufficient having grossed 17K in the first week of operation
Company Company Overview Company History Management Team Products and Services Products and Services Competitors Target Market Market Overview Market Needs Strategy and Implementation Marketing Plan Overview Positioning Pricing Promotion Distribution Milestones| Milestone | Due Date |
| | 2016 | 2017 | 2018 | 2019 | 2020 |
| Revenue | | | | | |
| Test | $761,700 | | | | |
| Credit Card Sales | $3,840,000 | $3,840,000 | $3,840,000 | $3,840,000 | $3,840,000 |
| Total Revenue | $4,601,700 | $3,840,000 | $3,840,000 | $3,840,000 | $3,840,000 |
| Direct Cost | | | | | |
| Gas Bill | $6,000 | $6,000 | $6,000 | $6,000 | $6,000 |
| Mortgage | $102,336 | $102,336 | $102,336 | $102,336 | $102,336 |
| Direct Labor | | | | | |
| Total Direct Cost | $108,336 | $108,336 | $108,336 | $108,336 | $108,336 |
| Gross Margin | $4,493,364 | $3,731,664 | $3,731,664 | $3,731,664 | $3,731,664 |
| Gross Margin % | 98% | 97% | 97% | 97% | 97% |

Our Financial goals are to pay back all of the opening costs associated with getting open. We do expect to turn a solid profit in 9 months. We have used a small budget to advertise on local radio stations as well as the free press that is handed out in the neighborhood.
Personnel Plan Personnel Table| | 2016 | 2017 | 2018 | 2019 | 2020 |
| Pres | $48,000 | $48,000 | $48,000 | $48,000 | $48,000 |
| Total | $48,000 | $48,000 | $48,000 | $48,000 | $48,000 |
| | 2016 | 2017 | 2018 | 2019 | 2020 |
| Operating Expenses | | | | | |
| Salary | $48,000 | $48,000 | $48,000 | $48,000 | $48,000 |
| Employee Related Expenses | $9,600 | $9,600 | $9,600 | $9,600 | $9,600 |
| Utilities | $19,200 | $19,200 | $19,200 | $19,200 | $19,200 |
| Office Supplies | | | | | |
| Insurance | $1,800 | $1,800 | $1,800 | $1,800 | $1,800 |
| Total Operating Expenses | $78,600 | $78,600 | $78,600 | $78,600 | $78,600 |

| Assets | |
| Cash | $200,000 |
| Accounts Receivable | $0 |
| Inventory | $80,000 |
| Long-Term Assets | $150,000 |
| Accumulated Depreciation | $0 |
| | |
| Liabilities | |
| Accounts Payable | |
| Corporate Taxes Payable | |
| Sales Taxes Payable | $15,000 |
| Short-Term Debt | |
| Long-Term Debt | |
| | |
| Capital | |
| Paid-In Capital | |
| Retained Earnings | $415,000 |
| | |
| | |
| Cash Inflow | |
| % of Sales on Credit | 100% |
| Avg Collection Period (Days) | 30 |
| Cash Outflow | |
| % of Purchases on Credit | 83% |
| Avg Payment Delay (Days) | 15 |
| Inventory | |
| Months to Keep on Hand | 0 |
| Minimum Inventory Purchase | $0 |
| | 2016 | 2017 | 2018 | 2019 | 2020 |
| Total Amount Received | | | | | |
| | 2016 | 2017 | 2018 | 2019 | 2020 |
| Revenue | $4,601,700 | $3,840,000 | $3,840,000 | $3,840,000 | $3,840,000 |
| | | | | | |
| Direct Costs | $108,336 | $108,336 | $108,336 | $108,336 | $108,336 |
| | | | | | |
| Gross Margin | $4,493,364 | $3,731,664 | $3,731,664 | $3,731,664 | $3,731,664 |
| Gross Margin % | 98% | 97% | 97% | 97% | 97% |
| Operating Expenses | | | | | |
| Salary | $48,000 | $48,000 | $48,000 | $48,000 | $48,000 |
| Employee Related Expenses | $9,600 | $9,600 | $9,600 | $9,600 | $9,600 |
| Utilities | $19,200 | $19,200 | $19,200 | $19,200 | $19,200 |
| Office Supplies | | | | | |
| Insurance | $1,800 | $1,800 | $1,800 | $1,800 | $1,800 |
| Total Operating Expenses | $78,600 | $78,600 | $78,600 | $78,600 | $78,600 |
| | | | | | |
| Operating Income | $4,414,764 | $3,653,064 | $3,653,064 | $3,653,064 | $3,653,064 |
| | | | | | |
| Interest Incurred | | | | | |
| Depreciation and Amortization | $30,000 | $30,000 | $30,000 | $30,000 | $30,000 |
| Income Taxes | $383,667 | $317,018 | $317,018 | $317,018 | $317,018 |
| Total Expenses | $600,603 | $533,954 | $533,954 | $533,954 | $533,954 |
| Net Profit | $4,001,097 | $3,306,046 | $3,306,046 | $3,306,046 | $3,306,046 |
| Net Profit / Sales | 87% | 86% | 86% | 86% | 86% |


| As of Period's End | Starting Balances | 2016 | 2017 | 2018 | 2019 | 2020 |
| Cash | $200,000 | $3,840,757 | $7,263,031 | $10,599,074 | $13,935,117 | $17,271,160 |
| Accounts Receivable | $0 | $414,500 | $320,000 | $320,000 | $320,000 | $320,000 |
| Inventory | $80,000 | $80,000 | $80,000 | $80,000 | $80,000 | $80,000 |
| Other Current Assets | | | | | | |
| Total Current Assets | $280,000 | $4,335,257 | $7,663,031 | $10,999,074 | $14,335,117 | $17,671,160 |
| | | | | | | |
| Long-Term Assets | $150,000 | $150,000 | $150,000 | $150,000 | $150,000 | $150,000 |
| Accumulated Depreciation | $0 | ($30,000) | ($60,000) | ($90,000) | ($120,000) | ($150,000) |
| Total Long-Term Assets | $150,000 | $120,000 | $90,000 | $60,000 | $30,000 | $0 |
| | | | | | | |
| Total Assets | $430,000 | $4,455,257 | $7,753,031 | $11,059,074 | $14,365,117 | $17,671,160 |
| | | | | | | |
| Accounts Payable | | $4,473 | $4,470 | $4,467 | $4,464 | $4,461 |
| Income Taxes Payable | | $34,687 | $26,418 | $26,418 | $26,418 | $26,418 |
| Sales Taxes Payable | $15,000 | $0 | $0 | $0 | $0 | $0 |
| Short-Term Debt | | | | | | |
| Prepaid Revenue | | | | | | |
| Total Current Liabilities | $15,000 | $39,160 | $30,888 | $30,885 | $30,882 | $30,879 |
| Long-Term Debt | | | | | | |
| | | | | | | |
| Total Liabilities | $15,000 | $39,160 | $30,888 | $30,885 | $30,882 | $30,879 |
| | | | | | | |
| Paid-in Capital | | | | | | |
| Retained Earnings | $415,000 | $415,000 | $4,416,097 | $7,722,143 | $11,028,189 | $14,334,235 |
| Earnings | | $4,001,097 | $3,306,046 | $3,306,046 | $3,306,046 | $3,306,046 |
| Total Owner's Equity | $415,000 | $4,416,097 | $7,722,143 | $11,028,189 | $14,334,235 | $17,640,281 |
| | | | | | | |
| Total Liabilities & Equity | $430,000 | $4,455,257 | $7,753,031 | $11,059,074 | $14,365,117 | $17,671,160 |
| | 2016 | 2017 | 2018 | 2019 | 2020 |
| Net Cash Flow from Operations | | | | | |
| Net Profit | $4,001,097 | $3,306,046 | $3,306,046 | $3,306,046 | $3,306,046 |
| Depreciation and Amortization | $30,000 | $30,000 | $30,000 | $30,000 | $30,000 |
| Change in Accounts Receivable | ($414,500) | $94,500 | $0 | $0 | $0 |
| Change in Inventory | $0 | $0 | $0 | $0 | $0 |
| Change in Accounts Payable | $4,473 | ($3) | ($3) | ($3) | ($3) |
| Change in Income Tax Payable | $34,687 | ($8,269) | $0 | $0 | $0 |
| Change in Sales Tax Payable | ($15,000) | $0 | $0 | $0 | $0 |
| Change in Prepaid Revenue | | | | | |
| Net Cash Flow from Operations | $3,640,757 | $3,422,274 | $3,336,043 | $3,336,043 | $3,336,043 |
| Investing & Financing | | | | | |
| Assets Purchased or Sold | | | | | |
| Investments Received | | | | | |
| Change in Long-Term Debt | | | | | |
| Change in Short-Term Debt | | | | | |
| Dividends & Distributions | | | | | |
| Net Cash Flow from Investing & Financing | | | | | |
| Cash at Beginning of Period | $200,000 | $3,840,757 | $7,263,031 | $10,599,074 | $13,935,117 |
| Net Change in Cash | $3,640,757 | $3,422,274 | $3,336,043 | $3,336,043 | $3,336,043 |
| Cash at End of Period | $3,840,757 | $7,263,031 | $10,599,074 | $13,935,117 | $17,271,160 |

| 2016 | Jan '16 | Feb '16 | Mar '16 | Apr '16 | May '16 | Jun '16 | Jul '16 | Aug '16 | Sep '16 | Oct '16 | Nov '16 | Dec '16 |
| Revenue | | | | | | | | | | | | |
| Test | $38,700 | $38,700 | $41,300 | $45,500 | $53,200 | $58,700 | $69,400 | $74,900 | $75,700 | $83,400 | $87,700 | $94,500 |
| Credit Card Sales | $320,000 | $320,000 | $320,000 | $320,000 | $320,000 | $320,000 | $320,000 | $320,000 | $320,000 | $320,000 | $320,000 | $320,000 |
| Total Revenue | $358,700 | $358,700 | $361,300 | $365,500 | $373,200 | $378,700 | $389,400 | $394,900 | $395,700 | $403,400 | $407,700 | $414,500 |
| Direct Cost | | | | | | | | | | | | |
| Gas Bill | $500 | $500 | $500 | $500 | $500 | $500 | $500 | $500 | $500 | $500 | $500 | $500 |
| Mortgage | $8,528 | $8,528 | $8,528 | $8,528 | $8,528 | $8,528 | $8,528 | $8,528 | $8,528 | $8,528 | $8,528 | $8,528 |
| Direct Labor | | | | | | | | | | | | |
| Total Direct Cost | $9,028 | $9,028 | $9,028 | $9,028 | $9,028 | $9,028 | $9,028 | $9,028 | $9,028 | $9,028 | $9,028 | $9,028 |
| Gross Margin | $349,672 | $349,672 | $352,272 | $356,472 | $364,172 | $369,672 | $380,372 | $385,872 | $386,672 | $394,372 | $398,672 | $405,472 |
| Gross Margin % | 97% | 97% | 98% | 98% | 98% | 98% | 98% | 98% | 98% | 98% | 98% | 98% |
| | 2016 | 2017 | 2018 | 2019 | 2020 |
| Revenue | | | | | |
| Test | $761,700 | | | | |
| Credit Card Sales | $3,840,000 | $3,840,000 | $3,840,000 | $3,840,000 | $3,840,000 |
| Total Revenue | $4,601,700 | $3,840,000 | $3,840,000 | $3,840,000 | $3,840,000 |
| Direct Cost | | | | | |
| Gas Bill | $6,000 | $6,000 | $6,000 | $6,000 | $6,000 |
| Mortgage | $102,336 | $102,336 | $102,336 | $102,336 | $102,336 |
| Direct Labor | | | | | |
| Total Direct Cost | $108,336 | $108,336 | $108,336 | $108,336 | $108,336 |
| Gross Margin | $4,493,364 | $3,731,664 | $3,731,664 | $3,731,664 | $3,731,664 |
| Gross Margin % | 98% | 97% | 97% | 97% | 97% |
| 2016 | Jan '16 | Feb '16 | Mar '16 | Apr '16 | May '16 | Jun '16 | Jul '16 | Aug '16 | Sep '16 | Oct '16 | Nov '16 | Dec '16 |
| Pres | $4,000 | $4,000 | $4,000 | $4,000 | $4,000 | $4,000 | $4,000 | $4,000 | $4,000 | $4,000 | $4,000 | $4,000 |
| Total | $4,000 | $4,000 | $4,000 | $4,000 | $4,000 | $4,000 | $4,000 | $4,000 | $4,000 | $4,000 | $4,000 | $4,000 |
| | 2016 | 2017 | 2018 | 2019 | 2020 |
| Pres | $48,000 | $48,000 | $48,000 | $48,000 | $48,000 |
| Total | $48,000 | $48,000 | $48,000 | $48,000 | $48,000 |
| 2016 | Jan '16 | Feb '16 | Mar '16 | Apr '16 | May '16 | Jun '16 | Jul '16 | Aug '16 | Sep '16 | Oct '16 | Nov '16 | Dec '16 |
| Operating Expenses | | | | | | | | | | | | |
| Salary | $4,000 | $4,000 | $4,000 | $4,000 | $4,000 | $4,000 | $4,000 | $4,000 | $4,000 | $4,000 | $4,000 | $4,000 |
| Employee Related Expenses | $800 | $800 | $800 | $800 | $800 | $800 | $800 | $800 | $800 | $800 | $800 | $800 |
| Utilities | $1,600 | $1,600 | $1,600 | $1,600 | $1,600 | $1,600 | $1,600 | $1,600 | $1,600 | $1,600 | $1,600 | $1,600 |
| Office Supplies | | | | | | | | | | | | |
| Insurance | $150 | $150 | $150 | $150 | $150 | $150 | $150 | $150 | $150 | $150 | $150 | $150 |
| Total Operating Expenses | $6,550 | $6,550 | $6,550 | $6,550 | $6,550 | $6,550 | $6,550 | $6,550 | $6,550 | $6,550 | $6,550 | $6,550 |
| | 2016 | 2017 | 2018 | 2019 | 2020 |
| Operating Expenses | | | | | |
| Salary | $48,000 | $48,000 | $48,000 | $48,000 | $48,000 |
| Employee Related Expenses | $9,600 | $9,600 | $9,600 | $9,600 | $9,600 |
| Utilities | $19,200 | $19,200 | $19,200 | $19,200 | $19,200 |
| Office Supplies | | | | | |
| Insurance | $1,800 | $1,800 | $1,800 | $1,800 | $1,800 |
| Total Operating Expenses | $78,600 | $78,600 | $78,600 | $78,600 | $78,600 |
| 2016 | Jan '16 | Feb '16 | Mar '16 | Apr '16 | May '16 | Jun '16 | Jul '16 | Aug '16 | Sep '16 | Oct '16 | Nov '16 | Dec '16 |
| Total Amount Received | | | | | | | | | | | | |
| | 2016 | 2017 | 2018 | 2019 | 2020 |
| Total Amount Received | | | | | |
| 2016 | Jan '16 | Feb '16 | Mar '16 | Apr '16 | May '16 | Jun '16 | Jul '16 | Aug '16 | Sep '16 | Oct '16 | Nov '16 | Dec '16 |
| Revenue | $358,700 | $358,700 | $361,300 | $365,500 | $373,200 | $378,700 | $389,400 | $394,900 | $395,700 | $403,400 | $407,700 | $414,500 |
| | | | | | | | | | | | | |
| Direct Costs | $9,028 | $9,028 | $9,028 | $9,028 | $9,028 | $9,028 | $9,028 | $9,028 | $9,028 | $9,028 | $9,028 | $9,028 |
| | | | | | | | | | | | | |
| Gross Margin | $349,672 | $349,672 | $352,272 | $356,472 | $364,172 | $369,672 | $380,372 | $385,872 | $386,672 | $394,372 | $398,672 | $405,472 |
| Gross Margin % | 97% | 97% | 98% | 98% | 98% | 98% | 98% | 98% | 98% | 98% | 98% | 98% |
| Operating Expenses | | | | | | | | | | | | |
| Salary | $4,000 | $4,000 | $4,000 | $4,000 | $4,000 | $4,000 | $4,000 | $4,000 | $4,000 | $4,000 | $4,000 | $4,000 |
| Employee Related Expenses | $800 | $800 | $800 | $800 | $800 | $800 | $800 | $800 | $800 | $800 | $800 | $800 |
| Utilities | $1,600 | $1,600 | $1,600 | $1,600 | $1,600 | $1,600 | $1,600 | $1,600 | $1,600 | $1,600 | $1,600 | $1,600 |
| Office Supplies | | | | | | | | | | | | |
| Insurance | $150 | $150 | $150 | $150 | $150 | $150 | $150 | $150 | $150 | $150 | $150 | $150 |
| Total Operating Expenses | $6,550 | $6,550 | $6,550 | $6,550 | $6,550 | $6,550 | $6,550 | $6,550 | $6,550 | $6,550 | $6,550 | $6,550 |
| | | | | | | | | | | | | |
| Operating Income | $343,122 | $343,122 | $345,722 | $349,922 | $357,622 | $363,122 | $373,822 | $379,322 | $380,122 | $387,822 | $392,122 | $398,922 |
| | | | | | | | | | | | | |
| Interest Incurred | | | | | | | | | | | | |
| Depreciation and Amortization | $2,500 | $2,500 | $2,500 | $2,500 | $2,500 | $2,500 | $2,500 | $2,500 | $2,500 | $2,500 | $2,500 | $2,500 |
| Income Taxes | $29,804 | $29,805 | $30,032 | $30,399 | $31,073 | $31,555 | $32,490 | $32,972 | $33,042 | $33,716 | $34,092 | $34,687 |
| Total Expenses | $47,882 | $47,883 | $48,110 | $48,477 | $49,151 | $49,633 | $50,568 | $51,050 | $51,120 | $51,794 | $52,170 | $52,765 |
| Net Profit | $310,818 | $310,817 | $313,190 | $317,023 | $324,049 | $329,067 | $338,832 | $343,850 | $344,580 | $351,606 | $355,530 | $361,735 |
| Net Profit / Sales | 87% | 87% | 87% | 87% | 87% | 87% | 87% | 87% | 87% | 87% | 87% | 87% |
| | 2016 | 2017 | 2018 | 2019 | 2020 |
| Revenue | $4,601,700 | $3,840,000 | $3,840,000 | $3,840,000 | $3,840,000 |
| | | | | | |
| Direct Costs | $108,336 | $108,336 | $108,336 | $108,336 | $108,336 |
| | | | | | |
| Gross Margin | $4,493,364 | $3,731,664 | $3,731,664 | $3,731,664 | $3,731,664 |
| Gross Margin % | 98% | 97% | 97% | 97% | 97% |
| Operating Expenses | | | | | |
| Salary | $48,000 | $48,000 | $48,000 | $48,000 | $48,000 |
| Employee Related Expenses | $9,600 | $9,600 | $9,600 | $9,600 | $9,600 |
| Utilities | $19,200 | $19,200 | $19,200 | $19,200 | $19,200 |
| Office Supplies | | | | | |
| Insurance | $1,800 | $1,800 | $1,800 | $1,800 | $1,800 |
| Total Operating Expenses | $78,600 | $78,600 | $78,600 | $78,600 | $78,600 |
| | | | | | |
| Operating Income | $4,414,764 | $3,653,064 | $3,653,064 | $3,653,064 | $3,653,064 |
| | | | | | |
| Interest Incurred | | | | | |
| Depreciation and Amortization | $30,000 | $30,000 | $30,000 | $30,000 | $30,000 |
| Income Taxes | $383,667 | $317,018 | $317,018 | $317,018 | $317,018 |
| Total Expenses | $600,603 | $533,954 | $533,954 | $533,954 | $533,954 |
| Net Profit | $4,001,097 | $3,306,046 | $3,306,046 | $3,306,046 | $3,306,046 |
| Net Profit / Sales | 87% | 86% | 86% | 86% | 86% |
| As of Period's End | Starting Balances | Jan '16 | Feb '16 | Mar '16 | Apr '16 | May '16 | Jun '16 | Jul '16 | Aug '16 | Sep '16 | Oct '16 | Nov '16 | Dec '16 |
| Cash | $200,000 | $173,895 | $487,213 | $800,530 | $1,116,220 | $1,435,743 | $1,762,292 | $2,093,859 | $2,435,191 | $2,781,541 | $3,128,621 | $3,482,727 | $3,840,757 |
| Accounts Receivable | $0 | $358,700 | $358,700 | $361,300 | $365,500 | $373,200 | $378,700 | $389,400 | $394,900 | $395,700 | $403,400 | $407,700 | $414,500 |
| Inventory | $80,000 | $80,000 | $80,000 | $80,000 | $80,000 | $80,000 | $80,000 | $80,000 | $80,000 | $80,000 | $80,000 | $80,000 | $80,000 |
| Other Current Assets | | | | | | | | | | | | | |
| Total Current Assets | $280,000 | $612,595 | $925,913 | $1,241,830 | $1,561,720 | $1,888,943 | $2,220,992 | $2,563,259 | $2,910,091 | $3,257,241 | $3,612,021 | $3,970,427 | $4,335,257 |
| | | | | | | | | | | | | | |
| Long-Term Assets | $150,000 | $150,000 | $150,000 | $150,000 | $150,000 | $150,000 | $150,000 | $150,000 | $150,000 | $150,000 | $150,000 | $150,000 | $150,000 |
| Accumulated Depreciation | $0 | ($2,500) | ($5,000) | ($7,500) | ($10,000) | ($12,500) | ($15,000) | ($17,500) | ($20,000) | ($22,500) | ($25,000) | ($27,500) | ($30,000) |
| Total Long-Term Assets | $150,000 | $147,500 | $145,000 | $142,500 | $140,000 | $137,500 | $135,000 | $132,500 | $130,000 | $127,500 | $125,000 | $122,500 | $120,000 |
| | | | | | | | | | | | | | |
| Total Assets | $430,000 | $760,095 | $1,070,913 | $1,384,330 | $1,701,720 | $2,026,443 | $2,355,992 | $2,695,759 | $3,040,091 | $3,384,741 | $3,737,021 | $4,092,927 | $4,455,257 |
| | | | | | | | | | | | | | |
| Accounts Payable | | $4,473 | $4,473 | $4,473 | $4,473 | $4,473 | $4,473 | $4,473 | $4,473 | $4,473 | $4,473 | $4,473 | $4,473 |
| Income Taxes Payable | | $29,804 | $29,805 | $30,032 | $30,399 | $31,073 | $31,555 | $32,490 | $32,972 | $33,042 | $33,716 | $34,092 | $34,687 |
| Sales Taxes Payable | $15,000 | $0 | $0 | $0 | $0 | $0 | $0 | $0 | $0 | $0 | $0 | $0 | $0 |
| Short-Term Debt | | | | | | | | | | | | | |
| Prepaid Revenue | | | | | | | | | | | | | |
| Total Current Liabilities | $15,000 | $34,277 | $34,278 | $34,505 | $34,872 | $35,546 | $36,028 | $36,963 | $37,445 | $37,515 | $38,189 | $38,565 | $39,160 |
| Long-Term Debt | | | | | | | | | | | | | |
| | | | | | | | | | | | | | |
| Total Liabilities | $15,000 | $34,277 | $34,278 | $34,505 | $34,872 | $35,546 | $36,028 | $36,963 | $37,445 | $37,515 | $38,189 | $38,565 | $39,160 |
| | | | | | | | | | | | | | |
| Paid-in Capital | | | | | | | | | | | | | |
| Retained Earnings | $415,000 | $415,000 | $415,000 | $415,000 | $415,000 | $415,000 | $415,000 | $415,000 | $415,000 | $415,000 | $415,000 | $415,000 | $415,000 |
| Earnings | | $310,818 | $621,635 | $934,825 | $1,251,848 | $1,575,897 | $1,904,964 | $2,243,796 | $2,587,646 | $2,932,226 | $3,283,832 | $3,639,362 | $4,001,097 |
| Total Owner's Equity | $415,000 | $725,818 | $1,036,635 | $1,349,825 | $1,666,848 | $1,990,897 | $2,319,964 | $2,658,796 | $3,002,646 | $3,347,226 | $3,698,832 | $4,054,362 | $4,416,097 |
| | | | | | | | | | | | | | |
| Total Liabilities & Equity | $430,000 | $760,095 | $1,070,913 | $1,384,330 | $1,701,720 | $2,026,443 | $2,355,992 | $2,695,759 | $3,040,091 | $3,384,741 | $3,737,021 | $4,092,927 | $4,455,257 |
| As of Period's End | Starting Balances | 2016 | 2017 | 2018 | 2019 | 2020 |
| Cash | $200,000 | $3,840,757 | $7,263,031 | $10,599,074 | $13,935,117 | $17,271,160 |
| Accounts Receivable | $0 | $414,500 | $320,000 | $320,000 | $320,000 | $320,000 |
| Inventory | $80,000 | $80,000 | $80,000 | $80,000 | $80,000 | $80,000 |
| Other Current Assets | | | | | | |
| Total Current Assets | $280,000 | $4,335,257 | $7,663,031 | $10,999,074 | $14,335,117 | $17,671,160 |
| | | | | | | |
| Long-Term Assets | $150,000 | $150,000 | $150,000 | $150,000 | $150,000 | $150,000 |
| Accumulated Depreciation | $0 | ($30,000) | ($60,000) | ($90,000) | ($120,000) | ($150,000) |
| Total Long-Term Assets | $150,000 | $120,000 | $90,000 | $60,000 | $30,000 | $0 |
| | | | | | | |
| Total Assets | $430,000 | $4,455,257 | $7,753,031 | $11,059,074 | $14,365,117 | $17,671,160 |
| | | | | | | |
| Accounts Payable | | $4,473 | $4,470 | $4,467 | $4,464 | $4,461 |
| Income Taxes Payable | | $34,687 | $26,418 | $26,418 | $26,418 | $26,418 |
| Sales Taxes Payable | $15,000 | $0 | $0 | $0 | $0 | $0 |
| Short-Term Debt | | | | | | |
| Prepaid Revenue | | | | | | |
| Total Current Liabilities | $15,000 | $39,160 | $30,888 | $30,885 | $30,882 | $30,879 |
| Long-Term Debt | | | | | | |
| | | | | | | |
| Total Liabilities | $15,000 | $39,160 | $30,888 | $30,885 | $30,882 | $30,879 |
| | | | | | | |
| Paid-in Capital | | | | | | |
| Retained Earnings | $415,000 | $415,000 | $4,416,097 | $7,722,143 | $11,028,189 | $14,334,235 |
| Earnings | | $4,001,097 | $3,306,046 | $3,306,046 | $3,306,046 | $3,306,046 |
| Total Owner's Equity | $415,000 | $4,416,097 | $7,722,143 | $11,028,189 | $14,334,235 | $17,640,281 |
| | | | | | | |
| Total Liabilities & Equity | $430,000 | $4,455,257 | $7,753,031 | $11,059,074 | $14,365,117 | $17,671,160 |
| 2016 | Jan '16 | Feb '16 | Mar '16 | Apr '16 | May '16 | Jun '16 | Jul '16 | Aug '16 | Sep '16 | Oct '16 | Nov '16 | Dec '16 |
| Net Cash Flow from Operations | | | | | | | | | | | | |
| Net Profit | $310,818 | $310,817 | $313,190 | $317,023 | $324,049 | $329,067 | $338,832 | $343,850 | $344,580 | $351,606 | $355,530 | $361,735 |
| Depreciation and Amortization | $2,500 | $2,500 | $2,500 | $2,500 | $2,500 | $2,500 | $2,500 | $2,500 | $2,500 | $2,500 | $2,500 | $2,500 |
| Change in Accounts Receivable | ($358,700) | $0 | ($2,600) | ($4,200) | ($7,700) | ($5,500) | ($10,700) | ($5,500) | ($800) | ($7,700) | ($4,300) | ($6,800) |
| Change in Inventory | $0 | $0 | $0 | $0 | $0 | $0 | $0 | $0 | $0 | $0 | $0 | $0 |
| Change in Accounts Payable | $4,473 | $0 | $0 | $0 | $0 | $0 | $0 | $0 | $0 | $0 | $0 | $0 |
| Change in Income Tax Payable | $29,804 | $1 | $227 | $367 | $674 | $482 | $935 | $482 | $70 | $674 | $376 | $595 |
| Change in Sales Tax Payable | ($15,000) | $0 | $0 | $0 | $0 | $0 | $0 | $0 | $0 | $0 | $0 | $0 |
| Change in Prepaid Revenue | | | | | | | | | | | | |
| Net Cash Flow from Operations | ($26,105) | $313,318 | $313,317 | $315,690 | $319,523 | $326,549 | $331,567 | $341,332 | $346,350 | $347,080 | $354,106 | $358,030 |
| Investing & Financing | | | | | | | | | | | | |
| Assets Purchased or Sold | | | | | | | | | | | | |
| Investments Received | | | | | | | | | | | | |
| Change in Long-Term Debt | | | | | | | | | | | | |
| Change in Short-Term Debt | | | | | | | | | | | | |
| Dividends & Distributions | | | | | | | | | | | | |
| Net Cash Flow from Investing & Financing | | | | | | | | | | | | |
| Cash at Beginning of Period | $200,000 | $173,895 | $487,213 | $800,530 | $1,116,220 | $1,435,743 | $1,762,292 | $2,093,859 | $2,435,191 | $2,781,541 | $3,128,621 | $3,482,727 |
| Net Change in Cash | ($26,105) | $313,318 | $313,317 | $315,690 | $319,523 | $326,549 | $331,567 | $341,332 | $346,350 | $347,080 | $354,106 | $358,030 |
| Cash at End of Period | $173,895 | $487,213 | $800,530 | $1,116,220 | $1,435,743 | $1,762,292 | $2,093,859 | $2,435,191 | $2,781,541 | $3,128,621 | $3,482,727 | $3,840,757 |
| | 2016 | 2017 | 2018 | 2019 | 2020 |
| Net Cash Flow from Operations | | | | | |
| Net Profit | $4,001,097 | $3,306,046 | $3,306,046 | $3,306,046 | $3,306,046 |
| Depreciation and Amortization | $30,000 | $30,000 | $30,000 | $30,000 | $30,000 |
| Change in Accounts Receivable | ($414,500) | $94,500 | $0 | $0 | $0 |
| Change in Inventory | $0 | $0 | $0 | $0 | $0 |
| Change in Accounts Payable | $4,473 | ($3) | ($3) | ($3) | ($3) |
| Change in Income Tax Payable | $34,687 | ($8,269) | $0 | $0 | $0 |
| Change in Sales Tax Payable | ($15,000) | $0 | $0 | $0 | $0 |
| Change in Prepaid Revenue | | | | | |
| Net Cash Flow from Operations | $3,640,757 | $3,422,274 | $3,336,043 | $3,336,043 | $3,336,043 |
| Investing & Financing | | | | | |
| Assets Purchased or Sold | | | | | |
| Investments Received | | | | | |
| Change in Long-Term Debt | | | | | |
| Change in Short-Term Debt | | | | | |
| Dividends & Distributions | | | | | |
| Net Cash Flow from Investing & Financing | | | | | |
| Cash at Beginning of Period | $200,000 | $3,840,757 | $7,263,031 | $10,599,074 | $13,935,117 |
| Net Change in Cash | $3,640,757 | $3,422,274 | $3,336,043 | $3,336,043 | $3,336,043 |
| Cash at End of Period | $3,840,757 | $7,263,031 | $10,599,074 | $13,935,117 | $17,271,160 |
| 22 |
CONFIDENTIAL - DO NOT DISSEMINATE. This business plan contains confidential, trade-secret information and is shared only with the understanding that you will not share its contents or ideas with third parties without the express written consent of the plan author.


