FORmadam-professor
DUE ON LAST DAY OF CLASS
COPY/PAST THIS UNDER WEEK #4 ASSIGNMENT AND THEN SUBMIT TO THE WEEK 4 DROPBOX
Extra Credit
Worth Up to 12 Points
Note: There are three overall questions with sub-questions, and each overall question is worth up to4 points.
Overview
Given the current economy, where employees are asked to do more with less, job stress is at an all time high. An organization wished to determine what factors in the work environment were causing the most job stress.
A six-item survey was administered to sample 202 employees. The survey was measured on the following scale:
| Scale | Code |
| Strongly Agree | 5 |
| Agree | 4 |
| Neutral | 3 |
| Dis- Agree | 2 |
| Strongly Disagree | 1 |
The scale is treated as an “interval” scale, so the “mean”, or “average” are calculated. Means can range from 1 to 5. The higher the number, the more favorable.
The word Favorable refers to those who Strongly Agree or Agree.
Below is each question. Employees rated each one using the scale above.
| Q1. | I have the resources I need (e.g., tools, equipment, supplies, personnel) to do my job effectively. (RESOURCES) |
| Q2. | Policies and programs help me balance my work and personal commitments. (WORKLIFE) |
| Q3. | I am satisfied with my involvement in decisions that affect me. (INVOLVEMENT) |
| Q4. | I have the opportunities to learn and grow in my job. (LEARN) |
| Q5. | I am satisfied with my total compensation (pay, benefits). (REWARDS) |
| Q6. | The amount of stress I experience on the job is reasonable. (STRESS) |
1. Below is computer output from SPSS, the package used in the text. The table below has descriptive statistics for each variable measured the 5-point scale, with 5 being “Strongly Agree” and 1 being “Strongly Disagree” (Favorable = “SA or A”
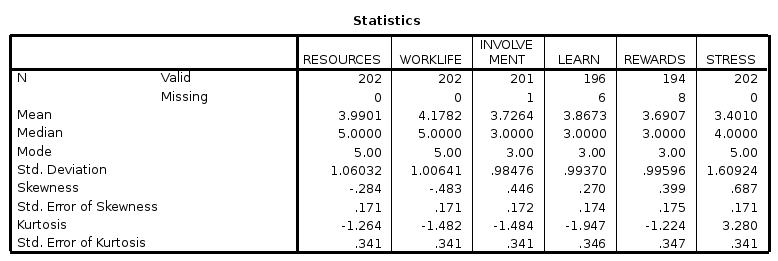
1a. Which variable is has the most favorable rating? (1 pt)
b. Which variable has the most variation in the response? (1 pt)
c. Below is a frequency distribution of the stress variable.
STRESS
|
| Frequency | Percent | Cumulative Percent | |
| Valid | 1.00 | 37 | 18.3 | 18.3 |
|
| 2.00 | 20 | 9.9 | 28.2 |
|
| 3.00 | 45 | 22.3 | 50.5 |
|
| 4.00 | 45 | 22.3 | 72.8 |
|
| 5.00 | 55 | 27.2 | 100.0 |
|
| Total | 202 | 100.0 |
|
What percentage of respondents “Strongly Agree/Agree” with their stress level being reasonable? (One number) (1 pt)
What percentage of respondents “Strongly Disagree/ Disagree” with their stress level being reasonable? (One number) (1 pt)
2. In addition to the survey items, respondents were asked to report their age as follows:
| My generation is (AGE) | Generation Y (Born 1981-2000) | |
|
| Generation X (Born 1965-1980) | |
|
| Baby Boomers (1946-1964) | |
|
| Veterans (Born 1922-1945) |
Below is output from an ANOVA to test if there are differences in stress levels between age groups.
What was is the null hypothesis?
What is the alternative hypothesis?
Below are summary statistics for
STRESS
|
| Mean | Std. Deviation | Std. Error | 95% Confidence Interval for Mean | Minimum | Maximum | ||
| Lower Bound | Upper Bound | |||||||
| 1.00 | 83 | 4.1325 | 1.39486 | .15311 | 3.8280 | 4.4371 | 1.00 | 11.00 |
| 2.00 | 45 | 3.0444 | 1.39733 | .20830 | 2.6246 | 3.4642 | 1.00 | 5.00 |
| 3.00 | 37 | 2.4595 | 2.06283 | .33913 | 1.7717 | 3.1472 | 1.00 | 11.00 |
| 4.00 | 37 | 3.1351 | 1.00449 | .16514 | 2.8002 | 3.4701 | 1.00 | 5.00 |
| Total | 202 | 3.4010 | 1.60924 | .11323 | 3.1777 | 3.6243 | 1.00 | 11.00 |
Which group has the lowest stress level? (1 pt)
Which group has the highest stress level? (1 pt)
Which group has the most variation in stress level? (1 pt)
Below is the ANOVA output.
ANOVA
STRESS
|
| Sum of Squares | df | Mean Square | Sig. (P-value) | |
| Between Groups | 91.680 | 30.560 | 4.339 | .041 | |
| Within Groups | 322.899 | 198 | 1.631 |
|
|
| Total | 414.579 | 201 |
|
|
|
Are the results significant? Write a 2-3 sentence summary of your findings. (1 pt)
Multiple Regression – Will Cover in Week #4
3. The organization that surveyed the employees wanted to know what factors influenced STRESS so they could take action. To do that a multiple regression analysis was run that regressed the all the items against the STRESS measure to see which ones had the most impact on stress. Below are the findings:
Model Summary
| Model | R Square | Adjusted R Square | Std. Error of the Estimate | |
| .742(a) | .55 | .53 | 1.39776 |
a Predictors: (Constant), REWARDS, LEARN, WORKLIFE, RESOURCES, INVOLVEMENT
ANOVA(b)
| Model |
| Sum of Squares | df | Mean Square | Sig. | |
| Regression | 30.233 | 6.047 | 3.095 | .015(a) | ||
| Residual | 357.533 | 183 | 1.954 |
|
| |
| Total | 387.766 | 188 |
|
|
|
a Predictors: (Constant), REWARDS, LEARN, WORKLIFE, RESOURCES, INVOLVEMENT
b Dependent Variable: STRESS
Coefficients(a)
| Model |
| Unstandardized Coefficients | Standardized Coefficients | Sig. | ||||
| Std. Error | Beta | |||||||
| (Constant) | 1.992 | .560 |
| 3.558 | .000 | |||
| RESOURCES | .158 | .123 | .117 | 1.287 | .060 | |||
| WORKLIFE | .148 | .125 | .104 | 2.131 | .030 | |||
| INVOLVEMENT | .292 | .136 | .200 | 2.147 | .053 | |||
| LEARN | .110 | .112 | .076 | .978 | .032 | |||
| REWARDS | .179 | .134 | .124 | 1.330 | .055 | |||
a Dependent Variable: STRESS
What is the R-square and what does it mean? (1 pt)
Was the overall multiple regression significant? (1 pt)
Looking at each regression coefficient, which one(s), if any, are statistically significant? (1 pt)
Summarize the results in 2-3 sentences. (1 pt)


