numerical analysis
Research Question:
Rs occupational prestige score is the dependent variable. My independent variables are highest year of school completed, respondent age, and a dummy variable of American citizenship categorized as 1 (if yes) and 2 (if no) and 0 (if otherwise). Are the highest year of school completed, respondent age and dummy variable significant for predicting Rs occupational prestige score? Also what is the effect on Rs occupational prestige score with a unit increase in highest year of school completed, respondent age, and American citizenship?
Coefficients significance and interpretation
With p-value less than alpha (0.05), highest year of school completed and coefficient of respondent age. But with p-value greater than alpha (0.05) yes and no are not significant. With one unit increase in highest year of school completed, there is 2.324 units increase in Rs occupational prestige score. With one unit increase in respondent age, there is 0.112 units increase in Rs occupational prestige score. Rs occupational prestige score is .335 units less on an average for American citizens as compared to that of others. And Rs occupational prestige score is 2.487 units more on an average for American citizens as compared to that of others
Assumptions
From the table of correlations I observe that there is no correlation between independent variables. Therefore there is no problem of multicollinearity and the assumption of independence of variables is satisfied. All correlations lie in the interval [-.3, 3] implying no weak linear relationship or no correlation.
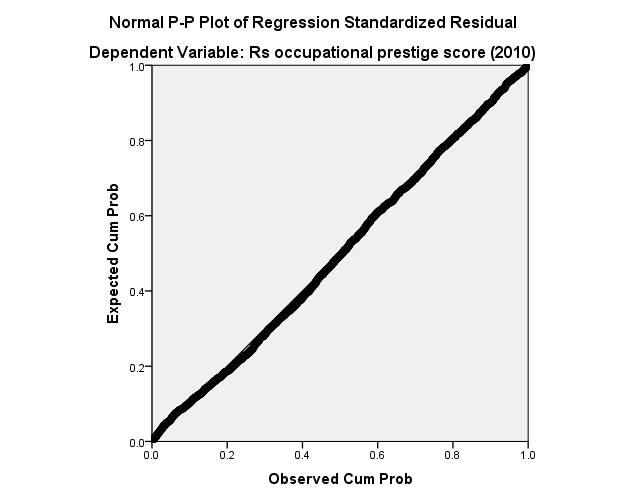
From the graph of residual I observe that residuals are normally distributed. This implies that the assumption normality of residuals is also satisfied.
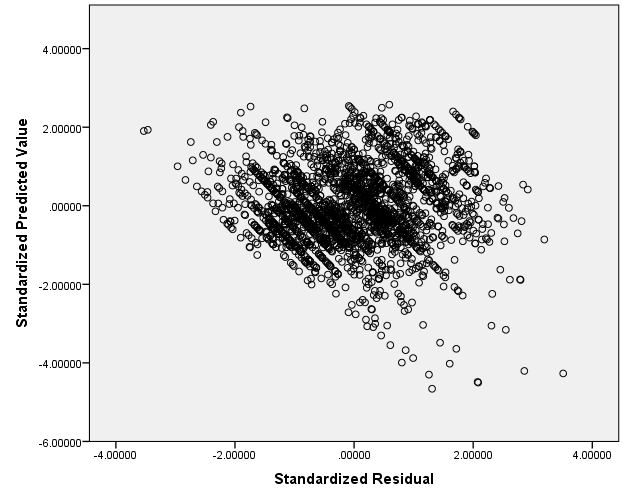
From the graph of regression standardized residual the constant variance is observed. This implies that assumption of homogeneity of variance is satisfied. Thus all assumptions of regression analysis are satisfied.
Output
| Correlations | ||||||
| Rs occupational prestige score (2010) | AGE OF RESPONDENT | HIGHEST YEAR OF SCHOOL COMPLETED | yes | no | ||
| Rs occupational prestige score (2010) | Pearson Correlation | 1 | .126** | .514** | .028 | -.077** |
| Sig. (2-tailed) | .000 | .000 | .165 | .000 | ||
| 2427 | 2421 | 2426 | 2427 | 2427 | ||
| AGE OF RESPONDENT | Pearson Correlation | .126** | 1 | -.014 | .036 | -.083** |
| Sig. (2-tailed) | .000 | .479 | .068 | .000 | ||
| 2421 | 2529 | 2528 | 2529 | 2529 | ||
| HIGHEST YEAR OF SCHOOL COMPLETED | Pearson Correlation | .514** | -.014 | 1 | .088** | -.201** |
| Sig. (2-tailed) | .000 | .479 | .000 | .000 | ||
| 2426 | 2528 | 2537 | 2537 | 2537 | ||
| yes | Pearson Correlation | .028 | .036 | .088** | 1 | -.172** |
| Sig. (2-tailed) | .165 | .068 | .000 | .000 | ||
| 2427 | 2529 | 2537 | 5054 | 5054 | ||
| no | Pearson Correlation | -.077** | -.083** | -.201** | -.172** | 1 |
| Sig. (2-tailed) | .000 | .000 | .000 | .000 | ||
| 2427 | 2529 | 2537 | 5054 | 5054 | ||
| **. Correlation is significant at the 0.01 level (2-tailed). | ||||||
| Variables Entered/Removeda | |||
| Model | Variables Entered | Variables Removed | Method |
| no, AGE OF RESPONDENT, yes, HIGHEST YEAR OF SCHOOL COMPLETEDb | . | Enter | |
| a. Dependent Variable: Rs occupational prestige score (2010) | |||
| b. All requested variables entered. | |||
| Model Summaryb | ||||
| Model | R | R Square | Adjusted R Square | Std. Error of the Estimate |
| .534a | .285 | .284 | 11.440 | |
| a. Predictors: (Constant), no, AGE OF RESPONDENT, yes, HIGHEST YEAR OF SCHOOL COMPLETED | ||||
| b. Dependent Variable: Rs occupational prestige score (2010) | ||||
| ANOVAa | ||||||
| Model | Sum of Squares | df | Mean Square | F | Sig. | |
| Regression | 126088.636 | 4 | 31522.159 | 240.867 | .000b | |
| Residual | 316050.099 | 2415 | 130.870 | |||
| Total | 442138.735 | 2419 | ||||
| a. Dependent Variable: Rs occupational prestige score (2010) | ||||||
| b. Predictors: (Constant), no, AGE OF RESPONDENT, yes, HIGHEST YEAR OF SCHOOL COMPLETED | ||||||
| Coefficientsa | ||||||
| Model | Unstandardized Coefficients | Standardized Coefficients | t | Sig. | ||
| B | Std. Error | Beta | ||||
| (Constant) | 6.194 | 1.326 | 4.671 | .000 | ||
| AGE OF RESPONDENT | .112 | .014 | .143 | 8.277 | .000 | |
| HIGHEST YEAR OF SCHOOL COMPLETED | 2.324 | .078 | .525 | 29.896 | .000 | |
| yes | -.335 | .473 | -.012 | -.709 | .478 | |
| no | 2.487 | 1.397 | .032 | 1.780 | .075 | |
| a. Dependent Variable: Rs occupational prestige score (2010) | ||||||
| Residuals Statisticsa | |||||
| Minimum | Maximum | Mean | Std. Deviation | N | |
| Predicted Value | 10.02 | 62.23 | 43.65 | 7.220 | 2420 |
| Residual | -40.393 | 40.169 | .000 | 11.430 | 2420 |
| Std. Predicted Value | -4.659 | 2.573 | .000 | 1.000 | 2420 |
| Std. Residual | -3.531 | 3.511 | .000 | .999 | 2420 |
| a. Dependent Variable: Rs occupational prestige score (2010) | |||||
Frankfort-Nachmias, C., & Leon-Guerrero, A. (2015). Social statistics for a diverse society (7th ed.). Thousand Oaks, CA: Sage Publications.
Wagner, W. E. (2016). Using IBM® SPSS® statistics for research methods and social science statistics (6th ed.). Thousand Oaks, CA: Sage Publications.


