managerial economic assignment
| 1. | Use the following demand and supply functions to answer the following.
|

| 2. | Suppose that the market for salad dressing is in equilibrium. Then the price of lettuce rises. What will happen?
|
| 3. | Suppose that more people want Orange Bowl tickets than the number of tickets available. Which of the following statements is correct?
|
| |
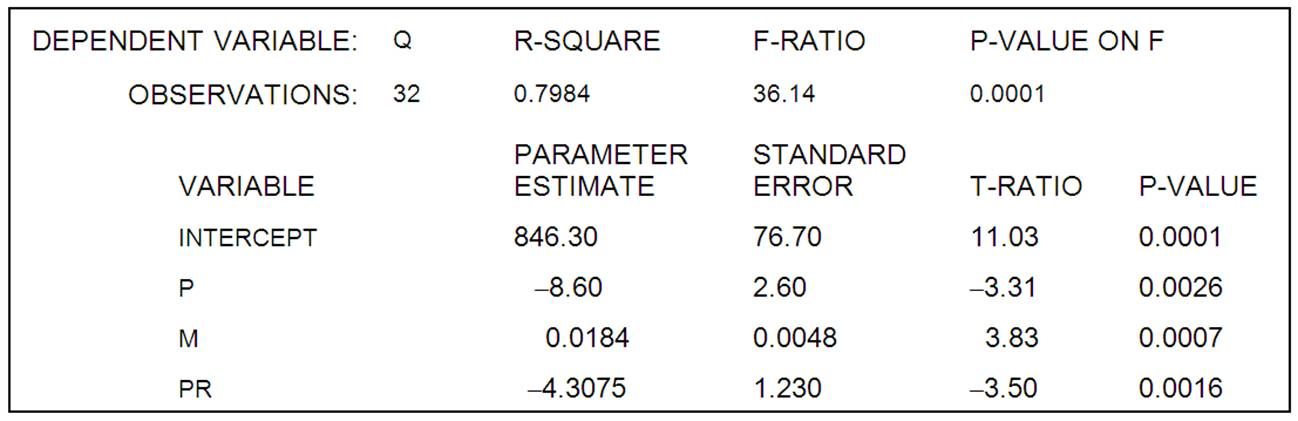
| 4. | What is the demand function when M = $50,000 and PR = $10?
|
| The general linear demand function below is used to answer question |
| 5. | The law of demand requires that
|
| The linear regression equation, Y = a + bX, was estimated. The following computer printout was obtained: |
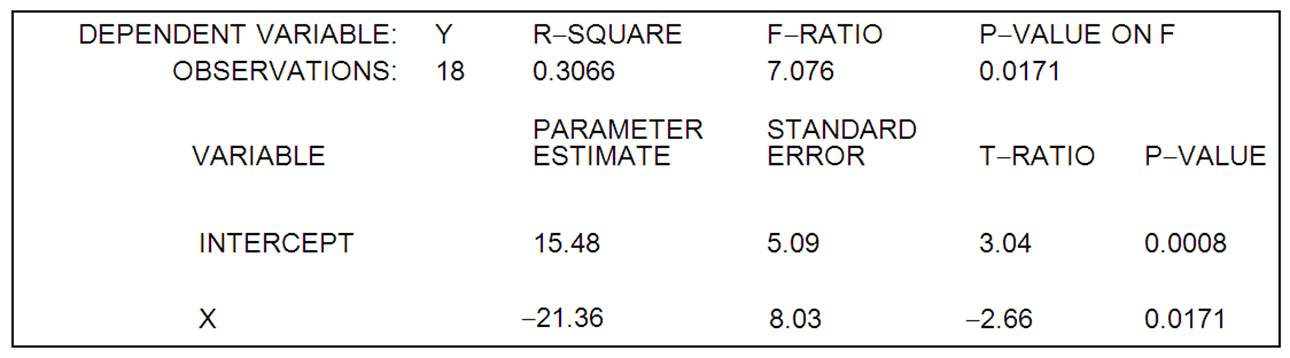
| 8. | The parameter estimate of a indicates
|
| Computer output from estimating the parameters of the nonlinear model |
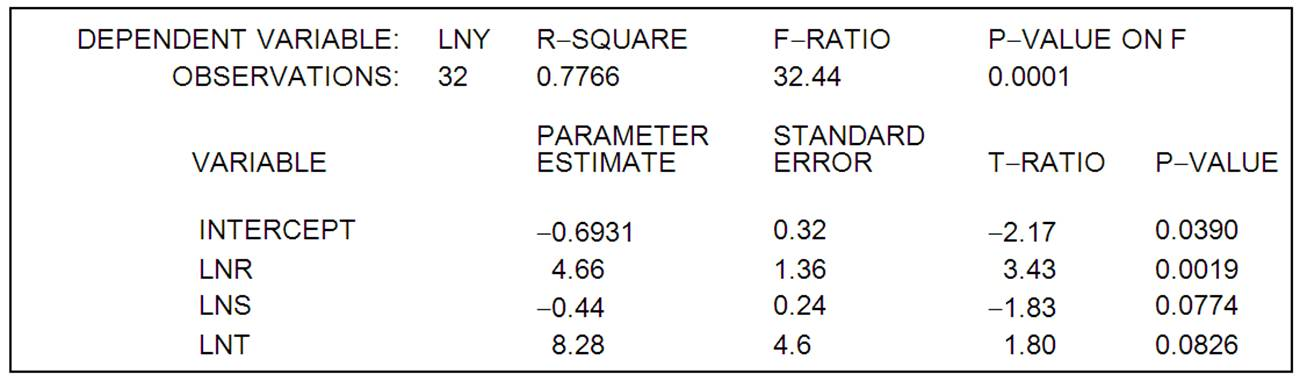
| 9. | The nonlinear relation can be transformed into the following linear regression model:
|
| 10. | Which of the parameter estimates are statistically significant at the 90% level of confidence?
|
| 11. | The quadratic equation Y = a + bX +cX2 can be estimated using linear regression by estimating
|
| A manager wishes to estimate an average cost equation of the following form: |
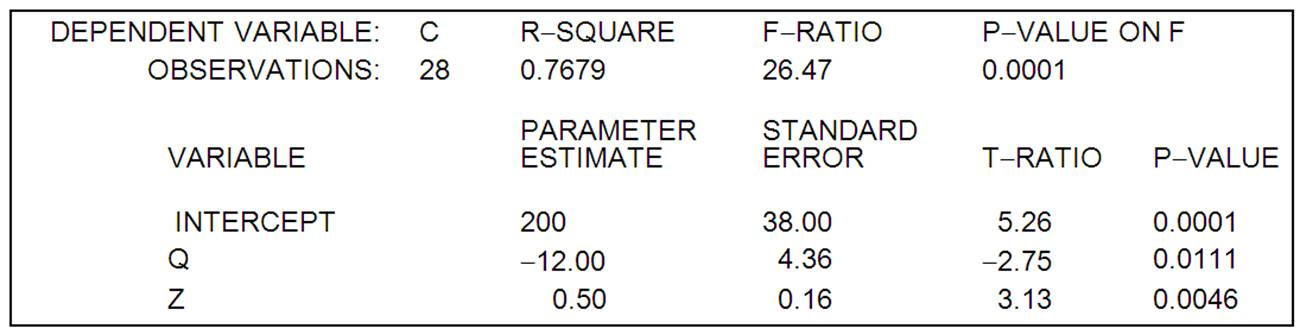
| 12. | The value of R2 indicates that _______ of the total variation in C is explained by the regression equation.
|
| 13. | Suppose that the Houston Rockets' management is considering a plan in which fans who donate blood can attend games for $35 instead of the usual $40. If both ticket revenues and blood donations rise with this plan, which of the following is true?
|
| Refer to the following graph: |
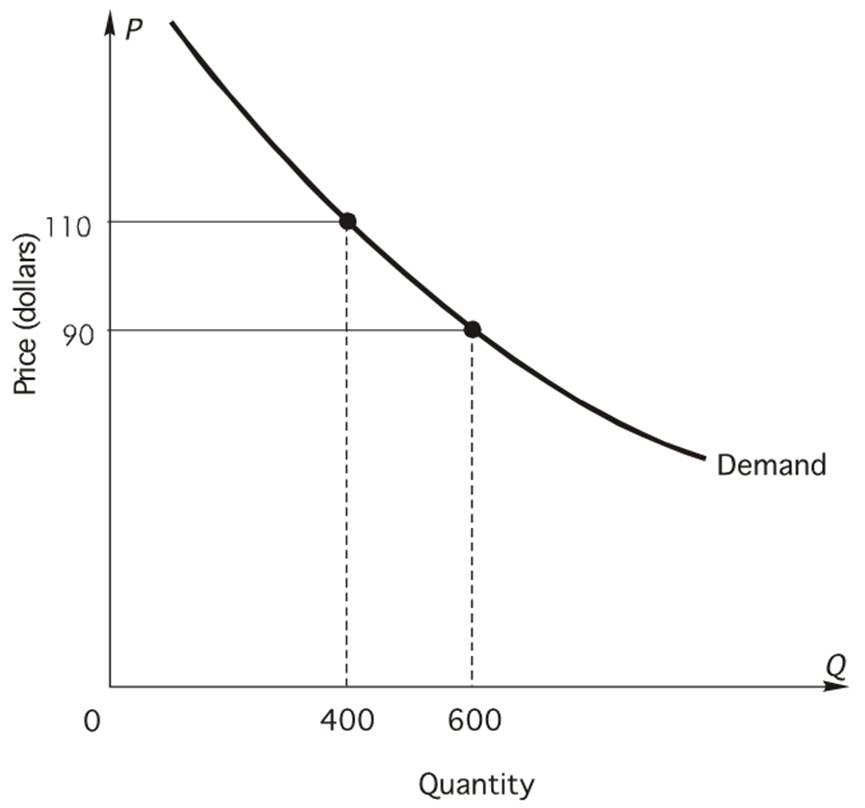
| 14. | The price elasticity of demand over the price interval $90 to $110 is
|
| 15. | Suppose price rises from $90 to $110. Total revenue moves in the ________ (same, opposite) direction as the dominant effect. In this case, total revenue ____________ (increases, decreases, stays the same) because the quantity effect is _________ (larger than, smaller than, the same as) the price effect.
|
| The estimated demand for a good is |
| 16. | If the price of the good falls by $4, the quantity demanded will ________ by ________ units.
|
| The following linear demand specification is estimated for Conlan Enterprises, a price-setting firm: |
| 18. | At the prices and income given above, what is the price elasticity of demand?
|
| The manufacturer of Beanie Baby dolls used quarterly price data for 2005I-2013IV (t = 1, ..., 36) and the regression equation |
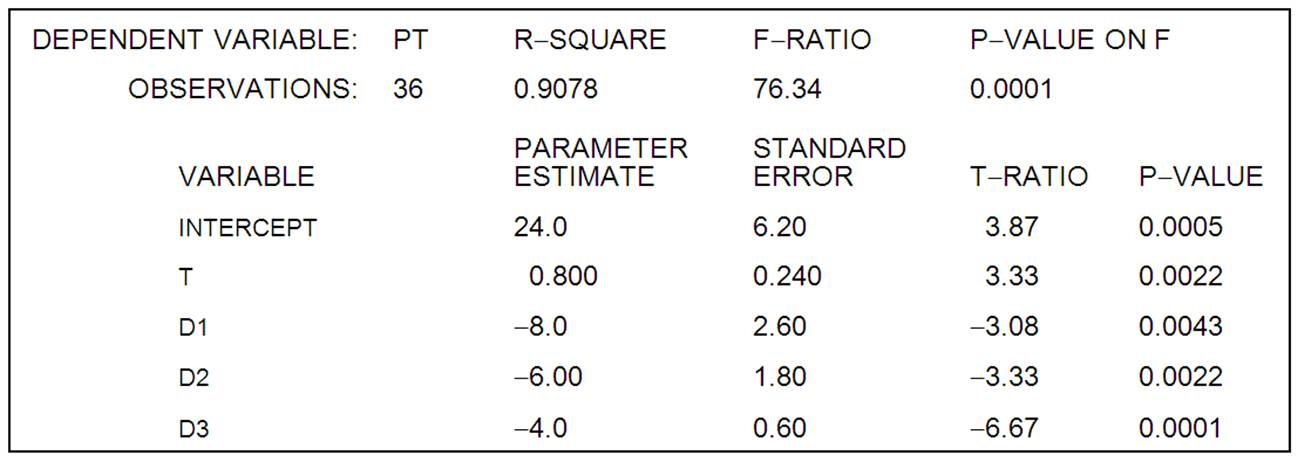
| 19. | What is the estimated intercept of the trend line in the 4th quarter?
|
| A forecaster used the regression equation |
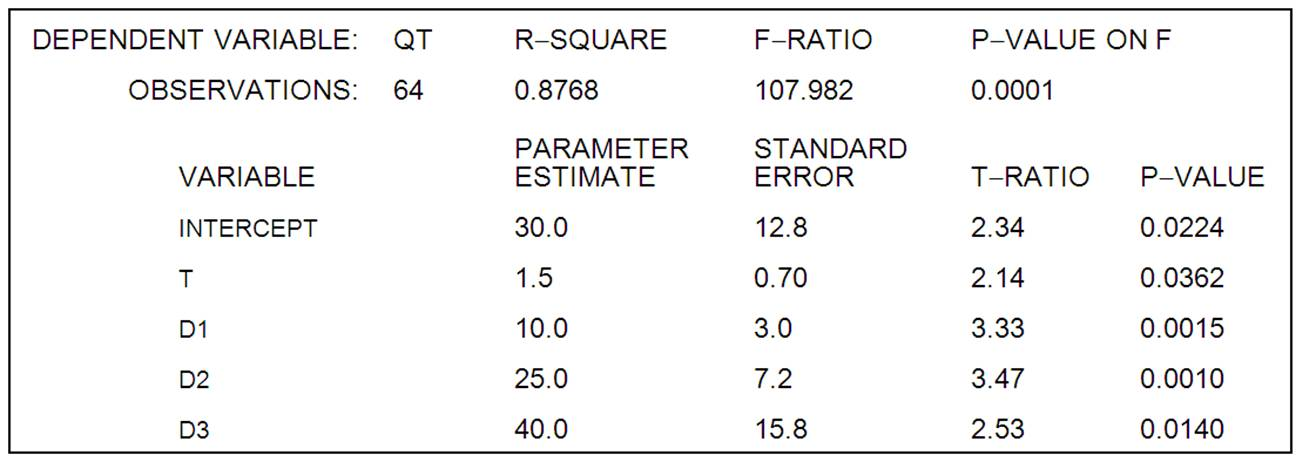
| 20. | Using a 5 percent significance level, these estimation results indicate that
|
FILL IN THE BLANKS
Market researchers at Chrysler have estimated the demand for their new Chrysler Crossfire sports cars as follows:

where QC is the quantity of Chrysler Crossfires sold annually, PC is the price of a Chrysler Crossfire, M is average household income, PBMW is the price of BMW’s 330i sports sedan, and PP is the price of Porsche’s Boxster S sports car. The marketing team at Chrysler plans to price the Crossfire at $32,000. They predict that average household income is $75,000 for buyers in the market for their sports sedan. The current prices for BMW’s 330i and Porsche’s Boxster S are $34,000 and $50,000, respectively. Use this information to answer the following questions.
Compute the predicted annual sales of the Chrysler Crossfire:
QC = ____________ units per year.
Compute the income elasticity of demand for the Chrysler Crossfire:
EM = __________.
The computed value of income elasticity indicates the Crossfire is a(n) _______________ good. Average household income is predicted to fall next year by 2.5 percent, which will cause sales to _________ (rise, fall) by _______ percent (assuming other factors remain the same).
Compute the price elasticity of demand for the Chrysler Crossfire:
E = __________.
At the current price of $32,000, Chrysler is choosing to price in the ______________ (elastic, inelastic) region of demand. At this point, a 5 percent increase in the price of Crossfires would be expected to cause sales to fall by ________ percent (assuming other factors remain the same).
Compute the cross-price elasticity of demand for Chrysler Crossfires with respect to changes in the price of the BMW 330i:
EC-BMW = __________.
Compute the cross-price elasticity of demand for Chrysler Crossfires with respect to changes in the price of the Porsche Boxster S:
EC-P = __________.
Both cross-price elasticities are _______________ (positive, negative, greater than 1, less than 1) because these two cars are viewed by car-buyers as ______________ (substitute, complement, inferior, normal) goods.
8| Page


