paraphrasing a project
Table of Contents
Room characteristics……………… 7
Additional Acoustic details…….. 7
Procedure…………………….. 8
Discussion…………………….. 14
Appendix………………………………16
References……………………… 22
Introduction
When in a lecture, it is very important that students are able to hear the professor clearly in order to properly understand the material. Room acoustics in schools play a very important role in the average students learning ability. When the sound is distorted or not clear it can affect the students concentration and distract them from learning. In many cases the speech intelligibility in most parts of lecture rooms are around fifty percent which means that the students are only receiving one word in two. This makes students have to work harder by connecting the dots and understand what’s going on. The main cause of this is due to long reverberation time that is distorted due to improper materials used to help project a better sound. The lecture room should consist of appropriate sound absorption materials along with acceptable reflective surfaces to allow the sound travel in all areas of the room at the right sound level. For our study, we chose room H-603-1 on the sixth floor in Hall building at the Sir George William Campus. This room is particularly small that is why it is mainly used for tutorial classes of small groups of students. To test the acoustics in the room we chose six different locations to record the sound level, three locations were where we believe some students may have difficulty hearing and the other three where students should most likely have no difficulty. We made someone present as professor would in an ordinary lecture with an appropriate sound level so when we collect the data the results would correspond to a real situation. We also marked down the dimensions of everything in the room and the room itself along with the materials that have an effect on whether this room has proper acoustics.
Definition of perceived problem
The purpose of this project is to assess the acoustical setting of an existing lecture room in the Concordia University complex. To complete the project it was decided that the room’s properties to be examined in terms of reverberation time (RT), Noise criteria level (NC), total absorption (∑A), overall room design and AI or speech intelligibility. Then the obtained results are compared with the standard values and a recommendation in terms of changes if it is needed with the cost estimation is given at the end.
Room characteristics
| Location | H- 603-1, 6th floor of Hall Building in Maisonneuve street, Montreal, Quebec. | |
| Geometry | | |
| Content | | |
| Positive and negative aspects of material used | Curtain/drapery | |
| Columns | Have rectangular shape that reflects the sound | |
| Walls | Low absorption of frequency due to usage of concrete blocks. | |
| Floor | Vinyl used on the floor is reflective overall. | |
Additional Acoustic details
| Ceiling material | The material used for the ceiling is thin but it has a good absorption coefficient. The absorption coefficient is high for the 500 to 2000 Hz frequencies which are important at the time of speech. |
| Wooden door | It is assumed that the door is kept close during the lecture and they are solid not honeycombed or hollow. The wood is considered to be a good reflective material. |
| Windows | The large glass windows are considered to be reflective since they have low absorption coefficient. The room has 5 such windows. |
| Tables | 5 plywood tables are in the room at the time. It is assumed that these tables have impact on the acoustical condition of the room since they are coated heavily with plastic laminate that is good as sound reflector. |
| Chalkboard | When the instructor is writing and talking at the same time he/she is talking to the board. Therefore the sound is reflected by the board. The board is considered to have low absorption coefficient therefore it is a good reflective item in the room. |
| | The room comprises of 40 seats at the time. The seats made of plastic are good reflectors. |
Procedure
Part I: Noise criteria (NC)
To perform this part of the experiment a location within the room is chosen and the value of sound pressure level is evaluated using the sound level meter. The sound pressure levels are recorded for each frequency for 10 seconds for an interval of 30 seconds.
Part II: Speech intelligibility (AI)
To perform this part of the experiment the sound pressure level at 6 different points within the classroom is chosen. One of the group members read a text in order to imitate the instructor giving a speech. The sound pressure levels are recorded for each frequency for 10 seconds for an interval of 30 seconds.
Part III: Reverberation time (RT)
To find the reverberation time (RT), all the surfaces area as much as possible were measured. These values along with the absorption coefficient of the materials will be used to evaluate the value of RT for this particular room.
Results
Part I: Noise criteria (NC)
| Frequency (Hz) | |||||||
| 63 | 125 | 250 | 500 | 1000 | 2000 | 4000 | 8000 |
| Sound pressure level (dB) | |||||||
| 34.8 | 41.2 | 37.3 | 38.4 | 37.7 | 33.0 | 21.7 | 17.6 |
NC curve:
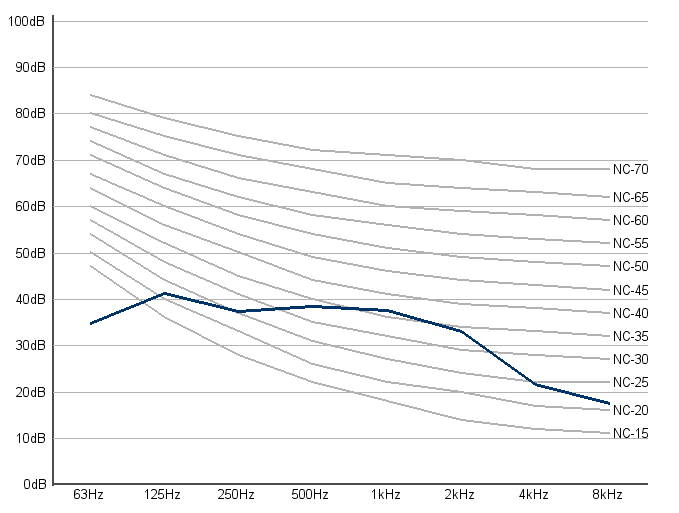
According to the NC curve the value of NC is 37.
Part II: Speech intelligibility (AI)
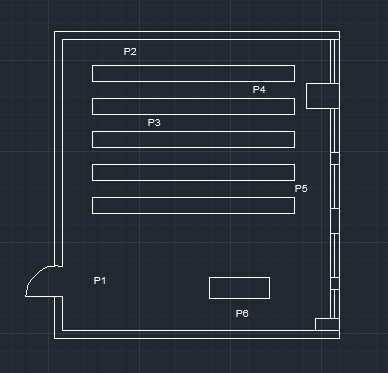
Chosen locations:
| Point 1 | Near the entrance. |
| Point 2 | The back of the classroom. |
| Point 3 | Third row of the classroom. |
| Point 4 | Fourth row of the classroom. |
| Point 5 | First row near the windows. |
| Point 6 | Near the speaker or the instructor close to the chalkboard. |
Average sound pressure level at different locations:
| Locations | Frequency (Hz) | ||||
| 250 | 500 | 1000 | 2000 | 4000 | |
| SPL (dB) | |||||
| Point 1 | 48.2 | 50.4 | 50.9 | 44.5 | 41.3 |
| Point 2 | 44.1 | 51.6 | 48.6 | 46.8 | 45.9 |
| Point 3 | 46.2 | 50.5 | 50.7 | 50.5 | 42.1 |
| Point 4 | 51.2 | 53.8 | 48.9 | 47.2 | 41.6 |
| Point 5 | 50.3 | 57.2 | 53.3 | 36.0 | 45.1 |
| Point 6 | 47.7 | 52.0 | 54.1 | 39.9 | 45.5 |
AI measurement (Speech intelligibility)
| AI | Frequency (Hz) | ||||||
| 250 | 500 | 1000 | 2000 | 4000 | |||
| Noise level | 37.3 | 38.4 | 37.7 | 33 | 21.7 | ||
| Sound pressure level (dB) | |||||||
| Point1 | 48.2 | 50.4 | 50.9 | 44.5 | 41.3 | ||
| Point2 | 44.1 | 51.6 | 48.6 | 46.8 | 45.9 | ||
| Point3 | 46.2 | 50.5 | 50.7 | 50.5 | 42.1 | ||
| Point4 | 51.2 | 53.8 | 48.9 | 47.2 | 41.6 | ||
| Point5 | 50.3 | 57.2 | 53.3 | 36 | 45.1 | ||
| Point6 | 47.7 | 52 | 54.1 | 39.9 | 45.5 | ||
| S - N ratio | |||||||
| Point1 | 10.9 | 12.0 | 13.2 | 11.5 | 19.6 | ||
| Point2 | 6.8 | 13.2 | 10.9 | 13.8 | 24.2 | ||
| Point3 | 8.9 | 12.1 | 13 | 17.5 | 20.4 | ||
| Point4 | 13.9 | 15.4 | 11.2 | 14.2 | 19.9 | ||
| Point5 | 13.0 | 18.8 | 15.6 | 3.0 | 23.4 | ||
| Point6 | 10.4 | 13.6 | 16.4 | 6.9 | 23.8 | ||
| WF | |||||||
| 0.0024 | 0.0048 | 0.0074 | 0.0109 | 0.0078 | |||
| WF * S - N | AI | ||||||
| Point1 | 0.02616 | 0.0576 | 0.09768 | 0.12535 | 0.15288 | 0.45967 | |
| Point2 | 0.01632 | 0.06336 | 0.08066 | 0.15042 | 0.18876 | 0.49952 | |
| Point3 | 0.02136 | 0.05808 | 0.0962 | 0.19075 | 0.15912 | 0.52551 | |
| Point4 | 0.03336 | 0.07392 | 0.08288 | 0.15478 | 0.15522 | 0.50016 | |
| Point5 | 0.0312 | 0.09024 | 0.11544 | 0.0327 | 0.18252 | 0.4521 | |
| Point6 | 0.02496 | 0.06528 | 0.12136 | 0.07521 | 0.18564 | 0.47245 | |
| Average | 0.5 | ||||||
| Speech intelligibility | 0.5 | ||||||
RT results
| Frequency (Hz) | |||||||
| Room Components/Materials | | 125 | 250 | 500 | 1000 | 2000 | 4000 |
| Concrete painted walls | α | 0.1 | 0.05 | 0.06 | 0.07 | 0.09 | 0.08 |
|
| S(m2) | 59.3 | |||||
|
| S*α (Sabine) | 5.93 | 2.97 | 3.56 | 4.15 | 5.34 | 4.74 |
|
| |||||||
| Windows | α | 0.18 | 0.06 | 0.04 | 0.03 | 0.02 | 0.02 |
|
| S(m2) | 12 | |||||
| S*α (Sabine) | 2.16 | 0.72 | 0.48 | 0.36 | 0.24 | 0.24 | |
|
| |||||||
| Wooden Door | α | 0.1 | 0.07 | 0.05 | 0.04 | 0.04 | 0.04 |
|
| S(m2) | 1.9 | |||||
| S*α (Sabine) | 0.19 | 0.133 | 0.095 | 0.076 | 0.076 | 0.076 | |
|
| |||||||
| Curtains | α | 0.07 | 0.31 | 0.49 | 0.75 | 0.7 | 0.6 |
|
| S(m2) | 11.2 | |||||
| S*α (Sabine) | 0.784 | 3.472 | 5.488 | 8.4 | 7.84 | 6.72 | |
|
| |||||||
| Chalkboard | α | 0.01 | 0.01 | 0.01 | 0.01 | 0.02 | 0.02 |
|
| S(m2) | 7.6 | |||||
| S*α (Sabine) | 0.08 | 0.08 | 0.08 | 0.08 | 0.15 | 0.15 | |
|
| |||||||
| Plywood Tables | α | 0.28 | 0.22 | 0.17 | 0.09 | 0.1 | 0.11 |
|
| S(m2) | 12.03 | |||||
| S*α (Sabine) | 3.37 | 2.65 | 2.05 | 1.08 | 1.20 | 1.32 | |
|
| |||||||
| Plastic Unoccupied Chairs | α | 0.15 | 0.19 | 0.22 | 0.39 | 0.38 | 0.3 |
|
| S(m2) | 7.2 | |||||
| Surface Area of 40 Unoccupied Chairs | S*α (Sabine) | 1.08 | 1.368 | 1.584 | 2.808 | 2.736 | 2.16 |
|
| |||||||
| Thin, porous sound absorbing Ceiling Material | α | 0.1 | 0.6 | 0.8 | 0.82 | 0.78 | 0.6 |
|
| S(m2) | 58.8 | |||||
| S*α (Sabine) | 5.88 | 35.28 | 47.04 | 48.216 | 45.864 | 35.28 | |
|
| |||||||
| Average Size [1.9m2] Adult Student (40 Students) | α | 0.3 | 0.41 | 0.49 | 0.84 | 0.87 | 0.84 |
|
| S(m2) | 76 | |||||
| S*α (Sabine) | 22.8 | 31.16 | 37.24 | 63.84 | 66.12 | 63.84 | |
| Vinyl Floor Tiles Covering Concrete | α | 0.02 | 0.03 | 0.03 | 0.03 | 0.03 | 0.02 |
|
| S(m2) | 58.8 | |||||
| S*α (Sabine) | 1.176 | 1.764 | 1.764 | 1.764 | 1.764 | 1.176 | |
| mV @ 2000 = 1.6 mV @ 4000 = 4.4 | |||||||
| Total Absorption without Students (Sabine ) | 20.64 | 48.42 | 62.13 | 66.93 | 66.81 | 56.27 | |
| Total Absorption with Students (Sabine) | 43.44 | 79.58 | 99.37 | 130.77 | 132.93 | 120.11 | |
|
| |||||||
| Volume(m3) 7.989m x 7.367m x 3.029m | 178.2 | ||||||
|
| |||||||
| Reverberation Time (s) without Students
| 1.4 | 0.6 | 0.5 | 0.4 | 0.4 | 0.5 | |
| Reverberation Time (s) with students
| 0.7 | 0.4 | 0.3 | 0.2 | 0.2 | 0.2 | |
| Optimum RT for classroom (s)
| 0.5 to 1 | ||||||
Discussion
Part I: Noise criteria (NC)
According to the data obtained the NC value is 37. This value is compared to the table 1.2 recommended criteria for steady background sound in typical building space, in the lecture slides. Accordingly, the obtained NC value is within the range recommended for class rooms which is 30 to 40.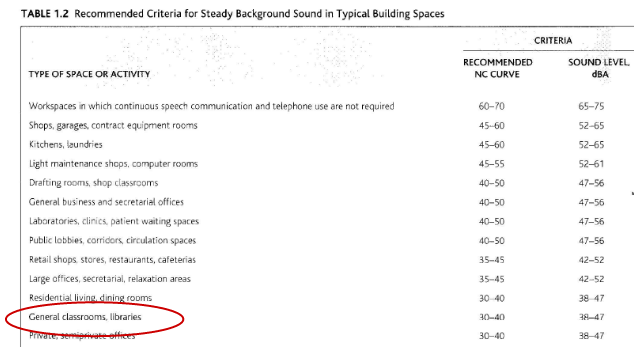
Part II: AI (Speech intelligibility)
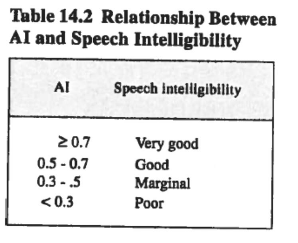
According to the results obtained in this part of the experiment the AI value obtained is 0.5 which shows that the speech intelligibility is within the acceptable values and it is considered to be good. This value is compared to the table 14.2 relationship between AI and speech intelligibility provided in lecture slides.
Part III: Reverberation time
In this part of the experiment after measuring all the surfaces and obtaining the absorption coefficients for each surface it is noticed that the RT value when the class is full is low in frequencies between 250 to 4000. To increase the RT value the amount of ∑Aα should be decreased, this means the room is highly absorptive therefore reflective material should be added to the room.
Recommendation:
To increase the RT value the number of absorptive material in the room should be decreased. Therefore it is recommended that reflective material be used in the room. The following shows a number of material that can improve the RT level of this classroom.
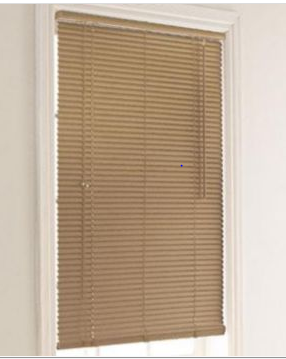
Using venetian blind
It is a reflective material that can be used instead of the current plastic made curtains to improve the RT level by decreasing the absorption. White or bright colors are recommended.
Required dimensions 1.2 m x 2 m.The price varies between 10 to 40 $ depending on the Chosen Length. Using 48 in for this classroom; the price will be around 26 $ each For a total of 130 $ to cover all 5 windows.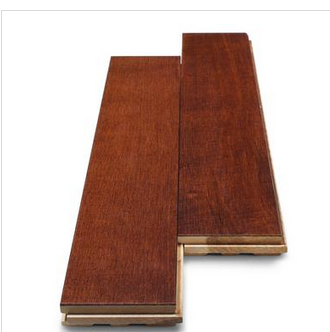
Using hard wood on the floor instead of dark colored tiles
The hard wood will reflect the sound and will improve the RT level. The price is 39.5 $/m2 the required are is 58.8 m2, for a total of 2322.6 $ to cover the whole classroom.
Error and discrepancy
The fact that there was only one equipment such as the sound level meter to measure the data can have significant effects on the results since the reverberation time should have been calculated ny hand. Also the other sources of error in this experiment is the fact that it was impossible to find the exact value of the absorption coefficients for the materials therefore to calculate the reverberation time, the absorption coefficient of similar materials are used.
Appendix
Data obtained from the experiment
| Noise criteria | Frequency (Hz) | ||||||||||
|
| 63 | 125 | 250 | 500 | 1000 | 2000 | 4000 | 8000 | |||
| Time (s) | Sound pressure level dB | ||||||||||
| 10 | 34.4 | 41.3 | 37.9 | 41.9 | 38.7 | 34.5 | 21.9 | 17.4 | |||
| 20 | 35.1 | 42 | 36.1 | 36.3 | 37.4 | 34 | 21.3 | 17.8 | |||
| 30 | 34.8 | 40.4 | 38 | 36.9 | 37.1 | 30.4 | 21.8 | 17.6 | |||
| Average | 34.8 | 41.2 | 37.3 | 38.4 | 37.7 | 33.0 | 21.7 | 17.6 | |||
| Point 1 | Frequency (Hz) | ||||||||||
|
| 250 | 500 | 1000 | 2000 | 4000 | ||||||
| Time (s) | Sound pressure level dB | ||||||||||
| 10 | 48.2 | 50.4 | 53.9 | 45.3 | 42.3 | ||||||
| 20 | 48.4 | 54.3 | 52.8 | 44.1 | 40.7 | ||||||
| 30 | 48 | 46.4 | 46.1 | 44.2 | 40.8 | ||||||
| Average | 48.2 | 50.4 | 50.9 | 44.5 | 41.3 | ||||||
| | |||||||||||
| Point 2 | Frequency (Hz) | ||||||||||
|
| 250 | 500 | 1000 | 2000 | 4000 | ||||||
| Time (s) | Sound pressure level dB | ||||||||||
| 10 | 46.2 | 51.3 | 47 | 46.2 | 44.3 | ||||||
| 20 | 46.9 | 51.7 | 49.2 | 45.9 | 46.3 | ||||||
| 30 | 39.1 | 51.9 | 49.7 | 48.3 | 47 | ||||||
| Average | 44.1 | 51.6 | 48.6 | 46.8 | 45.9 | ||||||
| Point 3 | Frequency (Hz) | ||||||||||
|
| 250 | 500 | 1000 | 2000 | 4000 | ||||||
| Time (s) | Sound pressure level dB | ||||||||||
| 10 | 44.6 | 49.4 | 53.1 | 51 | 43.1 | ||||||
| 20 | 47.0 | 53.1 | 48.2 | 52.3 | 42.1 | ||||||
| 30 | 47.1 | 49.1 | 50.7 | 48.2 | 41.1 | ||||||
| Average | 46.2 | 50.5 | 50.7 | 50.5 | 42.1 | ||||||
| Point 4 | Frequency (Hz) | ||||||||||
|
| 250 | 500 | 1000 | 2000 | 4000 | ||||||
| Time (s) | Sound pressure level dB | ||||||||||
| 10 | 50.9 | 54 | 49.2 | 46.3 | 42.2 | ||||||
| 20 | 51.2 | 54.2 | 48.3 | 50.1 | 42.3 | ||||||
| 30 | 51.4 | 53.2 | 49.1 | 45.1 | 40.3 | ||||||
| Average | 51.2 | 53.8 | 48.9 | 47.2 | 41.6 | ||||||
| Point 5 | Frequency (Hz) | ||||||||||
|
| 250 | 500 | 1000 | 2000 | 4000 | ||||||
| Time (s) | Sound pressure level dB | ||||||||||
| 10 | 47.3 | 58.2 | 53.6 | 45.8 | 47.9 | ||||||
| 20 | 51.3 | 59.2 | 51.9 | 32.8 | 43.5 | ||||||
| 30 | 52.3 | 54.3 | 54.3 | 29.3 | 43.9 | ||||||
| Average | 50.3 | 57.2 | 53.3 | 36.0 | 45.1 | ||||||
| | | ||||||||||
| Point 6 | Frequency (Hz) | ||||||||||
|
| 250 | 500 | 1000 | 2000 | 4000 | ||||||
| Time (s) | Sound pressure level dB | ||||||||||
| 10 | 46 | 58.1 | 47 | 44.1 | 44.2 | ||||||
| 20 | 48.1 | 46.1 | 57.2 | 30 | 43.6 | ||||||
| 30 | 49.1 | 51.9 | 58.2 | 45.6 | 48.7 | ||||||
| Average | 47.7 | 52.0 | 54.1 | 39.9 | 45.5 | ||||||
Calculation
Part I: Noise criteria (NC)
The average value of sound pressure level is used for each frequency;
@ 63 Hz: 4.4 + 35.1 + 34.8 /3 = 34.8
The NC value at the highest SPL is used to find the noise criteria level.
Part II: Speech intelligibility
The average sound level at each frequency is used for each location.
The sound level at each frequency is deducted by corresponding value of noise level. (S – N ratio) @ 250: Hz 48.2 – 37.3 = 10.9
The S – N ratio is multiplied by the corresponding weighing factor at each frequency. (S – N * WF) @ 250 Hz: 10.9 * 0.0024 = 0.02616
The AI Value is the sum of the all S – N * WF values. For point 1: AI = 0.45967
The AI of the other points are found using the same above procedure and an average value of AI of all the points is used to rate the speech intelligibility of this particular classroom.
Part III: Reverberation time
@ 125 Hz:
Concrete painted walls: S = 59.3 m2, α = 0.1, Sα = 5.93 Sabine
Windows: S = 12 m2, α = 0.18, Sα = 2.16 Sabine
Wooden door: S = 1.9 m2, α = 0.1, Sα = 0.19 Sabine
Curtains: S = 11.2 m2, α = 0.07, Sα = 0.784 Sabine
Chalkboard: S = 7.6 m2, α = 0.01, Sα = 0.08 Sabine
Tables: S = 12.03 m2, α = 0.28, Sα = 3.37 Sabine
Unoccupied chairs: S = 7.2 m2, α = 0.15, Sα = 1.08 Sabine
Ceiling material: S = 58.8 m2, α = 0.76, Sα = 44.68 Sabine
Surface area of adult human: S = 76 m2, α = 0.3, Sα = 22.8 Sabine
Floor: S = 58.8 m2, α = 0.02 , Sα = 1.176 Sabine
Total absorption without students ∑ Sα = 20.64
Total absorption with students ∑ Sα = 43.44
RT = 0.161 (178.2) / 20.64 = 1.4 s
RT = 0.161 (178.2) / 43.44 = 0.7 s
The same procedure is used to find the rest of RT values for the remaining frequencies.
Floor plan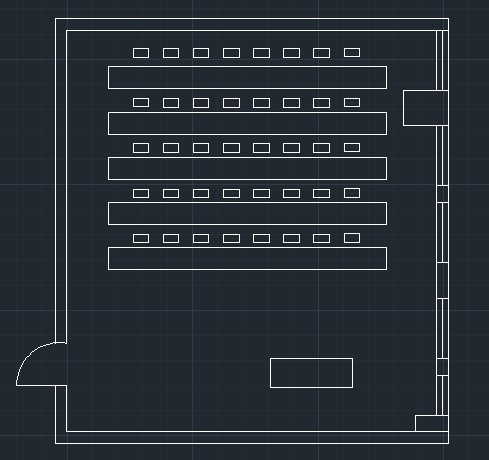
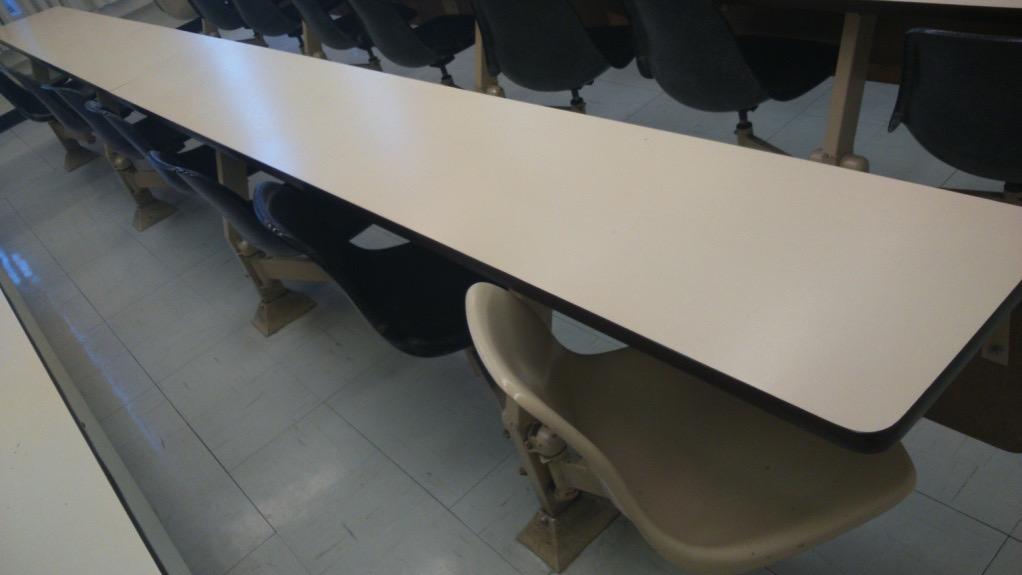
Chairs, table and tiles
Windows, curtains and concrete block wall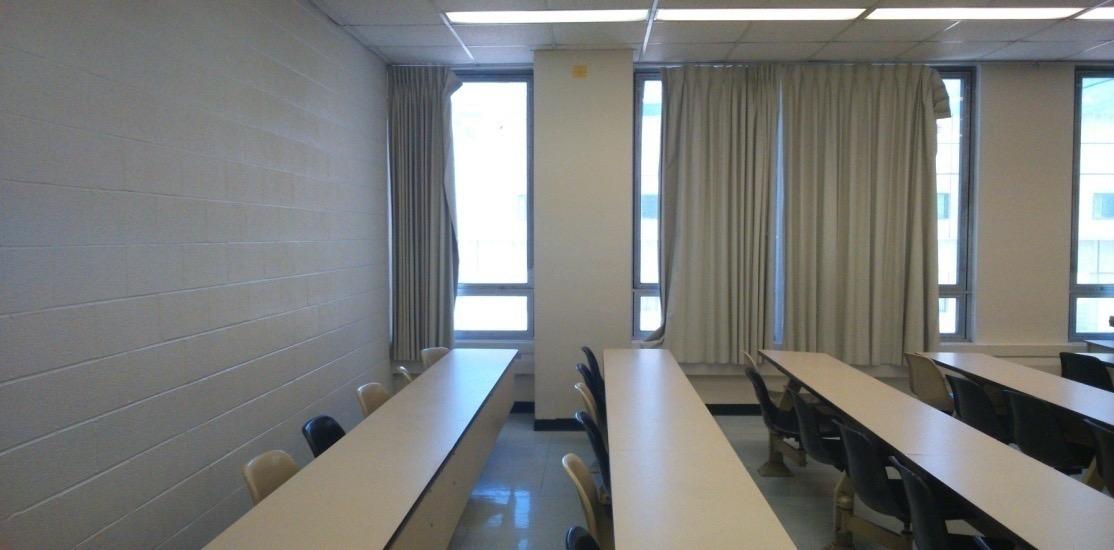
Chalkboard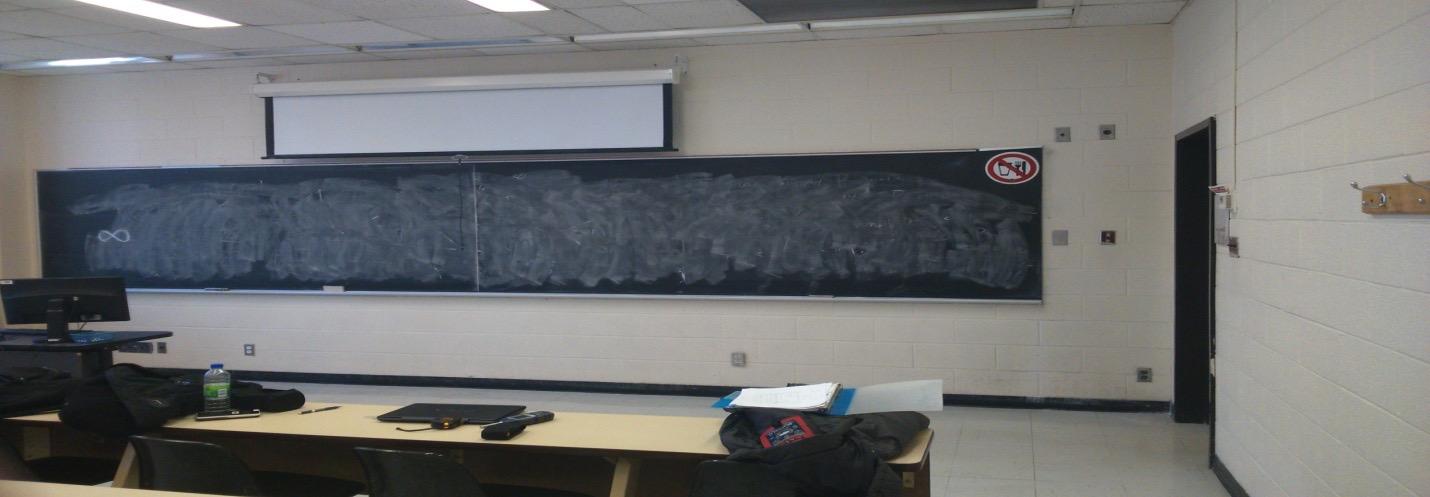
Acoustic porous boards 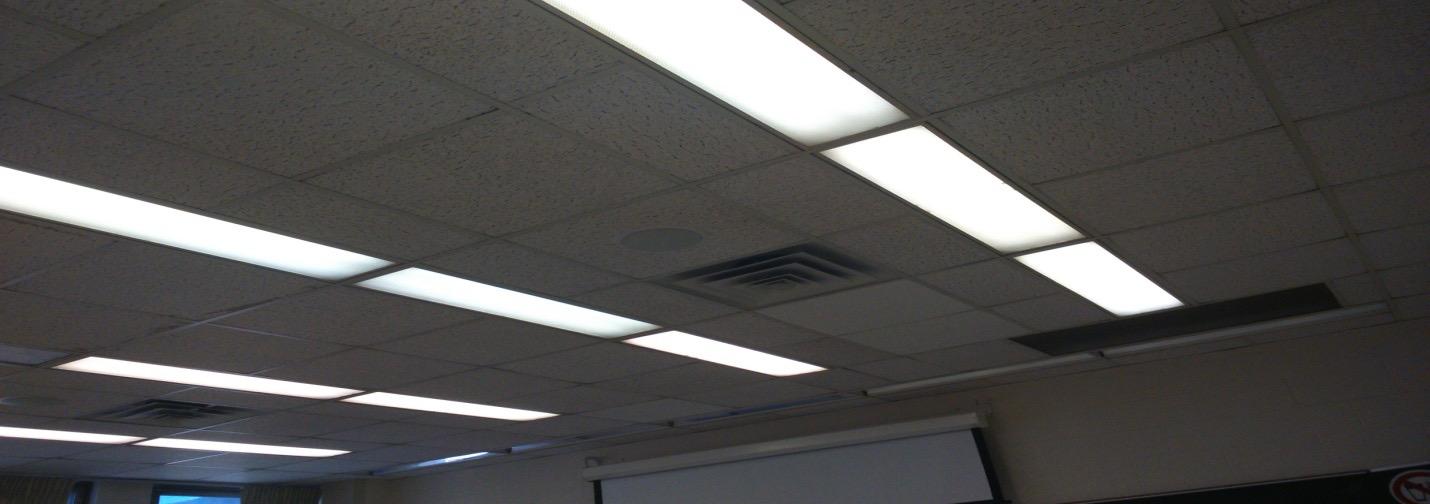
Wooden door

References
1)Noise Criteria Calculator | Michael Schwob." Michael Schwob. N.p., n.d. Web. 23 Feb. 2015.
2)(n.d.):n.pag.Https://moodle.concordia.ca/moodle/pluginfile.php/1890038/mod_resource/content/1/BLDG366-2015-W3.pdf. Web.
3)(n.d.):n.pag.Https://moodle.concordia.ca/moodle/pluginfile.php/1897612/mod_resource/content/1/BLDG366-2015-W5.pdf. Web.
4) http://www.sae.edu/reference_material/audio/pages/Coefficient%20Chart.htm
5) http://www.ted.com/talks/julian_treasure_why_architects_need_to_use_their_ears.html
6) "Ready-Made 1'' Valanceless PVC Light-filtering Mini Blinds - Sears." Sears.ca. N.p., n.d. Web. 23 Feb. 2015.
10) Solid Hardwood." Solid Hardwood. N.p., n.d. Web. 23 Feb. 2015.
7) All photos of the classroom are taken using our own smart phone.
8)(n.d.):n.pag.Https://moodle.concordia.ca/moodle/pluginfile.php/1884353/mod_resource/content/1/BLDG366-2015-W2.pdf. Web.


