madam-professor
Chapter 6 Inventory analysis:
We frequently need more than one number to analyze an aspect of a company. In this case we want to analyze a company’s core profit earning potential. The gross margin rate matters a great deal, but so does how often a company makes sales happen. Many low profit sales might do just as well as few high profit sales. In this case we add the inventory velocity measures of inventory turns and days in inventory to better understand the effectiveness of our pricing strategy and core profitability performance.
Companies that stock and sell products must work to keep their inventory selling quickly to minimize storage costs and obsolescence costs. Remember too that any assets, like inventory, have to be funded by either liabilities and/or equity and those sources of capital expect a return on their investment. Holding inventory is expensive. Service firms and other non-inventory firms have inherent efficiency advantages over traditional hard-goods firms, and those advantages will come out in your analysis of these tools. Key tools at hand are gross profit percentage, inventory turnover rate, and number of days in inventory. I will continue evaluating the Harley Davidson company (ticker: HOG) using www.yahoo.com/finance. Use any site you like for your company.
Inventory turns and days in inventory
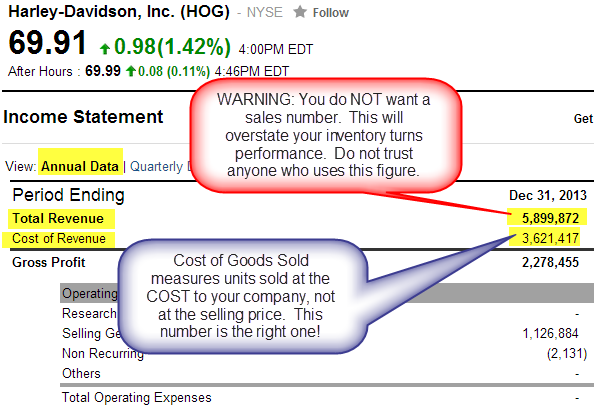
You will need both the income statement and the balance sheet to source your numbers. Grab the Cost of Goods sold number you already found from the income statement:
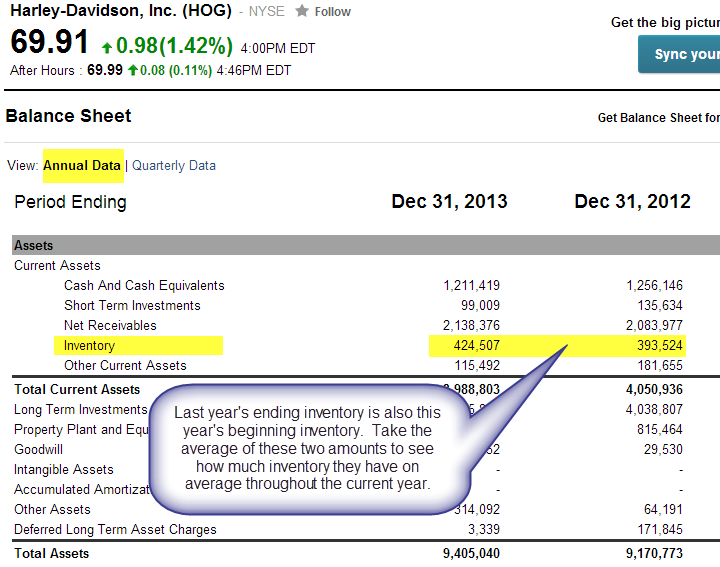
Then get your beginning and ending inventory numbers from the balance sheet:
Running the numbers (Round for display only, use all digits for calculations):
Inventory turns = Cost of goods sold ÷ Average inventory
$3.6 billion ÷ (($0.42 billion + $0.39 billion)÷2)
Inventory turns = 8.9 inventory turns
Number of days inventory on hand = 365 days per year ÷ inventory turns
365 ÷ 8.9 = 41 days of inventory on hand.
Background for inventory turns and days in inventory:
Both the turns and days metrics measure the exact same thing and tell exactly the same story. They differ only in presentation form. Use the one that makes sense to you in your write up. Inventory turns is the number of times an average inventory item is sold each year. If you keep 10 hammers in stock, and sell 30 hammers per year, then you have 3 inventory turns on your hammers. Number of days is the number of days an average inventory item sits in inventory before it is sold. If you turn your hammer inventory over 3 times per year, then you have 365 ÷ 3 = about 120 days of hammer inventory. 3 inventory turns means 120 or so days in inventory, they mean the same thing so they both have exactly the same interpretation.
Selling inventory quickly is a good thing. Higher inventory velocity provides more opportunities to repeat gross profits again and again. More inventory turns may indicate the ability to fulfill sales using a smaller amount of inventory. Less inventory on hand lowers inventory finance costs, obsolescence costs, and frees capacity for the company to bring in innovative new products to capture high profit sales. Norms? These numbers vary dramatically by industry and by competitive approach. A premium pricing merchandiser can earn tolerable profitability with as low as 3 inventory turns, or about 120 days of inventory on hand. Remember that 365÷3 turns is about 120 days, they mean the same thing. 3-4 turns is a pretty normal range. Get lower turns than 3, and you’ll find a company that pays too much to finance the inventory, generates few sales relative to their inventory investment, and should manage their inventory more closely. 5 inventory turns or higher brings the potential for much more profitability. Value pricing companies must turn their inventory this fast to create reasonable overall profitability.
If your company has NO inventory, they maximize all of these advantages. They have nothing to finance, no obsolescence risks, no storage costs, all in all a tremendous advantage to earn wealth without the hassles of inventory. There may be other drawbacks, but with regard to inventory, infinite inventory turns and zero days on hand is a pure financial advantage. Netflix doesn’t want to stock millions of DVD’s because that’s expensive. They want us to watch streamed movies in infinite volume from their server at very low transaction and storage costs.
As inventory turns get really high for a traditional merchandiser it can either be good or bad depending on how the company achieves their numbers. Just in time inventory and lean production advances are positive ways in which a company can keep their inventory investment at a minimum without losing sales due to product shortages. HOWEVER, if a business focuses solely on cutting back inventory by not reordering sold merchandise, they can find themselves stuck with only obsolete and undesirable inventory that customers do not want to buy. The inventory turns may look quick, but sales volume will drop considerably. You will have to assess whether the rest of the business is collapsing to know if really high inventory turns are good or bad for your company. High turns and low profits are a bad sign. High turns and high profits probably means they are managing their inventory effectively.
A company’s combined picture of inventory turns and gross profit can indicate differences in strategy. A low-price discounter with low gross margins would need fast inventory turns to be overall profitable. Think of millions of customers going through Wal-Mart all day long for an example. A premium priced competitor might earn super high margins on each sale, but could be priced so high that their inventory doesn’t attract enough customers to turn their product over quickly. Think your local Ferrari showroom for an example of this approach. If a company doesn’t do either thing well, they won’t be in business much longer. If they earn high margins and turn inventory quickly, they have a pretty enviable position in the market and should be earning enough to be able to afford maintaining their competitive advantages.
Example HOG’s inventory turns analysis example (Note that this only the full summary paragraph incorporating past research as well. ):
At 8.9 turns and just 41 days of inventory on hand, HOG is running a lean inventory and turning their inventory over quickly compared to a norm of 3-4 turns. Their fast inventory velocity provides a high level of sales volume, $5 billion, to help turn their ordinary 39% gross profit into a strong overall profitability ratio of 12%. This strong inventory velocity contributes to HOG’s ability to keep the organization lean and related costs low. This excellent management eases some of my concerns over their high 68% debt ratio. This looks like an overall well-run company, and if I wasn’t still worried about that high borrowing I’d be even more excited about Harley Davidson.
Chapter 6 Inventory analysis Student name:___________________
Reporting requirements:
Indicate company name and ticker symbol.
Report your gross profit percentage, overall net income profitability rate, and sales dollars figure. Don’t show calculations; just grab the numbers from the earlier cases.
Gross profit percentage rate:
Net income profitability percentage rate:
Sales dollars:
Report your inventory turns and number of days in inventory numbers showing all work:
Interpret your company’s inventory velocity performance using turns or days (State number, compare to benchmark, explain relevance.):
Relate your inventory velocity performance to your gross margin and overall profitability.
Provide an overall summary of analysis to date including information from previous analysis cases and incorporating this new inventory velocity. (Tip, copy & paste your earlier work with feedback and add the new information.)


