I need somebody who really know about statistics
0
Solar Company Comparison I3
Jimmy Sunshine
QNT 275
January 3, 2017
Dr. Stephen Loro
I. INTRODUCTION
Research Problem
Solar Sells’ solar panel systems installation company may install fewer contracted sales than Off the Grid’s solar panel systems. This may result in decreased market share, losing customers to Off the Grid and loss of profits.
Purpose of the Research
To inform management of Solar Sells if a significant difference in kilowatt installation exists between the two competing solar panel companies.
Research Question
Is there a significant difference in Solar Sells and Off the Grid as measured by installation of solar kilowatts?
Null and Alternative Hypothesis
Null Hypothesis:
Ho: There is no significant difference in Kilowatt installation between Solar Sells and Off the Grid.
Ho: μ1 = μ2.
Alternative Hypothesis:
H1: There is a significant difference in Kilowatt installation between Solar Sells and Off the Grid.
H1: μ1 ≠ μ2.
Alpha
The alpha level of significance for this research is .05 as indicated by the management of Solar Sells.
Variable Definitions
A sample of 18 residential and business installations recorded each contracted job by the number of kilowatts installed for each company. A kilowatt is equal to 1000 watts. The data is quantitative, discrete, and ratio data.
REVIEW OF RELATED LITERATURE
Background
The companies Solar Sells and Off the Grid install solar panel systems to residential homes and businesses in California, Florida and Arizona. Solar Sells has been in business for three years and Off the Grid for one year. The management of Solar Sells would like to know if they are competitive in the solar energy market as compared to Off the Grid.
METHODOLOGY
Data Collection
Raw Data:
| Solar Sells | Off the Grid |
| 17 | |
| 10 | |
| 15 | 12 |
| 11 | 13 |
| 12 | |
| 18 | |
| 15 | |
| 20 | 20 |
| 12 | 19 |
| 19 | |
| 13 | 17 |
| 11 | |
| 11 | 14 |
| 20 | |
| 15 | 12 |
| 12 |
| Descriptive statistics | ||
|
| Solar Sells | Off the Grid |
| count | 18 | 18 |
| mean | 11.28 | 11.83 |
| sample standard deviation | 4.76 | 5.67 |
| sample variance | 22.68 | 32.15 |
| minimum | 3 | 3 |
| maximum | 20 | 20 |
| range | 17 | 17 |
| standard error of the mean | 1.12 | 1.34 |
| confidence interval 95.% lower | 9.08 | 9.21 |
| confidence interval 95.% upper | 13.48 | 14.45 |
| margin of error | 2.20 | 2.62 |
| 1.96 | 1.96 | |
| skewness | 0.12 | -0.06 |
| kurtosis | -0.42 | -1.23 |
| coefficient of variation (CV) | 42.23% | 47.91% |
| normal curve GOF | ||
| p-value | .6412 | .2787 |
| chi-square(df=2) | 0.889 | 2.556 |
| 3.600 | 3.600 | |
| O(-0.84) | 4 | 5 |
| O(-0.25) | 3 | 2 |
| O(+0.25) | 5 | 4 |
| O(+0.84) | 3 | 2 |
| O(inf.) | 3 | 5 |
Descriptive Statistics
Data Analysis
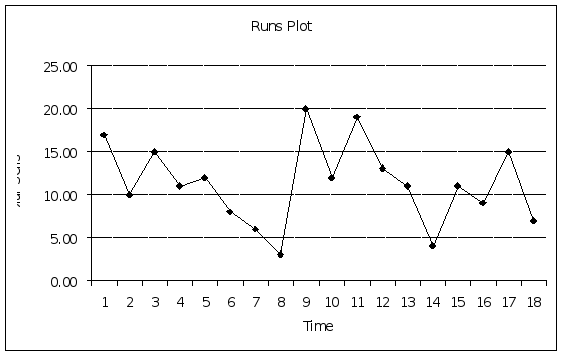
The count for each company was 18, meaning that the author collected the data of 18 jobs contracted by each company. The mean for Solar Sells was 11.28 kilowatts. The standard deviation, which is the average sample variability of scores in a distribution was 4.76. The sample variance, or squared deviation of the sample was 22.68.
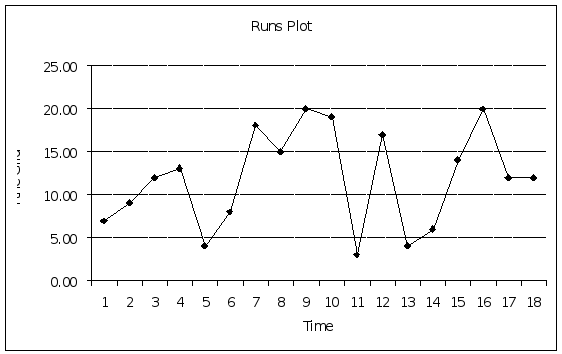
The minimum number of kilowatts installed for both companies was 3 kilowatts. The maximum for each company was 20 kilowatts. The range, or difference of minimum and maximum, for both companies was 17.
The standard error of the mean, meaning the degree to which a value varies from any given sample to another was 1.12 for Solar Sells. The lower 95% confidence level was 9.08. The upper 95% confidence level was 13.48. The margin of error was 2.20. The z score was 1.96. The skewness for Solar Sells was .12 with a kurtosis of -.42. The coefficient of variation (CV) for Solar Sells was 42.23%.
The mean Off the Grid was 11.83. The standard deviation, which is the average sample variability of scores in a distribution was 5.67. The sample variance, or squared deviation of the sample was 32.15. The standard error of the mean, meaning the degree to which a value varies from any given sample to another was 1.34. The lower 95% confidence level was and 9.21. The upper 95% confidence level was 14.45. The margin of error was 2.62. The z score was 1.96. The skewness for Off the Grid was-.06 and a kurtosis of -1.23. The coefficient of variation (CV) for Off the Grid was 47.91%.
Conclusion
A Goodness of Fit test was conducted on the data to determine if the data is parametric (normal) or non-parametric. The goodness of fit test returned values above the alpha level of significance of .05 determining that each data set has a parametric or normal distribution.
The Solar Sells appears parametric (p=.64). Retain the null hypothesis that the data is drawn from a normal distribution. The data from Off the Grid also appears to be parametric or normally distributed (p=.27). Retain the null hypothesis, the data does appear to be normally distributed.
There appears to be no difference between Solar Sells average of 11.28 and Off the Grids average of 11.83 average Kilowatt installation. These finding, however, may be due to chance. Further testing is recommended.
References
Loro, S. (2017). Course Syllabus QNT 275 Statistics for Decision Making. University of
Phoenix


