8 pages
Table 1
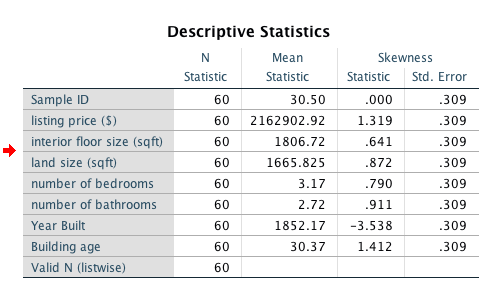
Table 2
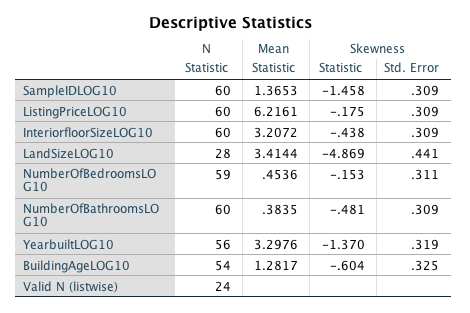
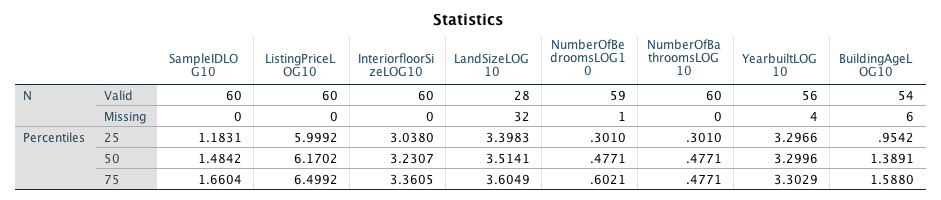
Table 3
Independent Variable Skewness Values
| Variable | Q1 | Q3 | Lower Boundary | Upper Boundary |
| Sample ID – Log 10 | 1.1831 | 1.6604 | 0.13304 | 2.71046 |
| Listing Price – Log 10 | 5.9992 | 6.4992 | 4.8992 | 7.5992 |
| Interior Floor Size – Log 10 | 3.038 | 3.3605 | 2.3285 | 4.07 |
| Land Size – Log 10 | 3.3983 | 3.6049 | 2.94378 | 4.05942 |
| Number of Bedrooms – Log 10 | 0.301 | 0.6021 | -0.36142 | 1.26452 |
| Number of Bathrooms – Log 10 | 0.301 | 0.4771 | -0.08642 | 0.86452 |
| Year Built – Log 10 | 3.2966 | 3.3029 | 3.28274 | 3.31676 |
| Building Age – Log 10 | 0.9542 | 1.588 | -0.44016 | 2.98236 |
Note: Q1 represents the 25th percentile and Q3 represents the 75th percentile. Lower Boundary = Q1 – ((Q3-Q1) X 2.2), and Upper Boundary = Q3 + ((Q3-Q1) X 2.2) (Hoaglin & Iglewicz, 1987)


