biology homework
Isolation of Chlorophyll Results Page
Name: Date:
PART A: Data Collection (25 points)
Sketch the graph showing the absorbance spectrum of chlorophyll isolated from spinach leaves. Correctly label axes.
Record the maximum absorbance and corresponding wavelength (nm) in Table 1.
| Sample | Absorbance Peak 1 | Wavelength (nm) at max. absorbance | Light Spectrum Color | Absorbance Peak 2 | Wavelength (nm) at max. absorbance | Light Spectrum Color |
| Fresh extract | ||||||
| Virgin olive oil | ||||||
| Regular olive oil | ||||||
| Light olive oil | ||||||
| Unknown sample |
PART B: Questions (25 points)
Which sample of olive oil had the highest amount of chlorophyll a?
What is the likely quality of the unknown olive oil? What is your evidence?
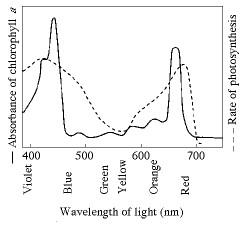
The figure shows the absorption spectrum for chlorophyll a and the action spectrum for photosynthesis. Why are they different?
Sunlight energy drives the light reactions, which produce _______________ and _______________.
The Calvin cycle uses _______________ and _______________ produced in the light reactions to reduce CO2 to _______________.
PART C: Scientific Writing – DISCUSSION SECTION (50 points)
Refer to the Template and Guidelines for Writing a Formal Lab Report. This section must be typed and attached to the Lab Results Page.
Write a DISCUSSION in the style indicated in the Formal Lab Report guidelines. Be sure to include the analysis of your results. What do the results mean? Is it what you expected?


