biology homework
Photosynthesis and Respiration in Algae Beads Lab
Based on BioRad Photosynthesis and Respiration Kit
Content Objectives:
1. Summarize the energy transformation process of cellular respiration and photosynthesis
2. Identify the metabolic pathways in cellular respiration that utilizes O2 and produces CO2.
3. Identify the metabolic pathways in photosynthesis that produce O2 and utilize CO2.
4. Interpret absorbance changes in a CO2 indicator buffer with cellular respiration and photosynthesis.
Process Objectives:
1. Measure the changes in absorbance in a spectrophotometer.
Introduction:
The biochemical pathways of photosynthesis transforms the energy of sunlight to the energy in chemical bonds. Photosynthesis fixes atmospheric CO2 into intermediates of glucose, and produces O2. Photoautotrophs not only make their own food, but they are the primary source of food for heterotrophs.
Since photosynthetic organisms have both chloroplasts and mitochondria, they can undergo photosynthesis and cellular respiration at the same. Photosynthesis occurs in two biochemical pathways called the light reactions, since sunlight energy drives this pathway, and the dark reactions, or the Calvin Cycle (Figure 10.6)
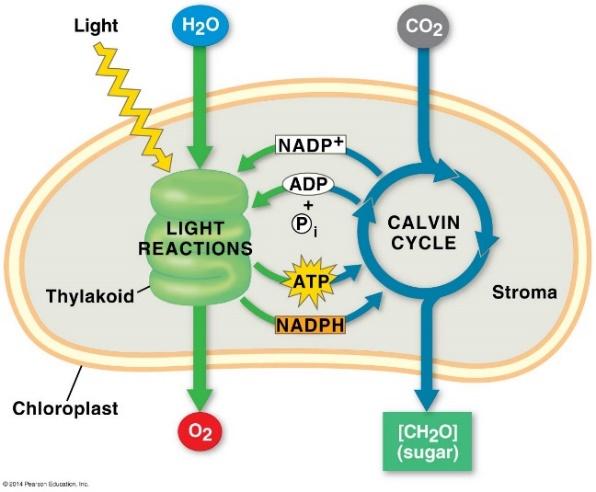
Figure 10.6 Summary of the Light Reactions and the Calvin Cycle.
While the summary equation for photosynthesis is the reverse of that for cellular respiration, completely different biochemical reactions occur in chloroplasts. However, there is an interdependence of the two energy transformation processes: the products of photosynthesis are the reactants used in cellular respiration.
The experimental system used in this investigation, Scenedesmus obliquus, is green freshwater unicellular algae. It is found in clean ponds, lakes and rivers world-wide. For these experiments, the algae are encapsulated in in alginate. Although this algae is not pathogenic, it should be disposed as a biohazard.
In this lab, you will the algae beads to measure rates of photosynthesis and cellular respiration. You will incubate the beads in a CO2 indicator solution that is sensitive to changes in pH caused by gaseous CO2 dissolving in water to form carbonic acid:
CO2 + H2O H2CO3 HCO3- + H+
When the CO2 indicator is at equilibrium with the atmosphere, it is dark orange. When the CO2 levels increase, it changes to yellow (more neutral; lower absorbance), and when CO2 levels decrease, it changes to purple (more basic; higher absorbance).
In this exercise, you will compare the rates of color change of the CO2 indicator caused by algae beads incubated under bright light and in complete darkness. The color/pH change of the CO2 indicator can be determined using the Indicator Color Guide or a spectrophotometer to measure the absorbance at 550nm.
Materials per student bench
2 cuvettes filled with ~15 algae beads
2-3 small plastic beaker
4-6 transfer pipets
Vernier Lab Quest
Vernier SpectroVis
Lamp with LED bulb or sheet of aluminum foil.
Ruler
10 ml equilibrated CO2 buffer in 15 ml centrifuge tubes
Cuvettes and caps
Distilled water dispensed in 15 ml centrifuge tubes
Indicator Color Guide
Protocols
Light Treatment: Photosynthesis
Set up SpectroVis first (instructions below)
1. Position a lamp about 10-15 cm above a white sheet of paper.
2. Obtain a cuvette containing the algae beads (Figure 1).
3. Use a transfer pipet to remove the CO2 indicator; discard in the buffer in a beaker.
4. Use a clean pipet to add ~ 2 ml of water to each cuvette and cap tightly. Gently invert the cuvette to mix the water and the beads.
5. Incubate, at room temperature, for about 5 minutes. Remove the water with a transfer pipet and discard the water.
6. Use a clean pipet to add ~ 2 ml of fresh equilibrated CO2 indicator solution to the cuvette and cap tightly. Gently invert the cuvette to mix the buffer and the beads. Incubate for ~1 min; remove buffer with a transfer pipet and discard
7. Use a clean pipet to add ~ 2 ml of fresh equilibrated CO2 indicator solution to the cuvette and cap tightly. Gently invert the cuvette to mix the buffer and the beads.
8. Place the cuvette under the light source. Gently rock the cuvette to make sure all beads have equal access to the light. Exposure the expose the cuvette with the clear side up.
9. Every 5 minutes, remove cuvette from under the light and measure the absorbance, at 550 nm, in the colorimeter.
10. Measure for a total of 30 minutes (6 readings).
11. Record the data on both the white board and in the Results Page.
Dark Treatment: Cellular Respiration
Set up SpectroVis first (instructions below)
1. Obtain a cuvette containing the algae beads (Figure 1).
2. Use a transfer pipet to remove the CO2 indicator; discard in the buffer in a beaker.
3. Use a clean pipet to add ~ 2 ml of water to each cuvette and cap tightly. Gently invert the cuvette to mix the water and the beads.
4. Incubate, at room temperature, for about 5 minutes. Remove the water with a transfer pipet and discard the water.
5. Use a clean pipet to add ~ 2 ml of fresh equilibrated CO2 indicator solution to the cuvette and cap tightly. Gently invert the cuvette to mix the buffer and the beads. Incubate for ~1 min; remove buffer with a transfer pipet and discard
6. Use a clean pipet to add ~ 2 ml of fresh equilibrated CO2 indicator solution to the cuvette and cap tightly. Gently invert the cuvette to mix the buffer and the beads.
7. Carefully wrap the cuvette with aluminum foil and incubate at room temperature.
8. Every 5 minutes, remove cuvette from the foil, measure the absorbance in the spectrophotometer, and wrap again with the foil.
9. Measure for a total of 30 minutes (6 readings).
10. Record data on both the white board and in the Results Page.

Figure 1. Acclimated algae beads. Note: CO2 indicator buffer of activated algae beads is a may be a different color than shown.
Set up SpectroVis Plus
1. Use the stylus to open the pull down menu under Sensors, select Data Collection (Figure 2a)
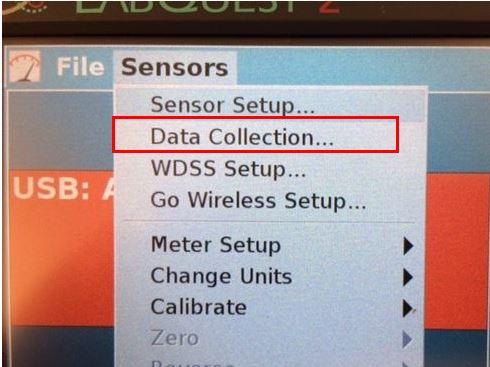
Figure 2a. Sensors menu for Data Collection
2. Select Full Spectrum (Figure 2b). Adjust sample time to 10-100 ms, wavelength smoothing 10, and 0 samples to average. Select OK.
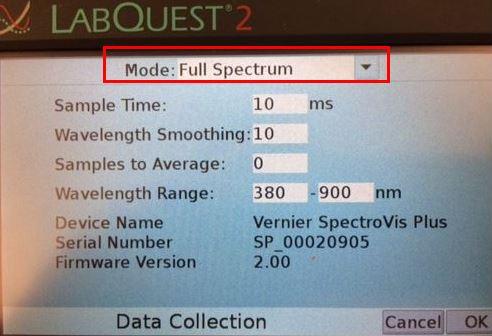
Figure 2b. Data Collection Full Spectrum Mode.
3. Calibrate the SpectroVis. Return to the Sensors Menu, select Calibrate, USB Spectrophotometer (Figure 3a)
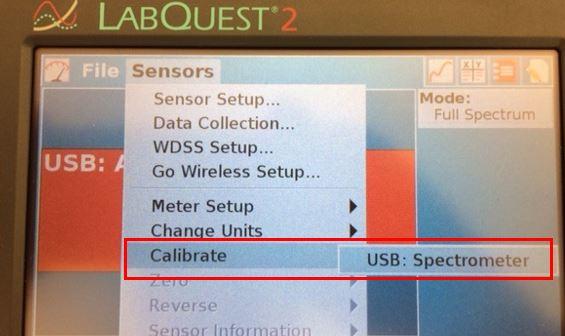
Figure 3a. Sensors Menu for calibration of SpectroVis
4. Wait until the warm up time is finished (Figure 3b)
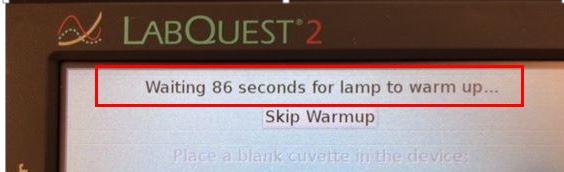
Figure 3b. Lamp warm up time
5. Insert cuvette with blank solution at the prompt (Figure 3c)


Figure 3c. Screen prompt to place blank cuvette in SpectroVis
6. Select Finish Calibration (Figure 3 d) 
Figure 3d. Screen image for Finish Calibration
7. The screen will show Calibration Finished (Figure 3e). Select OK
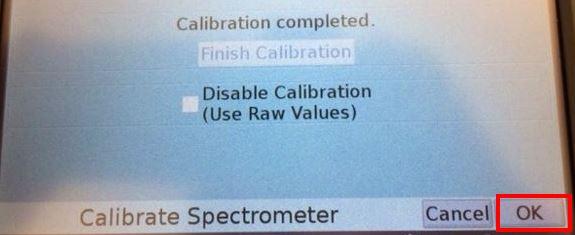
Figure 3e. Screen image Calibration completed.


