data analysis
Data Analysis Assignment #2
Spring 2017
STAT 250
Your submitted document should include the following items. Points will be deducted if the following are not included:
Type your Name, STAT 250 with your correct section number (e.g. STAT 250-xxx) and Data Analysis Assignment #2 centered on the top of page 1 of your document.
Number your pages across your entire solutions document.
Your document should include the ANSWERS ONLY to the following FOUR questions with each answer labeled by its corresponding number and subpart. Keep the questions in order. Do NOT include the questions in your submitted document. Please see posted model solution as an example.
Generate all requested graphs and tables using StatCrunch.
Upload your document onto Blackboard as a Word or pdf document using the link provided by your instructor.
Elements of good technical writing:
Use complete and coherent sentences to answer the questions.
Graphs must be appropriately titled and should refer to the context of the question.
Graphical displays must include labels with units if appropriate for each axis.
Units should always be included when referring to numerical values.
When making a comparison you must use comparative language, such as “greater than”, “less than”, or “about the same as.”
Ensure that all graphs and tables appear on one page and are not split across two pages.
Show all mathematical calculations when directed to compute an answer ‘by-hand.’
When writing mathematical expressions into your document you may use either an equation editor or common shortcuts such as:  can be written as sqrt(x),
  can be written as p-hat,
  can be written as x-bar.
Instructions
This data analysis assignment will use both StatCrunch applets to simulate random actions and the results from a survey administered to a nationwide random sample of high school students found in our StatCrunch group titled CensusAtSchool.
Question 1
1a. Use StatCrunch to construct an appropriately titled and labeled scatterplot with “Armspan_cm” as the explanatory variable and “Height_cm” as the response variable. Copy your scatterplot into your document.
1b. Use Stat-> Summary Stats->Correlation to compute the correlation between “Armspan_cm” and “Height_cm”. Copy the table into your document.
1c. Use StatCrunch to construct an appropriately titled and labeled scatterplot with “Footlength_cm” as the explanatory variable and “Height_cm” as the response variable. Copy your scatterplot into your document.
1d. Use Stat-> Summary Stats->Correlation to compute the correlation between “Footlength_cm” and “Height_cm”. Copy the table into your document.
1e. If you were trying to predict a high school student’s height, would you be able to make a better prediction by knowing the student’s armspan or footlength? Use the scatterplots and correlation values from parts 1a-1d to justify your choice of armspan or footlength by comparing their shapes, trends and strengths.
1f. Use StatCrunch to conduct a regression analysis to predict a student’s height using their armspan. Use Stat->Regression->Simple Linear.
Copy only the simple linear regression results (as shown below) into your document.
Simple linear regression results:
Dependent Variable:
Independent Variable:
Height_cm =
Sample size:
R (correlation coefficient) =
R-sq =
Estimate of error standard deviation:
1g. Interpret the value of the slope (rounded to three decimal places) in the regression equation found in part 1f in the context of the question, using a complete sentence.
1h. Use the regression equation (with both intercept and slope rounded to three decimal places) to predict the height of a student (in cm) if their armspan was found to be 165 cm. Show all of your hand calculations and remember to include units in your final answer.
1i. Interpret the value of the coefficient of determination (R-sq expressed as a percentage) in the context of the question in a complete sentence.
Question 2
2. We will be comparing empirical (relative frequencies based on an observation of a real-life process) to theoretical (long-run relative frequency) probabilities. We will use StatCrunch to simulate rolling two dice. Conduct the following simulation by using the steps below:
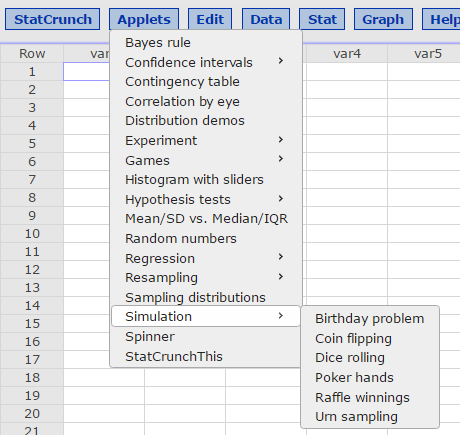
Step 1:Under Applets -> Simulation-> Select Dice rolling from the menu.
Step 2: In the applet window, enter 6 for the number of sides and 2 for the number of dice.


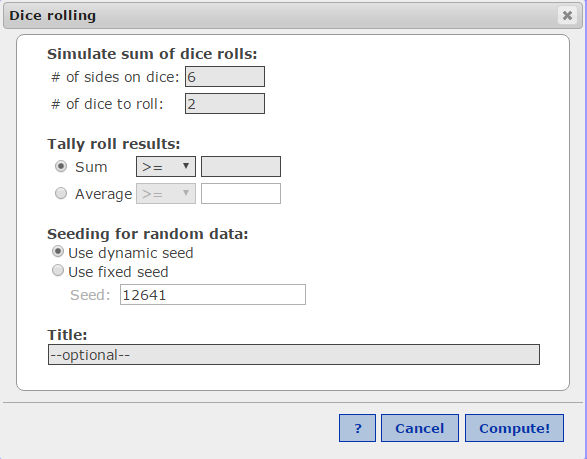
Step 3: Select Compute!
Step 4: Select 1000 runs to simulate rolling the two dice 1000 times as shown below. The result of this simulation will appear as a bar graph.
 Step 5: Clear this box for part 2a (none of the bars in the chart will now be highlighted).
2a. Copy your chart into your document using options->copy. NOTE: You will use this result to answer parts 2b-2d.


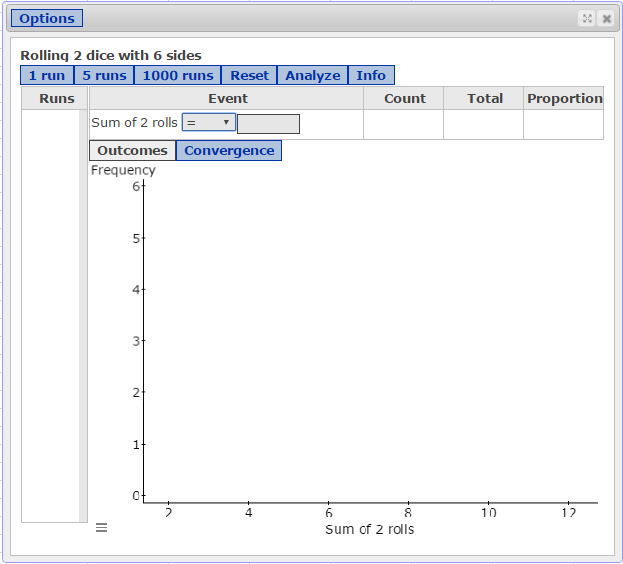
Box 2: Use this box to enter specific values in part 2b-2d.
Box 1: Use the down arrow to change the equality/inequality sign from >=, >, =,<=, or <
YOUR RESULT WILL APPEAR HERE
Using your result from the 1000-run simulation found in part 2a, find the following three proportions for parts 2b-2d and then compare these empirical probabilities with their theoretical probabilities. DO NOT GENERATE ANOTHER RESULT. You only need to adjust the information in boxes 1 and 2 above to answer parts 2b-2d.
2b. Under Event in the applet, enter: “Sum of 2 rolls equals 5.” Use options->copy to copy this chart into your document.
Now calculate the theoretical probability that “Sum of 2 rolls equals 5” using the sample space of 36 possible outcomes (shown in examples in class and textbook page 212). State this probability as a decimal to three decimal places in a sentence.
In another sentence, compare your empirical probability (found in the simulation) to the theoretical probability of obtaining a sum of 2 rolls equal to 5. Remember to justify your answer by including the values.
2c. Under Event now find: “Sum of 2 rolls greater than or equal to 5.” Use options->copy to copy this chart into your document.
Now calculate the theoretical probability that “Sum of 2 rolls greater than or equal to 5” using the sample space of 36 possible outcomes (shown in examples in class and in textbook page 212). State this probability as a decimal to three decimal places in a sentence.
In another sentence, compare the empirical probability (found in the simulation) to the theoretical probability of obtaining a sum of two rolls that is greater than or equal to 5.
2d. Under Event find: “Sum of 2 rolls less than 5” Use options->copy to copy your answer into your document.
Now calculate the theoretical probability that “Sum of 2 rolls less than 5” using the sample space of 36 possible outcomes (shown in examples in class and in textbook page 212). State this probability as a decimal to three decimal places in a sentence.
In another sentence, compare the empirical probability (found in the simulation) to the theoretical probability of obtaining a sum of two rolls that is less than 5.
Question 3
The variable “Armspan_cm” in the CensusAtSchool data set represent the lengths of the students’ armspans in cm (measured as distance across the back from tip of right hand middle finger to tip of left hand middle finger when arms are wide open).
3a. Construct a relative frequency histogram of the variable “Armspan_cm” and overlay your histogram with a Normal model using the ‘display options’ as shown: 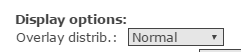
DO NOT TITLE OR LABEL THIS GRAPH and you will notice that the mean and standard deviation of this variable appears at the top of your chart. Copy your graph into your document.
Use the following information to answer parts 3b-3e. As the distribution of “Armspan_cm” appears roughly Normally distributed, we will use the Calculator on StatCrunch to find probabilities associated with given armspan lengths following the steps below. Note: we are using our sample statistics as an approximation of the true population parameters for armspan lengths in cm.
Step 1: Open the calculator by selecting Stat->Calculators->Normal as shown below.
Standard – shows area above or below a specified x value.
Between – shows area between two specified x values.


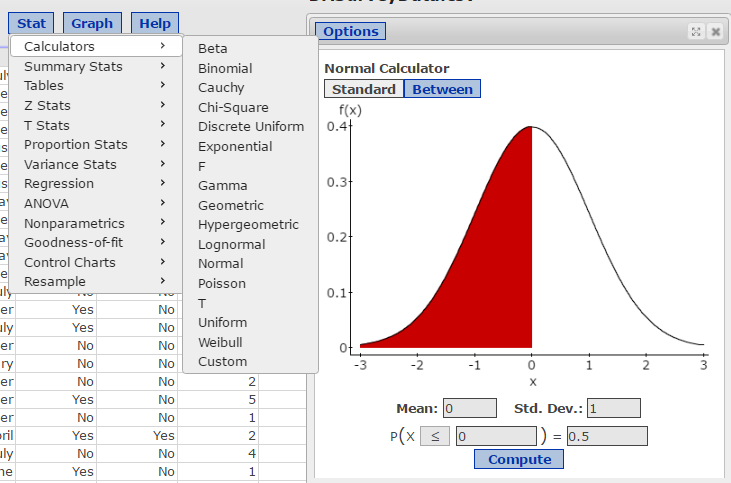
Select to change the direction of the inequality sign
Step 2: Enter the rounded values for the mean and standard deviation shown in your graph in part 3a into their respective boxes.
3b. Use the StatCrunch calculator to find the probability that a randomly selected student has an armspan of 160 cm or less. Copy your graph into the document.
3c. Use the StatCrunch calculator to find the probability that a randomly selected student has an armspan of 175 cm or less. Copy your graph into the document.
3d. Use the StatCrunch calculator to find the probability that a randomly selected student has an armspan of between 160 cm and 175 cm. Copy your graph into the document.
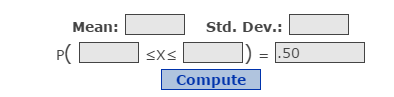
3e. Use the StatCrunch calculator to find both the first and the third quartiles (Q1 and Q3) for armspan lengths, i.e., the values which enclose the middle 50% of the distribution. Select the ‘Between’ option, keep the same rounded values for the mean and standard deviation for armspan lengths, and enter 0.50 as shown below. Copy your graph into your document.
3f. Use the values obtained in part 3e to compute the IQR for armspan lengths. Round this value to two decimal places. Explain this value in a sentence using units and the context of the problem.
Question 4
The variable “Allergies” in the Census at School data set is a categorical variable which has only two possible outcomes as people responded to the question, “Do you have any allergies?” by answering either Yes or No. We will use this variable to investigate a binomial model for this population.
4a. Use StatCrunch (Stat->Tables->Frequency) to find the frequency and relative frequency of the variable “Allergies”. Copy the table into your document. After you have copied this table into your document, round the relative frequency values to two decimal places in your table.
Use the following information to answer parts 4b-4c. We will now use the Calculators -> Binomial to investigate binomial probabilities. Open the binomial calculator as shown below. We are going to randomly select ten of these students and ask them if they have allergies. In this binomial setting we will be using n=10 and we are interested in the proportion of students who have allergies (responses of “YES”) found in part 4a rounded to two decimal places. Note: As the population size is much larger than the sample size (more than 10 times larger), conditions for a binomial model have been met.


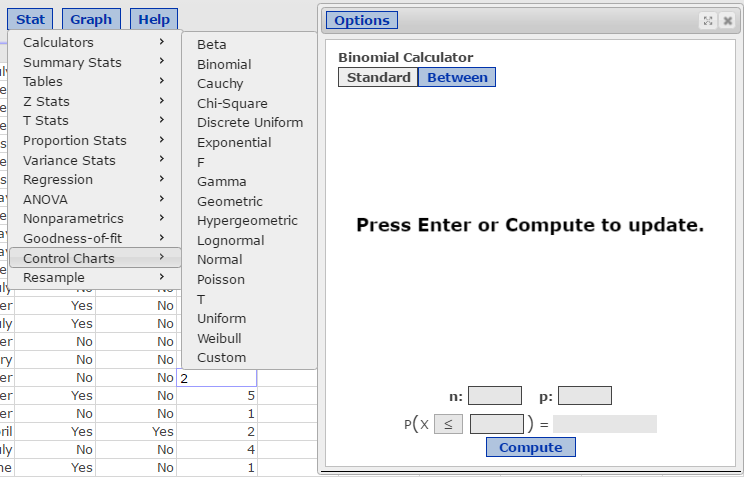
Use Between – to find probabilities between two specified x values.
Enter the value for n and the rounded value for p below
Use Standard –to find probabilities above or below a specified x value.
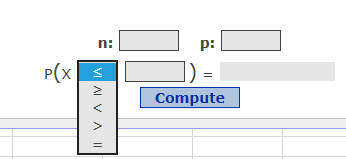
Note: Use this box to change the equality/inequality symbol to match the question.
4b. Use the StatCrunch calculator to find the probability that if 10 students are randomly selected, at most three students would say that they have allergies. Copy your graph into the document.
4c. Use the StatCrunch calculator to find the probability that if 10 students are randomly selected, more than five students would say that they currently have allergies. Copy your graph into the document.
4d. Use the StatCrunch calculator to find the probability that if 10 students are randomly selected, more than two but less than seven students would say that they currently have allergies. Copy your graph into the document.
4e. Calculate “by-hand” the mean and standard deviation (with units) for this binomial setting. Show all of your work including formulas. Round your answers to two decimal places.
11


