Consulting Plan
Consulting Plan 13
Consulting Plan
Consulting Plan
Introduction
A successful consulting project utilizes an effective performance measurement system. Consultants must select a system – a performance scorecard – to track performance. These various systems vary in complexity, ease of use, “fit” to the task at hand and comprehensiveness. When used correctly, the scorecard will guide the organization’s investment in and management of consulting projects.
Uber was launched in 2009 as a ride-share transportation network that leverages technology to dispatch nearby drivers operating as independent contractors to people in need of transportation. Since the launch, Uber has disenfranchised drivers through policies that are seen to heavily favor the rider experience, at the expense of driver safety and earnings. The chosen consulting project is to evaluate the needs of the driver training and development program in order to attract and retain good drivers by improving their overall experience.
SWOT Analysis
The consulting project is analyzed for its value to the client, and to the consulting organization, in regards to the strengths, weaknesses, opportunities, and threats (SWOT) presented. The SWOT analysis is found in Appendix A. Strengths identified are that the process under evaluation – driver training and development – is critical to Uber’s success, and the results of the engagement will be measurable regarding the impact to customer satisfaction. Management uses a consultant as a third party to improve the chances of a driver’s acceptance of the changes.
A related opportunity presented by the project is to similarly improve the customer experience with happier drivers. For the consulting organization, this project represents an opportunity to further grow into the expanding “share” industry that continues to expand through technology into new areas, such as overnight accommodations and fund sourcing. This rapidly changing technology threatens to make project recommendations obsolete to Uber, as does turnover and dissent in upper management ranks. New management could terminate the project, redefine its scope, or ignore recommendations of the firm hired by previous leadership.
The current levels of driver dissatisfaction with Uber management make a driver’s cooperation in concerning the project difficult. The focus on the driver experience may not adequately address needs and expectations of customers. These are potential weaknesses in the approach chosen for this consulting project.
Balanced Scorecard
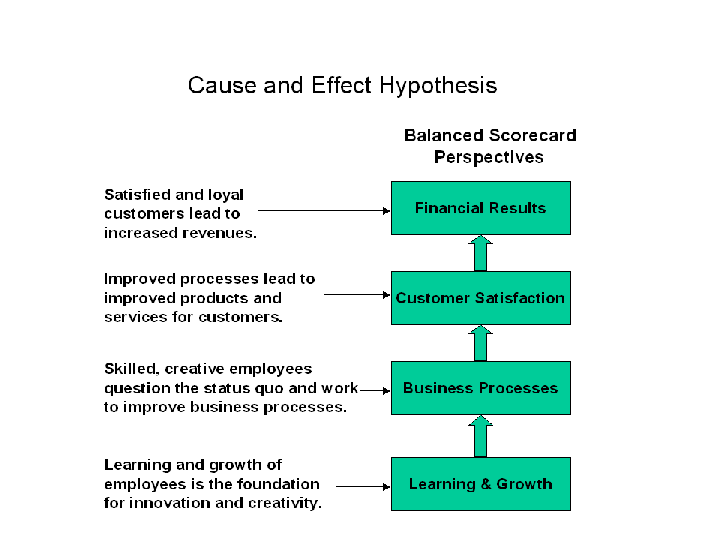
This SWOT analysis is used to propose a Balanced Scorecard for the project as a tool for measuring project performance. Project outcomes will be measured by their impact on Uber’s finances, customers, internal business processes, and learning and growth of the organization (in this case, the drivers). The Balanced Scorecard for this project is found in Appendix B.
Causal Chain Scorecard
The Causal Chain Scorecard (see Appendix C) is an optional system for measuring project performance. This scorecard ultimately determines a return for the project: the extent to which monetary benefits resulting from the project exceed the actual cost of the project. The measurement system must be fed data representing multiple perspectives of the project.
The first category of measurements to be considered is the inputs that define the scope of the project: the tasks, people, and time. For the Uber project, this includes a number of consultants and their defined roles; functional areas of the project; time engaged in each function and activity of the project.
The second category of measurements is cost of all inputs. Costs to be considered are the consultants’ compensation based on time on task, and all related expenses and tools needed to perform the activities. These costs are tracked by consultant and functional area within the project. These functional areas could include reviewing training content, evaluation of the learning platform, surveying drivers, implementation of changes.
Reaction measures and satisfaction data
According to Kaplan and Norton, “The core of any business strategy is the customer-value proposition, which describes the unique mix of product, price, service, relationship, and image that a company of offers” (Kaplan & Norton. 2015. Para 1. P. 93). The reaction and satisfaction measures consist of skills, knowledge, and the perspectives concerning the establishment along with stakeholders. Consequently, “training reactions are the most common criteria used for training evaluation, and reaction measures often included opportunities for trainees to provide a qualitative response” (Harman, Ellington, & Surface. 2015. P.1)
In addition, the collection of data from various programs within the Uber administration compared to the new programs illustrates the development. The data collected displays reactions and satisfaction. Furthermore, customer feedback data reveals the real satisfaction from the customers delivers the essential measurement for an organization. Reaction and satisfaction data displays through the completion of training and the development emphasize from the drivers.
Learning measures: changes in knowledge, skills, and perceptions
To examine the learning measures of the individuals employed with a company consists of the changes in their knowledge, skills, and perceptions. Therefore, the frequency and usage of an individual’s knowledge, skills, and perceptions are some important measures to take into consideration when working for certain companies that are being consulted. The business uses some valuable and objective measures in regards to the employee’s pre- and post-knowledge during the training sessions. These measures give the companies that are being consulted a better understanding of the trainee’s knowledge while attending the training. During the training sessions, the observation of employees consists of their measurable and meaningful skills that they bring to the business. Also during the training sessions, the trainee’s perceptions and attitudes are monitored because companies that are being consulted hires numerous active and eager to work employees. It is important to have productive and efficient training programs in place at all potential clients and customers that are looking for consulting assistance. The training cycles at these companies are not complete without some evaluation of the training effectiveness, and this process leads to some decision-making along with plans for the future training sessions. It is imperative to have useful and informative assessment programs included in the overall training programs so that the training sessions will be efficient and successful. (Phillips, J. J., Trotter, W. D., & Phillips, P., p.160)
Impact measures
Based on information obtained from the resource-established aspect, interconnection was mainly backing the origination of comprehension as well as comprehension namely disbursed amongst its associates. Additionally, the exchange established aspect highlights the consumers along with markets necessities and continued to be provided by distributed and adjustable companies/organizations. In the resource-based view, and market-based view, obscured determinants like client affiliations, modifications, and information are important representations in the network’s progress. The very successful challenge of hidden study is efficiently provided proof concerning a firm's financial success, covered determinants, and obscured impenetrable accomplishment.
Intangibles revealed important formations alternately actual financial worth accumulation exercises (amounting to familiar remarks “intangible value drivers”) that indicate causation and end productions association (Abeysekera, 2006). The (BSC) “balanced scorecard,” that are very frequent instances concerning a mounting administration assessment structure, concludes because capable of a chain reaction connection among obscured reserves and condensed accomplishment inside its four way of looking (growth, learning, finances and clients). In regards to the idea of critical administration, some differentiations created amidst internally familiarized resource established views also externally familiarized established the look.
ROI measures
In our consulting model for training implementation and improvement, we will measure our ROI on our training initiative, the online platform utilized, as well as the online training curriculum which developed for the training. In order to ensure we have implemented an effective consultant plan, we will have to refer to the return on investment (ROI) measures, as these will allow us to track the finances that are utilized in order to implement the plan.
When breaking down the return on investment data, we have to ensure that we are also taking into consideration several aspects, which include staffing performance measurements (measuring the impact the employees knowledge has on the business), customer satisfaction levels (what can be done in order to increase new business) and most important of all, the amount of revenue that was invested into the project (Phillips, Trotter, & Phillips, 2015, p. 112). As the consultant plan is tracked, we want to make sure that we maintain the cost inline and follow the timeline generated as this may be costly if it is not achieved on time.
Comparison: the causal chain scorecard to others scorecards.
When comparing the causal chain scorecard to other types, we can see that it has several different types of data that are tracked and is utilized to identify results for the consulting plan implemented. The causal chain scorecard reflects the measures taken when creating and executing a consulting program. Included in this scorecard are the following areas, cost, reaction, learning, application, impact and ROI measures (Phillips, Trotter, & Phillips, 2015, p. 157). Other scorecards may include different KPI’s (key performance indicators), which can be used to track daily/weekly sales statistics for an individual team, or for an entire organization. With this type of scorecard, you can identify the areas of opportunity as well as the high points.
Conclusion
After reading this paper and learning about Uber and the various functions the company has such as conducting a SWOT analysis to determine the business strengths and weaknesses. The casual chain scorecards measure project performances along with opportunities and threats. In addition, the consulting plan examines the learning measures, intangible, tangible data, discussing the ROI measures and from other types of scorecards that Uber initializes as a service. Uber managed to stay in business with the many tools that are mention in this paper, and most important the performance of the company which sets high standards for the company riders is a result of years of hard work and dedication. Utilizing different factors can also determine where the corporation been and where it's headed by using the simple functions from this paper.
References
Abeysekera, I. (2006), “The project of ICD: researching the research,” Journal of
Intellectual Capital, Vol. 7 No.1, pp. 61-77.
Harman, R. P., Ellington, J. K., Surface, E. A., & Thompson, L. F. (2015). Exploring qualitative
training reactions: Individual and contextual influences on trainee commenting. Journal of Applied Psychology, 100(3), 894-916. doi:http://dx.doi.org/10.1037/a0038380
Phillips, J. J., Trotter, W. D., & Phillips, P. P. (2015) p160. Maximizing the value of consulting:
a guide for internal and external consultants.
Ruzic, M. D., Skenderovic, J., & Lesic, K. T. (2016). Application of the Mamdani Fuzzy Inference
System to Measuring HRM Performance in Hotel Companies – A Pilot Study. Terorija in Prakasa, Teorija in Praksa, 53(4), 976-999, 1025. Retrieved from https://search.proquest.com/docview/1841722971?accountid=458
Appendix A: SWOT Analysis
| Strengths | Weaknesses |
| Addresses a critical function of the operation | Neglects the customer perspective |
| 3rd party improves likelihood of driver acceptance | Driver cooperation unlikely |
| Results are measurable and impactful |
|
|
|
|
| Opportunities | Threats |
| Satisfied drivers will impact customer satisfaction | Constantly changing technology could render recommendations obsolete |
| Demonstrate capabilities in the growing "sharing" industry | Turnover in senior management |
|
|
Appendix B: Balance Score Card
| Financial |
| Customer |
| Internal Processes |
| Learning and Growth | ||||||||||
|
|
|
| ||||||||||||||
|
|
|
|
|
|
|
|
| |||||||||
| Increased revenue per driver | Increase number of unique riders | Growth in new drivers | Driver mobility into management | |||||||||||||
| Growth in driver daily income | Increased length of average ride | Improved driver retention | Driver participation in training program | |||||||||||||
| Reduced costs and claims | Improved customer satisfaction results | Shortened driver training time | ||||||||||||||
Appendix C: Causal Chain Scorecard