Elementary School Asthma Education Intervention Plan
Running head: TOOLS FOR INFORMATICS
Tools for Informatics: A Report on the Asthma Dataset
Joseph Toole
Public Health Informatics
22 Mar 2017
Introduction
Accurate interpretation of health data plays a big role in supporting decision making processes such as stock taking and allocation of resources. Therefore, tools of informatics such as spreadsheets, statistical tools and relational databases play a key role in health data processing. Spreadsheets are used to hold data in rows and columns which can then be processed through both mathematical and logical comparisons and reports generated from that data. Relational databases hold data in tables, which are interlinked and reports can be generated through queries. On the other hand, statistical tools such as Matlab, are used to perform statistical calculations for trend analyses and generation of reports. Therefore, these tools are so important when managing large databases of public health informatics because of the following reasons.
To start with, these tools enforce data integrity. Data integrity refers to data: completeness, consistency and accuracy. Therefore, they help people clean datasets, which improves the quality of the reports generated by these tools. For example, using relational databases, use of referential integrity in table relationships restricts the entry of duplicate values. Validation rules enforce completeness and accuracy and are all found in those tools (Han, Pei & Kamber, 2011).
Besides that, these tools are able to use statistical, mathematical and logical procedures to interpret vast amounts of data. For example, the use of SQL queries to pull data from tables in relational databases, use of mathematical and logical functions such as IF in spreadsheets and use of regression in statistical analysis in statistical tools. Apart from performing such calculations, the tools use visualizations and other summarization techniques to enable users make sense of the health informatics data (Han, Pei & Kamber, 2011). The summarized data can be used in reporting and other tasks. The following section is a detailed interpretation of the asthma dataset.
Database Analyses
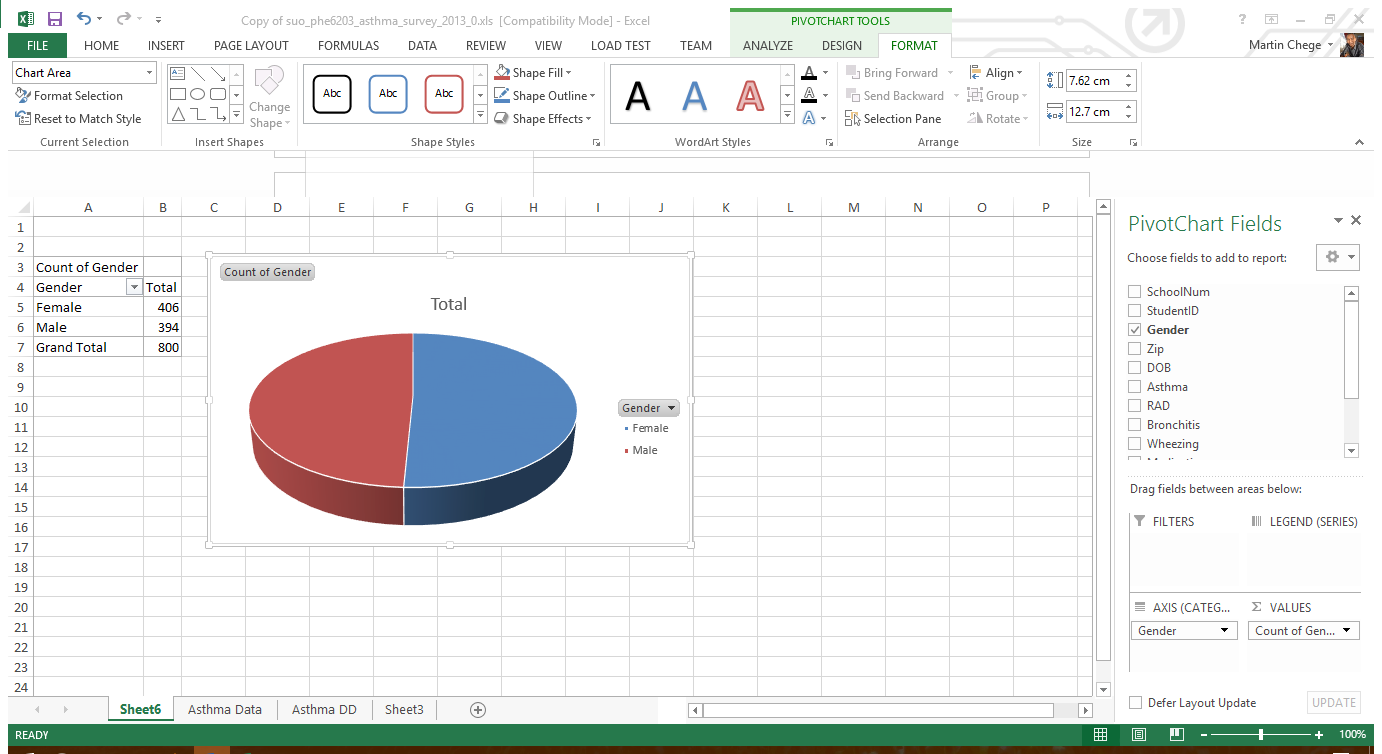
Are there more males or females in the survey population?
In the survey population, there are more females than males. Based on the summarized report, there are 406 female students while there are just 394 males. The following diagram shows the report.
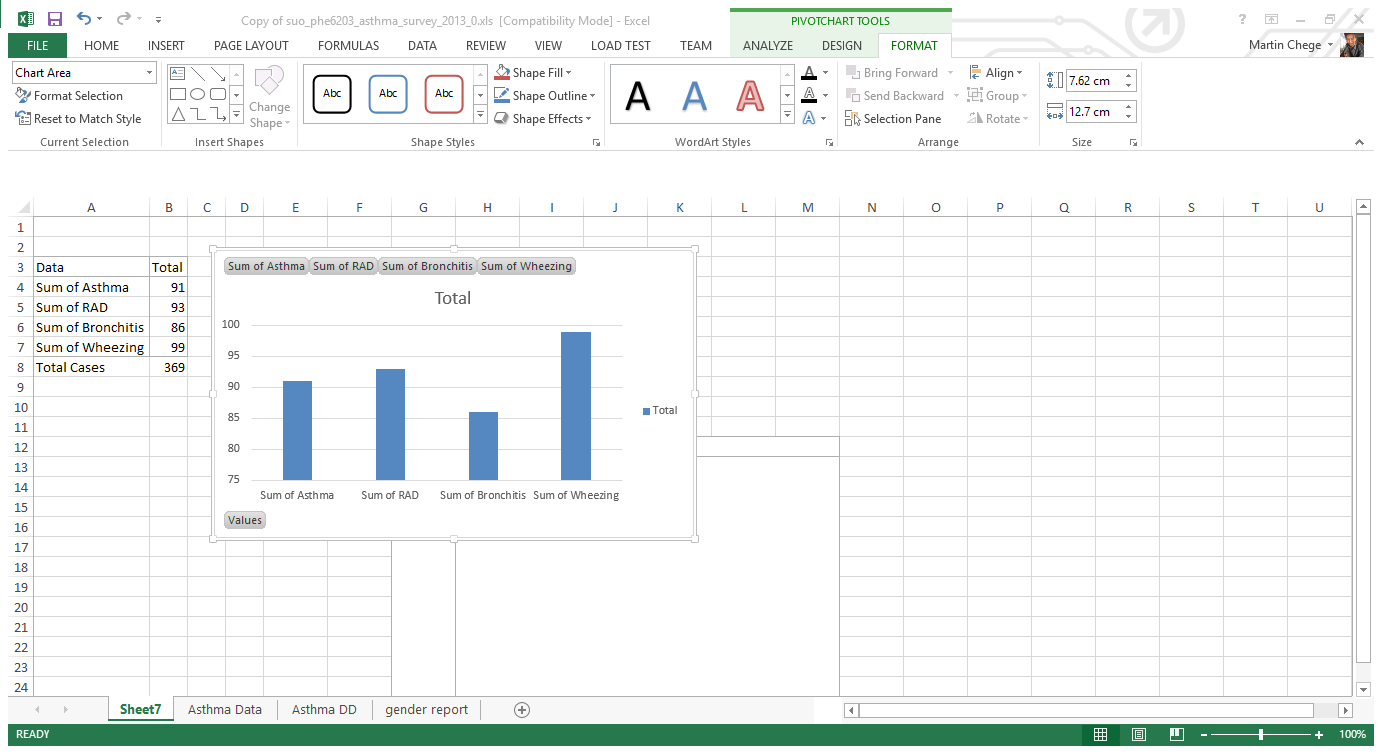
Which condition has the highest frequency?
Given the fact that cases with each condition was indicated by a 1 (for presence of) or 0 (absence of), the data was analyzed by calculating the sum of the cases which also gives the frequency if those cases. Based on the dataset, Wheezing is the condition that had the highest frequency as supported by the following pivot table.
Which month had the highest number of students with breathing difficulties?
Based on the information provided in the Asthma dataset, it difficult to pinpoint the months that had breathing difficulties because of the fact that there is no attribute containing that information. The fields such as missing days and number of days missed in the last month of school are not sufficient to derive such information.
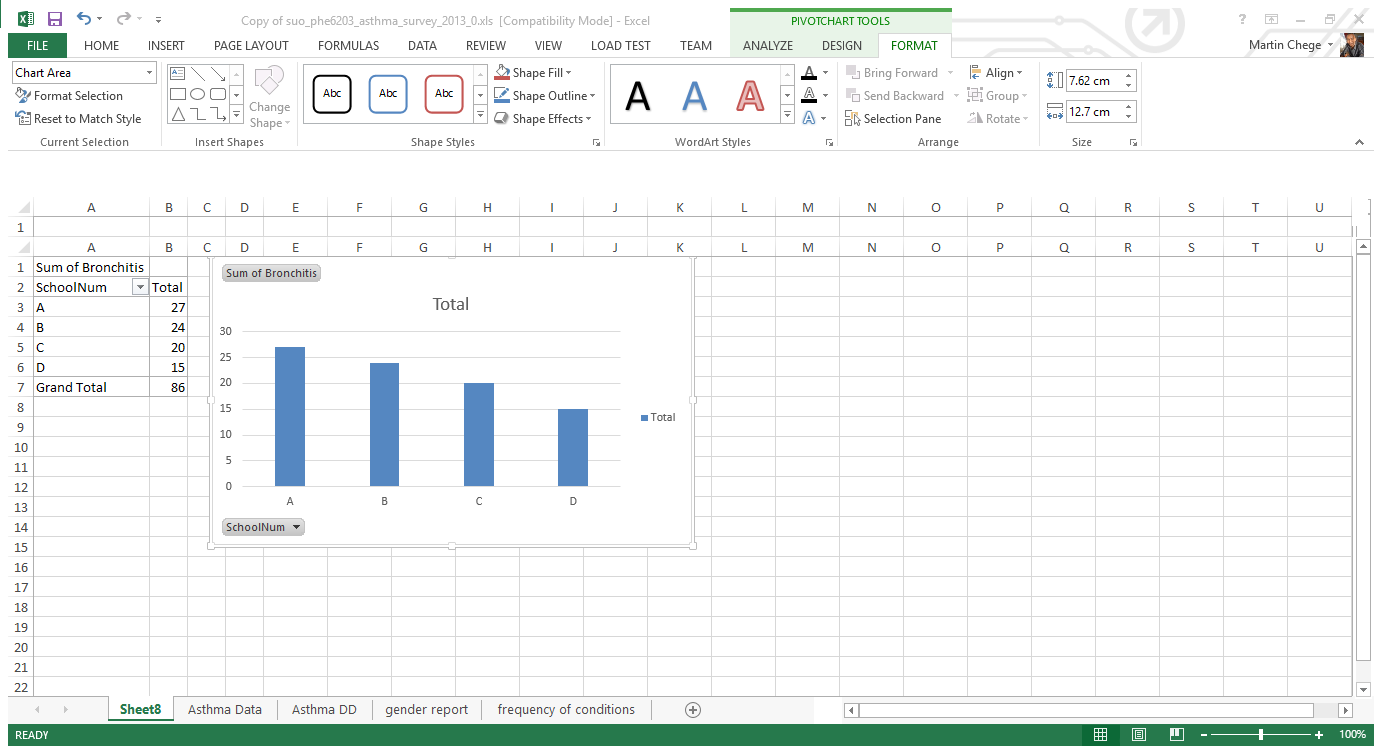
Which school had the highest frequency of students with bronchitis?
School A had the highest frequency of students with bronchitis as shown in the following table and chart.
Which gender has the highest frequency of asthma?
Males had more asthma cases (48) than females (43).

How many students answered yes to Reactive Airway Disease (RAD)?
93.

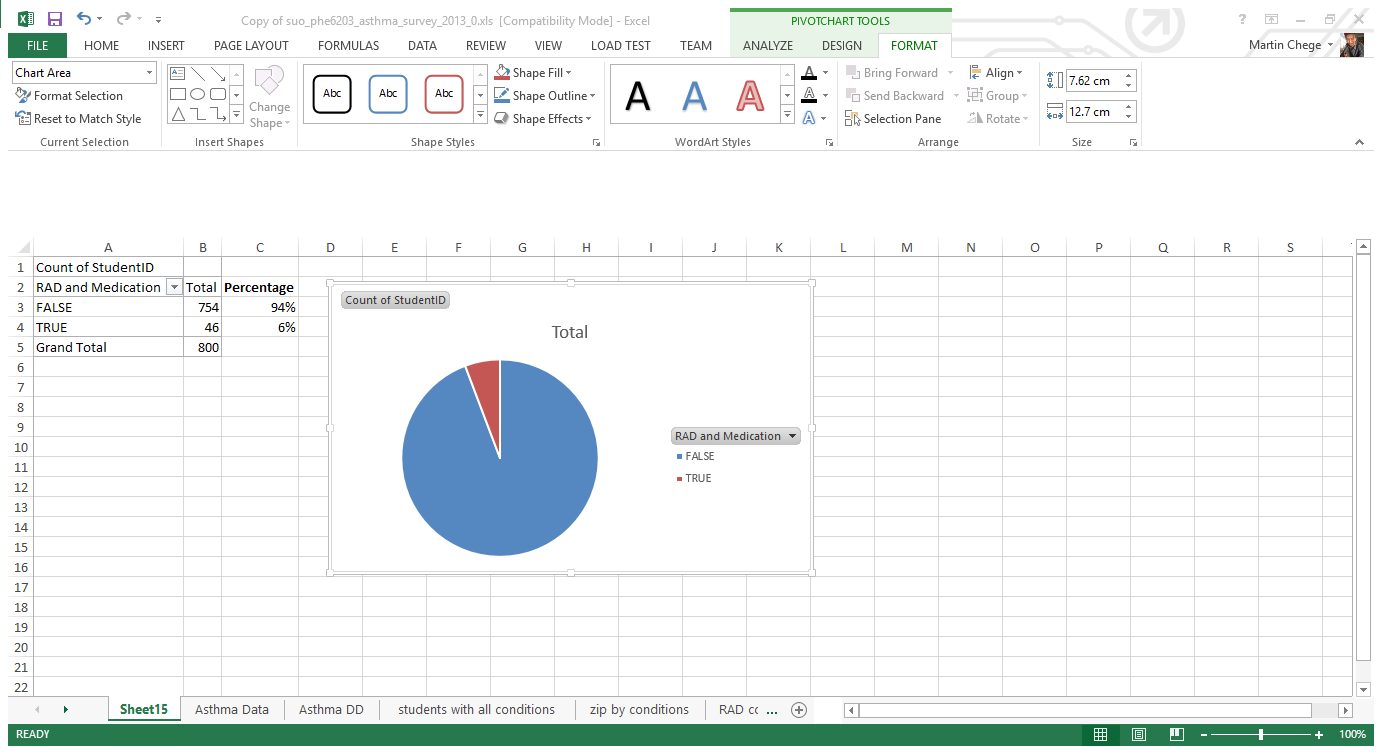
What is the percentage of students with RAD that have been prescribed medication?
6%.
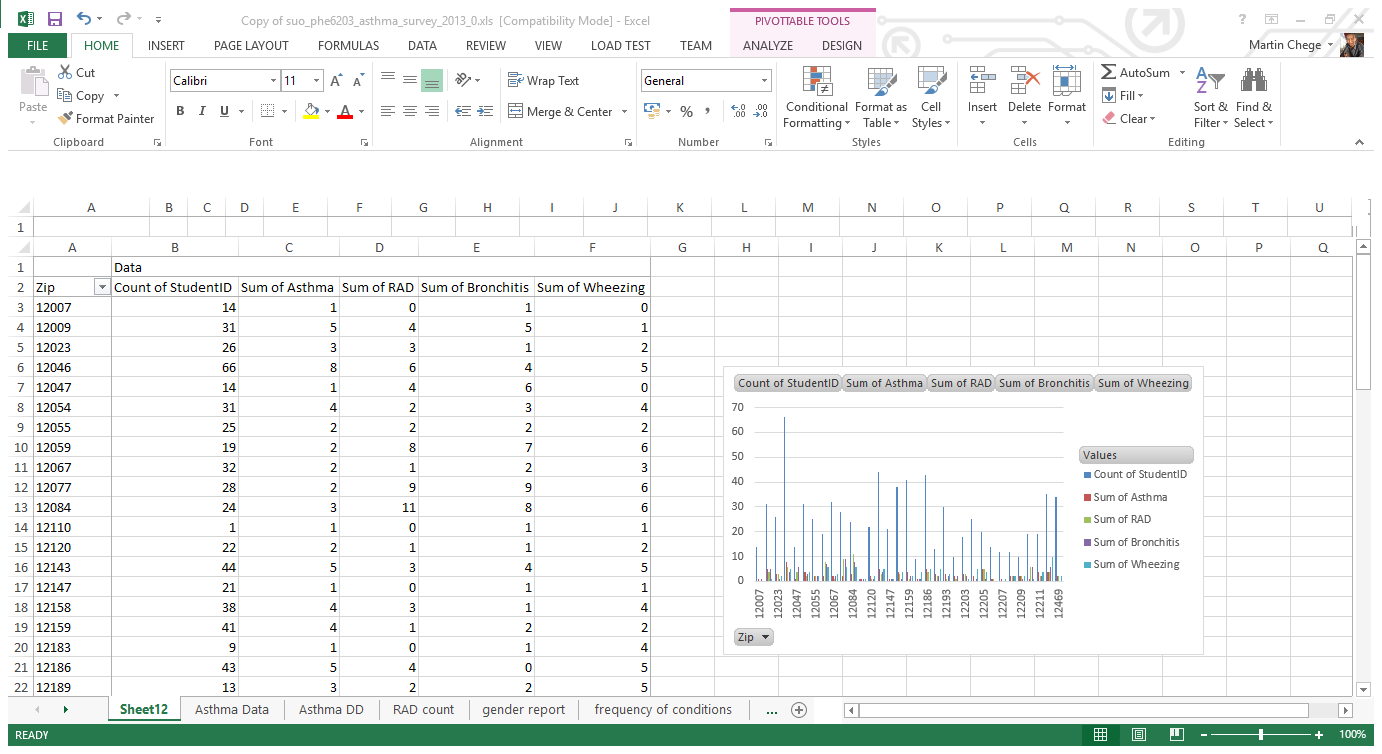
Which zip code has the highest number of students living in it? Of that zip code, which condition had the highest frequency?
Zip 12046 had the highest number of students living in it. In that zip code, asthma is the condition that had the highest frequency. The following diagram shows a report verifying that statement.
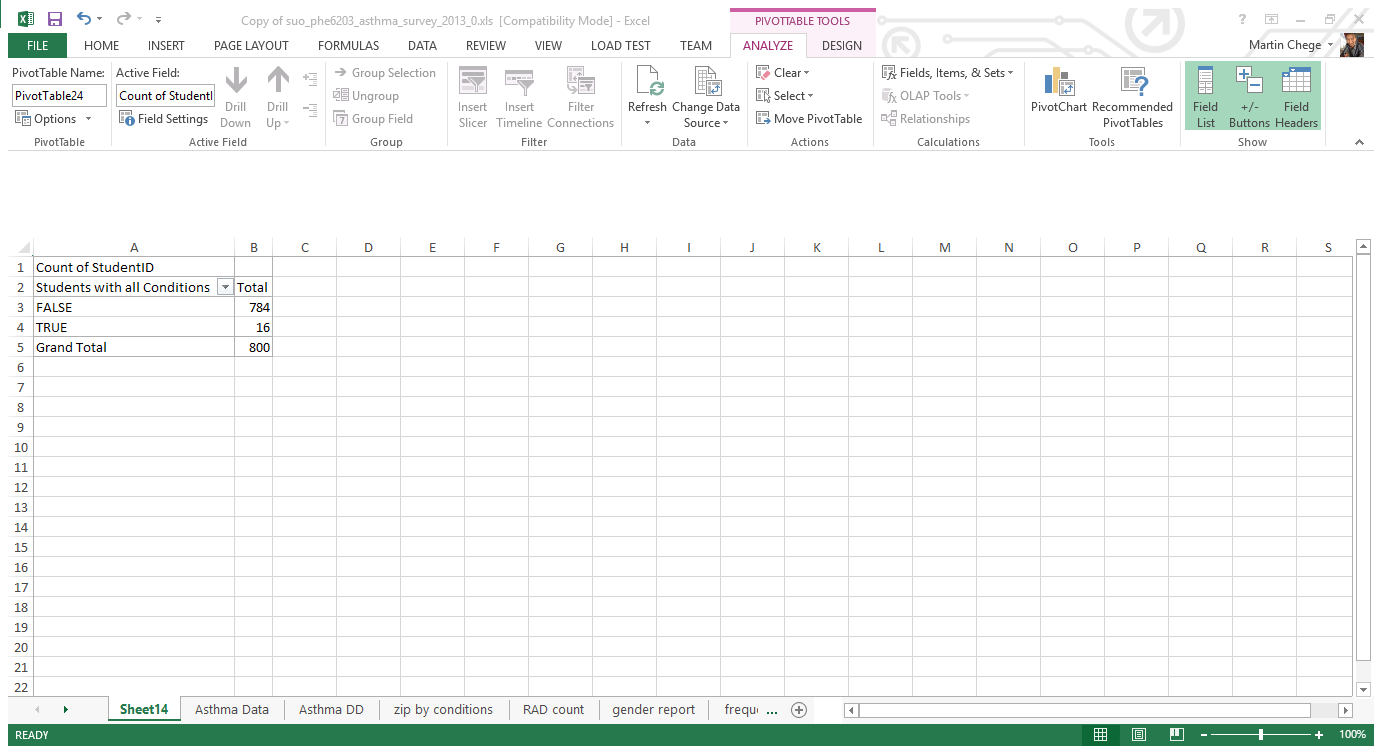
How many students answered yes to all four conditions: asthma, RAD, bronchitis, and wheezing?
16 students answered yes to all four conditions.
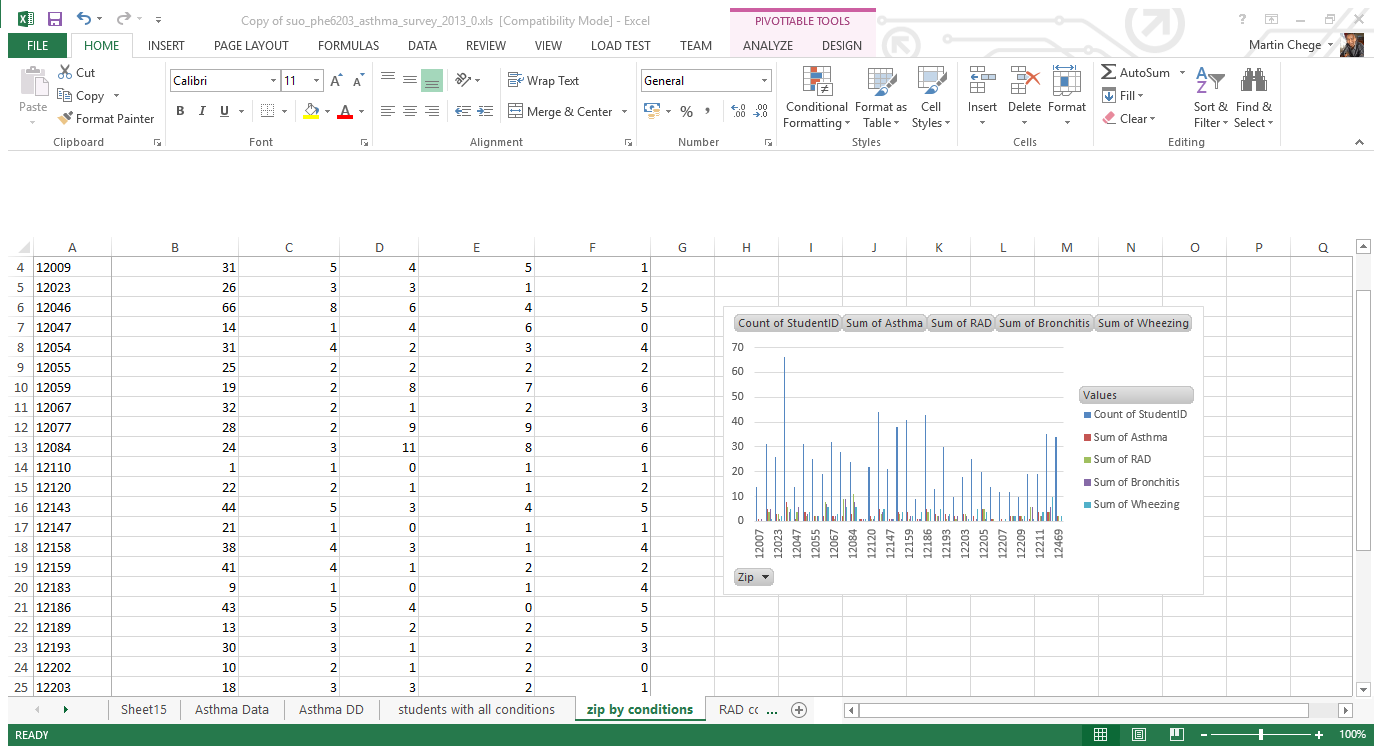
Based on all four conditions and zip code, are the conditions evenly distributed among the survey population?
The conditions are not evenly distributed among the survey population as some areas have more cases of a particular condition than others. In some cases, some zip codes don’t have any cases of a particular condition. Therefore, the conditions are not evenly distributed across the survey population. The following report proves my hypothesis.
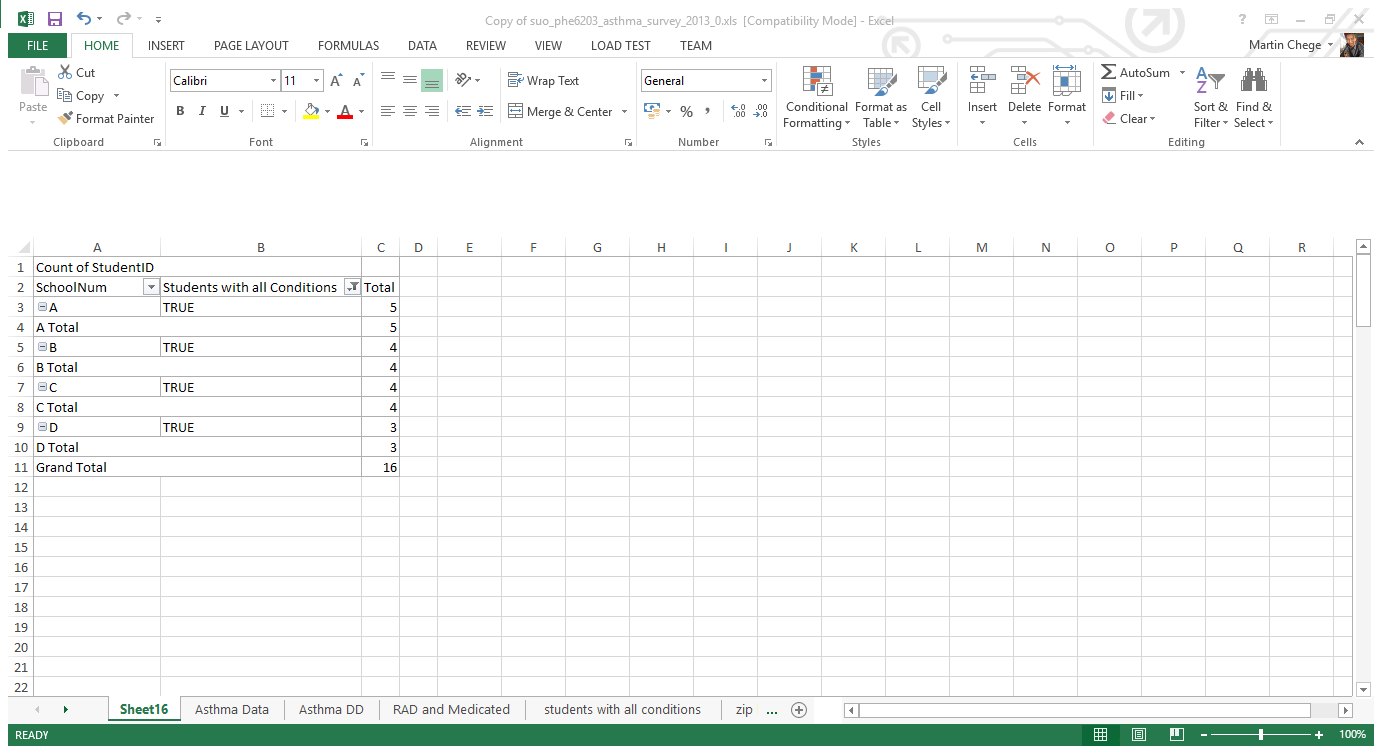
Does one school have more students in the affected zip codes and with all four conditions than the others do?
Yes. School A has registered five cases of students having all the four conditions while B and C record 4 cases. School D has only 3 cases. The following table shows how the cases are distributed.
Conclusion
To ensure that the data was accurate, I first checked the dataset to try and identify any inconsistencies and incompleteness (Alexander & Walkenbach, 2013). Some fields such as number of days missed in the last month of school had some blanks as some students can have a 100% attendance record. The use of binary values (1 and 0) have aided in calculating frequencies as the sum of 1s can be used as a count and was useful in the analysis. However, the lack of some attributes hindered the extraction of reports (such as finding the month with the most absenteeism).
References
Han, J., Pei, J., & Kamber, M. (2011). Data mining: concepts and techniques. Elsevier.
Alexander, M., & Walkenbach, J. (2013). Excel Dashboards and Reports. John Wiley & Sons.


