econ project.
MACRO ECONOMICS LECTURE NOTES
(ITEMS IN RED ARE NOT IN THE TEXTBOOK)
Chapter 1 IntroductionWhen managing the economy, there are 3 core issues:
What is to be produced with our limited resources
How
For whom
The problem is there is a limit to and hence there is scarcity of resources to produce goods and services.
The resources used for production are called the factors of production and they are
Land
Labor
Capital
Entrepreneurship
As a result of scarcity, to say yes to one thing often means saying no to another. This is called opportunity costs.
The Production Possibilities Curve shows production possibilities, which is the combination of things you will likely produce at a given time with the resources you have.
Adam Smith wrote The Wealth of Nations in 1776, which discussed The Invisible Hand which he feels answers the question of what, how, and for whom things are produced.
“It is not from the benevolence of the butcher, the brewer, or the baker that we expect our dinner, but from their regard to their own interest. We address ourselves, not to their humanity but to their self-love.”
...every individual necessarily labors to render the annual revenue of the society as great as he can. He generally, indeed, neither intends to promote the public interest, nor knows how much he is promoting it. By preferring the support of domestic to that of foreign industry, he intends only his own security; and by directing that industry in such a manner as its produce may be of the greatest value, he intends only his own gain, and he is in this, as in many other cases, led by an invisible hand to promote an end which was no part of his intention. Nor is it always the worse for the society that it was no part of it. By pursuing his own interest he frequently promotes that of the society more effectually than when he really intends to promote it. I have never known much good done by those who affected to trade for the public good.
The theory is now called the market mechanism. If consumers demand more trucks, more will be produced and less of tanks, and thus workers who built tanks will then shift to other jobs, changing the mix of output.
What will be produced? Trucks
How? With use of those who are skilled at making trucks and are willing to produce them for the prices consumers are willing to pay
For whom? For those willing to pay a price for them that generates adequate profits for the producers.
Notice, therefore the essential market mechanism; the price signal.
Adam Smith, therefore was inspired to promote a Laissez Faire mentality; keep government out of the economy as it can run itself.
What kind of an economy do we have?
Central (or Planned) or Free Market (Capitalist)
The Communists believe that as soon as the working class and its allies are in a position to do so they must make a basic change in the character of the state; they must replace capitalist dictatorship over the working class with workers’ dictatorship over the capitalist class as the first step in the process by which the existence of capitalists as a class (but not as individuals) is ended and a classless society is eventually ushered in. Socialism cannot be built merely by taking over and using the old capitalist machinery of government; the workers must destroy the old and set up their own new state apparatus. The workers’ state must give the old ruling class no opportunity to organize a counter-revolution; it must use its armed strength to crush capitalist resistance when it arises.
The Socialists, on the other hand, believe that it is NOT possible to make the transition from capitalism to socialism without a basic change in the character of the state. They hold this view because they do not think of the capitalist state as essentially an institution for the dictatorship of the capitalist class, but rather as a perfectly good piece of machinery which can be used in the interest of whichever class gets command of it. No need, then, for the working class in power to smash the old capitalist state apparatus and set up its own—the march to socialism can be made step by step within the framework of the democratic forms of the capitalist
Socialism and communism are alike in that both are systems of production for use based on public ownership of the means of production and centralized planning. Socialism grows directly out of capitalism; it is the first form of the new society. Communism is a further development or "higher stage" of socialism.
The United States is in a Mixed Economy due to Market Failure, in that the free market cannot satisfy all needs.
Government Failure exists too however, as they have failed to satisfy needs in spite of their intervention.
Our focus in this course is to discuss the means to the end of achieving the goal of maximizing the use of resources while creating full employment without unreasonable inflation (or WITH price stability) and with a reasonable even distribution of wealth.
If people only buy food, shelter (by renting), and clothing, it would not be enough to make sure that there would be full employment. An economy MUST also have sales of other items such as homes, cars, appliances, and clothing.
It is not desired to have zero inflation. To do so would discourage growth.
Macro Economics is the study of reaching goals of the economy.
Micro Economics is the study of reaching goals of isolated pockets within the economy, such as given industries and businesses.
Theory Vs. RealityTheory Assumes Ceteris Paribus (Nothing else changes)
Reality, through politics, and imperfect knowledge hints at the flaws of theory
Legislative Lag exists; It takes time to pass legislation to regulate the economy and it takes time for passed legislation to have an effect on the economy.
Economic Theory is like medication; None of them are necessarily right or wrong; you simply have to apply the right theory to the right ailment (of the economy) be it to stop recession, depression, or unreasonable inflation etc.
Chapter 2The What, How and For Whom In The U.S.
What We Produce:Real GDP VS. Nominal GDP
Gross Domestic Product (GDP) formerly known as Gross National Product (GNP) is the total market value of all final goods and services produced within a nation’s borders in a given time.
Gross National Product counted finished goods and services purchased regardless of where it was produced.
Final goods are not component parts, otherwise there would be double counting.
Intermediate goods are not counted.
GDP = Consumption (Purchase of Consumer Goods) + Investment (By business) + Government Expenditures For Services (Not Transfer Payments such as Social Security, Welfare and Unemployment Benefits) + Net Exports
Per Capita GDP is GDP for each man woman in child in the country, but it is not an indicator of the actual distribution. It compares GDP to a nation’s size.
The text indicates how different countries stand with GDP. Notice the difference in the standing with China in GDP vs. Per Capital GDP
Net Exports usually are higher for countries who have firms with comparative advantage; the ability for a country to produce a product at a lower opportunity cost, such as Oil in Saudi Arabia.
People in those nations use the revenue from such goods to buy things that they can’t produce as cheaply from other nations.
GDP Growth is what is used to determine the state of the economy.
Recession exists if there is a series of drops in GDP (two or more consecutive quarters).
Growth Recession exists when growth of real GDP exists, but not fast enough to generate more jobs (usually at a rate below the long-term trend of 3%)
Recovery exists if there is a series of growth in GDP.
HOW:
Your nation’s ability to have comparative advantage can stem from your productivity; Output per unit of input (such as output per labor hour).
Another look at Land, Labor, Capital and Entrepreneurship
The U.S. and other developed nations (such as Canada, Japan, and the European Community) have higher productivity with labor because they have organizations that are Capital Intensive, through the use of Capital
Human capital is the level of skills and knowledge your workforce has. We have an advantage here as well. Cheaper help is not always better help.
We have Factor Mobility; the ability for our workforce to shift to another firm when their existing employers have slower or negative growth.
We have more technological advantage (which is not always machinery related)
Government’s role
Providing of the legal framework
Protecting the environment
Protecting consumers
Protecting labor
Providing Services
For Whom:
Everybody who will buy.
Chapter 3 Supply and DemandThe Circular Flow:
Demand: The ability and willingness to buy given quantities of a good at a given price (Ceteris Paribus)
Price (Moves you along the curve)
Determinants of overall Demand and shifts:
Tastes
Income
Other Goods (Substitute and Complimentary)
More/Less Government Spending
More/Less Money Injected Into the Money Supply
Expectations
Number of Buyers
Aggregate Demand is the demand curve for the entire economy.
Elasticity affects demand.
Supply: The ability and willingness to sell or produce given quantities of a good at a given price (Ceteris Paribus)
Price Changes Quantity Supplied
Determinants of overall Supply and shifts:
- Price (Moves you along the curve)
- Technology
Factor Costs
Taxes
Regulation
Skills/Knowledge
Subsidies
Expectations
Infrastructure
Number of Sellers
Equilibrium: The clearing price. Quantity Demanded = Quantity Supplied
Price Changes Quantity Demanded
Surplus (Full warehouses) Thus lower prices.
Shortage (Empty warehouses) Thus higher prices.
How does government try to remedy shortages:
Rent control (Price ceilings) cause shortages and further aggravate the problem.
How does government remedy problem industries (food and trucking)
They used a price floor is creates surplus and once again aggravates the problem.
Chapter 4
Public Goods vs. Private Goods
Public Goods have Free Riders
Externalities are costs or benefits that are experienced by a third party and government tries to eliminate them.
Market Power
Sherman Act 1890-Outlawed buying up of competition or conspiring in any way to eliminate competition
Clayton Act 1914-Outlawed Price Discrimination and Tie-In Agreements and Exclusive Dealing
Robinson Patman 1936-Outlawed Price Discrimination which is a cause of Predator Pricing.
Equity
The reasons that taxing the rich (or the “Haves”) to give to the “Have Nots” has failed is that:
Taxation of the rich who are employers gave them no incentive to increase employment and gave incentives to reduce employment created more poor, not less.
The taxes received actually decreased, creating a burden on government as they had more to assist and few tax dollars with which to do so.
Government failure exists with its failure to improve economic outcomes.
If Government does not maximize use of resources there is waste, inefficiency, and opportunity costs.
Everything government does involves opportunity costs, thus a cost-benefit analysis is always needed.
It is difficult to do so, because they don’t always have a “Market Value” or a “Trigger” to know if they’re effective.
Transfer Payments are used to help create equity or minimize inequity.
Merit Goods are those the government feels everyone is entitled to at least at some minimum level such as food, shelter, and medical attention.
Government intervention has increased significantly since the Roosevelt administration, but until then it was seen as only needed for defense, the legal environment, and postal service. FDR, wanted the Federal Government to add to its roles, the task of stabilizing the economy, by Direct Expenditures (Purchases of Goods and Services) and Income transfers (or transfer payments).
One cost of Government spending is measured by the private-sector output sacrificed when the government employs scarce factors of production. Taxes transfer command over resources.
Income Taxes (Using a progressive tax system where rates increase as income increases) (See Spreadsheet)
Social Security (6.2% plus matching by the employer) + Medicare 1.65% plus matching by the employer) up to about $90,000, thus it is Regressive (where tax rates fall as income rises)
Corporate Taxes (See Spreadsheet) Ordinary income, capital gain, investment income.
Excise Taxes (such as gas tax, whiskey tax, cigarette tax often called the sintax)
State and local (Sales tax, property tax, income tax)
(None of these are flat tax a.k.a proportional tax that keeps the same rate for each dollar.)
Higher Taxes DO NOT always bring the government more revenue.
Lower Taxes DO NOT always bring the government less revenue (See the Arthur Laffer Curve).
Ballot Box Economics involves asking the public if they want a specific action.
Public-Choice Theory suggests that politicians make “self-interest” decisions (for recognition, power etc.), however the war on poverty era suggest that the theory isn’t always correct.
The Lorenz Curve shows how wealth distribution is not equal.
The Gini Coefficient- The area of the Lorenz Curve (Created By Max O. Lorenz 1880-1962 in 1905) divided by the right triangle in which it rests; the bigger the Gini coefficient (Created in 1912 by statistician Corrado Gini 1884-1965), the less equity we have with wealth.
The curve has scarcely moved since the creation of the “Great Society”.
Here is a list of recent Gini Indexes for a select group of other nations:
| Japan | 24.9 |
| United Kingdom | 36.0 |
| Sweden | 25.0 | Iran | 43.0 | |
| Germany | 28.3 | United States | 46.6 | |
| France | 32.7 | Argentina | 52.2 | |
| Pakistan | 33.0 | Mexico | 54.6 | |
| Canada | 33.1 | South Africa | 57.8 | |
| Switzerland | 33.1 | Namibia | 70.7 |
The Gini Coefficient for the United States has risen steadily since 1967. If the current trend continues, the United States will reach a Gini Coefficient of 0.546 in about 37-years, or 2043.
Gini indices for the United States at various times, according to the US Census Bureau:[4][5]
1929: 45.0 (estimated)
1947: 37.6 (estimated)
1967: 39.7 (first year reported)
1968: 38.6 (lowest index reported)
1970: 39.4
1980: 40.3
1990: 42.8
2000: 46.2 [6]
2005: 46.9
2006: 47.0 (highest index reported)
2007: 46.3
2008: 46.69
Chapter 5
Revisiting GDP
GDP=C+I+G+XN
Measurement Problems include Non market Activities such as services for which there is no charge or for which there is a charge, but is not reported.
No counting of intermediate goods or with items that have “added value”.
Real GDP vs NominalInflation is the increase in the average level of prices of goods and services. Some prices go up while others don’t or others do not rise at the same rate.
To compute Real GDP (See Spreadsheet)
Chain-weighted indexes use a moving average of price levels in consecutive years as an inflation adjustment, because there is a flaw in the computation of Real GDP-Sometimes prices drop, such as in the technology fields.
If we use higher prices of a few years ago to compute real GDP growth, we exaggerate their output.
If we use to today’s lower prices for them, we underestimate the output of those things in the past.
Net Domestic Product=GDP-Depreciation. It’s the amount of output we could consume without reducing our stock of capital equipment and therefore without reducing our production possibilities.
The distinction between GDP and NDP is shown by the difference between Gross Investment and Net Investment.
Net Investment is positive as long as the dollar value of new plants and equipment (Gross Investment) exceeds depreciation.
Depreciation is a cost incurred by loss of value in capital products.
The Uses of Output are the four major elements of GDP: C+G+I+XN
Another approach to looking at GDP is to look at who’s being paid to produce it, rather than who’s buying it. In other words:
One side of computing it adds up expenditures (the demand side) while the other adds up the income (the supply side).
The total value of market incomes must equal the total value of final output; one person’s expenditure represents another’s income.
See Table in the text.
What makes the equation out of balance?
A major diversion of sales revenues occurs as a result of depreciation charges made by businesses
Our capital resources are used up in the process of production in wear and tear and obsolescence.
Thus they consider some of the sales revenue to be compensation for that and they will subtract depreciation from gross revenues while calculating their income.
Net foreign factor income is diverted out of the country as some income is generated in U.S. Markets that belong to people in foreign countries (sending an outflow of money out of the country).
U.S. citizens also own factors of production in other countries (sending inflows back in to U.S.)
Indirect Business Taxes (Sales Tax) must also be deducted from national income for it to be correct as this money disappears before any factor of production gets a chance to claim it.
Thus…National Income = Total income received by current Factors of Production:
Less indirect taxes, corporate taxes, retained earnings, Social Security taxes, foreign factors.
Plus transfer payments, net interest, income from outside the U.S. from U.S. Owned factors
Many corporate profits are either kept in retained earnings and not given as dividends or income is taxed at the corporate level
Personal Income - Income of households before taxes.
Disposable Income – After-tax income of households-It is either spent or saved.
Discretionary Income- What households can spend at their discretion (Disposable-Prepurchased commitments)
Saving-Disposable income not spent in consumption.
Chapter 6Measuring of Unemployment
If you aren’t working, you are still not considered unemployed if
You’re under 16 years old.
You’re not actively seeking work.
You’re out of work because of vacation, sickness, labor dispute, and/ or bad weather.
You’re an unpaid family worker in family business (such as farms).
You’re military
You’re institutionalized.
If you are any one of the above, even though you are not working, you are not considered a member of the American Workforce. (See latest month’s stats at http://www.bls.gov/)
Growth of Production Possibilities relies on the availability of factors of production and our technological know-how.
(Arthur) Okun’s Law: Each additional 1% of unemployment reduces real output by 3% (and in recent times between 1% and 2%). This in part is due to the chain reaction of less work performed, and less consumed, thus less sold.
The unemployment rate is calculated by first interviewing over 65,000 households nationwide, finding the number unemployed and dividing by the labor force.
Most unemployed (more than ¾) find work within six months.
Flaws in the system:
It relies on truthfulness of the respondent.
It doesn’t factor in discouraged workers.
It doesn’t factor in underemployment.
It doesn’t factor in those who say they are looking for jobs who are not making a true effort, thus they are counted as unemployed when they shouldn’t be.
The Phantom Unemployed, report that they are seeking work when they’re not (often riding out unemployment benefits) often fearing that if it is known that they are not looking for work that there will be consequences.
Types of Unemployment
Seasonal-Due to high supply of workers during summer and holidays
Frictional-Brief periods as people move from one job to the next.
Structural- Obsolete skills of workers or lack of jobs in areas where some unemployed live.
Cyclical- Due to the decline or slow growth in aggregate demand.
The Real Unemployment Rate is often nearly double the rate posted by federal government after factoring in the underemployed and the discouraged workers (In April of 2009 when unemployment hit 8.5%, the Real Unemployment Rate was calculated at 15.6%.)
Rising Prices are often a signal of nearing full capacity and full employment. They seemed to feel that prices rose at 4%, thus they felt that full employment is 4%. The 4% is likely those unemployable (or structurally or frictionally unemployed).
This was criticized as the late 70’s and early 80’ saw rampant inflation and high unemployment (Also known as Stagflation).
The theories of the causes of increasing structural and frictional unemployment during this period:
More youth and women entered the workforce during that time, causing more frictional and structural unemployment.
Liberal transfer payments increased prolonged frictional unemployment.
Rapid change in demand and technology reduced jobs in unskilled positions and increased them in skilled positions
The relationship between full employment, inflation, interest, and stock prices
Chapter 7Inflation is the increase in the average level of prices of goods and services.
Based upon the market basket of goods, e.g. housing costs, food, health, transportation, clothing and more
Inflation is often an element of a shifting of wealth as it makes some poor, but others rich.
There has been deflation (the inverse of inflation) which existed last in the U.S. in 2009 and in 2016. Before that it was 1954-1955; before that it was 1949-1950, and 1939-1940.
Relative prices going up means that something costs more in comparison to others, such as the price of corn may go up compared to the price of other vegetables or other items.
Prices, therefore, of one item can go up without increasing average prices, as the price of other things may go down.
Just like our economy has nominal income and real income when talking about GDP (income adjusted for inflation), so too does a household (nominal personal income or real personal income).
Price effects of inflation: People end up with fewer goods as they cannot afford them.
Income effects of inflation: People whose nominal incomes go up at a pace that is slower than inflation, also end up with few goods and in a sense end up with lower income.
Wealth effects of inflation: People who own assets (such as stocks or bonds) that are going down in value when their rates of return are lower than inflation, lose the value in those assets and thus lose wealth.
Many suffer Money Illusions, thinking their income or wealth is increasing during times of inflation when it really doesn’t.
Inflation, like unemployment, causes
A great deal of social stress
Uncertainty
Hyperinflation is inflation in excess of 200% lasting one year or more.
Bracket Creep-Inflation can also cause a taxpayer to be cheated even more, if the inflation increases their income into a higher tax bracket, especially if their rate of income increases are less than the inflation rate.
Consumer Price Index-It also uses the Market Basket to see how prices have changed since a base period (1982-84), which is set at 100.
The basket of goods prices is surveyed each month by the Bureau of Labor Statistics to determine what they are now buying (See http://www.bls.gov/)
From here the prices of each are found by shopping in 85 cities for such goods and services (184), visiting approximately 19,000 stores, 60,000 renters, landlords, and homeowners.
In July of 2004, the CPI registered at 184, which means that in 2004 it cost you $184 for things for which you paid $100 in 1982-84 (or an average increase of 84% for each item since that time).
The effect of a specific price change on the inflation rate depends on the product’s relative importance to peoples’ budgets known as the item weight. In other words, if clothing is a very small percent of the average budget, they are expected to have little effect on the CPI.
The PPI and WPI (Producers’ Price Index and Wholesalers’ Price Index) are also tracked, as these increases do not always impact the CPI or to the same level and they usually increase before the CPI does, thus they are often used as predictors of the CPI
The GDP Deflator is a price index referring to all goods and services included in the GDP. It is used to adjust nominal output values for changing price levels.
It is not based upon the basket of goods, rather it allows the basket’s contents to change with people’s consumption and investment patterns.
It is not a pure measure of price changes, rather its value reflects both price changes and market responses to those changes, thus it registers lower than the CPI.
See Example in Spreadsheet.
Full employment is the lowest rate of unemployment consistent with stable prices.
Why is price stability a rate of 3% inflation or less?
Declining inflation, often spells increased unemployment, without the incentive to produce or supply more goods.
Products are improving and we should expect to pay more for higher quality goods, and the CPI does not adjust for quality improvements.
New products have been added since the base years of the CPI.
Demand pull inflation: When demand exceeds supply, causing shortages. It is the result of too much money chasing too few goods.
Cost-push inflation: When factor costs or the costs of goods sold increase for vendors, they must raise their prices to keep a given level of profits.
COLA’s (Cost of Living Allowances)
ARM’s (Adjustable Rate Mortgages) Allow creditors to get more interest when inflation increases, since future interest doesn’t keep up with inflation when it is fixed.
The way for Government to reach their goals in managing the economy is by understanding Macroeconomics, which helps us to know how stable the economy is, what causes the instabilities, and what can be done about it if anything.
Before the great depression of the 1930’s, bad economies were called “panics”.
Aside from those mild downturns in the economy, it was believed a depression could never happen and that no need for government intervention was necessary, embracing the Laissez-Faire philosophy.
In FDR’s first term, unemployment was still increasing and he took measures to stop it. Before his reelection, the economy managed to turn around and lower unemployment, but not to the level it was when he took office, thus he was falsely accused by conservatives that he should not have intervened and that he did not create one job.
In the first term of George W. Bush, unemployment was still increasing and he took measures to stop it. Before his reelection, the economy managed to turn around and lower unemployment, but not to the level it was when he took office, thus he was falsely accused by liberals that he should have intervened more and that he did not create one job.
That is why we often see that both sides may talk inaccurately of the economy. They instead will promote their main agenda which is to criticize the other side for political gain and not necessarily properly inform the public of economic status.
Classical Theory-It embraces the “Hands Off” mentality of government intervention with the economy in that they believe that it self-regulates (as did Adam Smith)
It embraces the proverb developed by French economist Jean Baptiste Say (1767-1832) known as Say’s Law: Supply creates its own demand.
The logic of the law implies that if all markets except one are balanced, then the last one also must balance. This conclusion from Say’s Law was named after Leon Walras and has become known as Walras' Law.
Classical Theorists believe that when FDR spent money to stimulate the economy that it cost jobs as it required tax dollars, lower the amount of money in the economy for consumption and investment by business.
Keynesians argued that the government didn’t have to tax to get the money, thus no jobs were lost.
President Herbert Hoover, who thus did little to intervene with government action during the depression, which began during his presidency, embraced the theory. He asked people to be patient and that the economy would soon turn around on its own. Many Classical economists believe to this day that the depression would have been solved, but that FDR’s programs slowed down the process (all of which is still subject to debate)
Theory (Demand-Side Economics)-Economist John Maynard Keynes (1883-1946), who wrote The General Theory of Employment, Interest and Money, embraced the idea that a market-driven economy is inherently unstable and needs government intervention.
The Keynesian Theory actually began to be applied by Herbert Hoover in the later years of his presidency and criticized by FDR in the election of 1932, but then FDR embraced it.
Classical view: The economy will turn around in the long-run and to let it self-correct is better for the economy in the long-run.
Keynesian View: People don’t eat in the long run.
The main factors contributing to the severity of the Great Depression were:
The over-stimulated economic euphoria of the 1920s causing more people to buy with credit and to buy stocks that were not worth what people were paying for them.
Common people investing in stocks with no experience and their inclination to do so after having purchased many war bonds from WWI.
The stock market crash
Killed consumer confidence
It wiped out the wealth (Margin call)
The draconian (harsh) monetary policy pursued by the Federal Reserve Bank from 1930-1933.
The sudden rise of global protectionism leading to the collapse of world trade.
The dramatic rise of income taxes in 1932 may have also prolonged the downturn.
Wealth distribution inequities that led to the over use of credit
Less spending when the stock market crashed.
A sharp reduction in the money supply by banks due to inadequate bail out procedures for banks and no depositors’ insurance.
There were many other factors which made the human experience much worse than it had to be such as the lack of adequate social safety nets like Unemployment Insurance, Social Security, Medicare, and Welfare programs. These programs were mostly implemented in response to the Great Depression and have well served the function of automatic economic stabilizers since. It is morbidly amusing to witness policy debate over such programs by politicians these days who have forgotten the depression. When times are good, those in need are seen as anomalous social groups and social programs become ill funded and pejorative. Perhaps it takes a Great Depression once in a while to remind us that we are all cut from the same cloth. It is just a matter of time.
Economy Determinants
Internal market forces (such as population growth, spending behavior etc.)
External Shock (war, disaster, terrorism, trade disruptions)
Policy Levers (government policies that are implemented or restrained).
Fiscal Policy
Taxes-Raise Taxes to lower the money supply (how much money is available for purchases in the economy) or Lower taxes to increase the money supply.
Spending-Raise the G of the GDP to stimulate the economy or they can reduce the G to slow down the economy.
Monetary Policy
Regulate the money supply by raising interest rates (Overnight or federal funds, prime lending rate) would lower the money supply, while a lowering of interest rates increases the money supply.
Minimum Reserve Requirement
Relax credit standards to increase the money supply or become more stringent in the credit standards to lower the money supply.
The Federal Reserve can print money if needing more money supply or print less if they want to lower the money supply.
Bonds
Bond sales-Give money (by a loan) to the government by the public or its citizens thus tying up the money of those citizens and contracting (or lowering) the money supply.
Bond purchases-Give money (by a loan) to the people, thus increasing the money supply
Aggregate Demand is the total quantity of output (real GDP) demanded at various price levels at a given time (all things held equal)
The Aggregate Demand Curve shows this Aggregate Demand and it is downward sloping because of
The real-balances effect
Cheaper prices make dollars more valuable and creating a better climate for the demand of goods and services and the reverse is also true.
The value of the dollar is measured by how many goods and services each dollar buys. Lower prices make your money in your pocket or your bank worth more and the opposite is true.
The foreign-trade effect
The impact on imports and exports is that if the average price of U.S. goods rises, imports are more desirable and the reverse of this is also true.
The interest-rate effect
Price increases make more need to borrow, thus driving up interest rates and the reverse is also true.
Price increases make interest rates rise because the inflation rate must be added to the desired rate of return.
The Fed will likely raise interest rates when they see inflation here or imminent.
Aggregate Supply is the total quantity of output (real GDP) producers are willing and able to supply at various price levels, all things held equal.
The Aggregate Supply Curve shows this and is upward sloping because
The profit effect
Producers can make more profit with higher prices and the reverse is also true.
The cost effect
If prices of goods and service go up, the cost of producing those goods must not go up with them at the same or greater rate, or the motivation to produce more will vanish.
The Aggregate Supply Curve is flat at low levels of output and then gets steeper. This is because cost pressures are minimal at low outputs, because the factors of production have less demand if producers aren’t using them, thus prices need rise only a little to encourage more output. As output of those goods increases, so does the demand for the factors used to produce them and their costs go up, requiring a producer to charge even more to make a profit, thus the Aggregate Supply Curve gets much steeper.
Macro Equilibrium exists when producers and suppliers have an equal exchange of exactly the same quantity.
Two potential problems with Macro Equilibrium
Undesirability – The price-output relationship doesn’t always mean we have full employment with price stability and even distribution of wealth.
Instability – Even if the equilibrium DOES create full employment, it could still be displaced by disturbances such as a change in consumer behavior, a rise in oil prices (which raises costs of doing business), shocks, and poor government policy. Also, both curves have been known to move rapidly and in different directions.
Demand-Side Theories
Keynesian theory suggested
that more demand was needed, thus government should spend more
should lower taxes to give consumers and business (investors) more money to spend
Increase the money supply
Monetary (Monetarist) theory suggested
You should increase the money supply through interest rates and credit standards to increase demand only on a limited, predicted pace or level.
MV=PQ
Both of these theories concede that increased demand can result in increased inflation.
Supply-Side Theories
These contend that a shift to the left of supply shows downturns in people’s willingness to supply, causes unemployment AND inflation, but that a shift to the right of the supply curve will lower unemployment and inflation.
Originally tagged nationally as Reaganomics.
To shift AS curve to the right, you decrease taxes and engage in deregulation, and eliminate discrimination, or overall eliminating bottlenecks to supply (as in the Welfare Reform Act of 1995).
A limit was put on the length of time a person could accept welfare benefits.
In 1995, the welfare reform act encouraged people to supply their services.
To supply services is not limited to finding a job, but also to working overtime etc.
The term "supply-side economics" was thought, for some time, to have been coined by journalist Jude Wanniski in 1975, but according to Robert D. Atkinson's Supply-Side Follies,[3] the term "supply side" ("supply-side fiscalists") was first used by Herbert Stein, a former economic adviser to President Nixon, in 1976, and only later that year was this term repeated by Jude Wanniski. Its use connotes the ideas of economists Robert Mundell and Arthur Laffer. Supply-side economics is likened by critics to "trickle-down economics."
Monetarist Theories
If you increase the money supply or demand too quickly, it will not likely increase output or employment as they feel it takes time to adapt to increases of money and demand and if producers can’t adapt quickly enough, they will only raise prices, hence, they feel that the AS is vertical, preaching that no action should be taken.
Some economists believe that study of short-run changes in the AD and AS are pointless, and rather it is more useful to study the long-run self-adjustment trends of the economy.
Basic Policy Strategies
Shift the AD curve to the right (Keynesian)
Shift the AS curve to the right (Supply-Side, once tagged as Reagonomics)
Do nothing-(Laissez Faire) (Classical, Monetarist-Predictable changes in M)
Full employment GDP is the ultimate goal to reach with the economy, which is the value of the total market output (or real GDP) produced at full employment
Eclecticism
Most presidents have used various opposing theories within their own administrations.
Economists believe that various views for various ailments/statuses of the economy should be applied.
Chapter 9
The 4 components of AD are the elements of GDP
Part One-Consumption
Income and Consumption historically have had close to a positive relationship, but there are some non-income determinants of demand.
Consumption independent of income or NOT driven by income is called Autonomous Consumption
Expectations of a pay raise a tax refund or a gift
Wealth is used for consumption even if income has stopped such as at retirement or when people have saved for given purchases (The Wealth Effect).
Credit
Taxes (going up reduces consumption, going down will increase it)
Price Levels
Transfer Payments
Other resources (such as friends, family members, or donors who give of their resources).
Keynes argued that price levels don’t have as much of an impact on AD as their income does. He feels that people will spend money if they have it, regardless of price levels.
All disposable income is either spent or saved, thus YD = C+S
How much is spent at various levels of income is measured by the Average Propensity To Consume (APC)
Found by dividing Total Consumption by Total Disposable Income or C/ YD
In 2001 it was $7,342 billion/$7,469 billion or 98%
As disposable income continues to rise, each additional dollar may be spent at a different rate and this is called the Marginal Propensity To Consume (MPC)
Found by dividing the change in consumption by the change in disposable income or ∆C/∆ YD
If YD Increases by $1 and you are inclined to spend 80 cents of that, then MPC = 80%
How much is saved at additional levels of income is measured by the Marginal Propensity To Save (MPS)
MPS = 1-MPC
The Consumption Function (See Chart)
It provides a precise basis for predicting how changes in income (YD) will affect consumer spending.
C=a+b(YD)
Each individual has one as does the overall consumer sector of the economy
The function may change
Autonomous consumption could change by going up or down and if it does, without a change in MPC, the curve will shift (up for an increase of autonomous consumption and down for a decrease)
The 45-degree line represents the level of consumption when it is equal exactly to income.
Dissaving represents the gap between the consumption function and the 45-degree line, where consumption exceeds income.
Saving represent the gap between the consumption function and the 45-degree line, where consumption is less than income.
The consumption function is useful in predicting consumer behavior, but its weakness is that people do change their behavior in both their autonomous consumption and their marginal propensity to consume.
Shifts in the consumption function are reflected in shifts of the aggregate demand curve.
Shifts of the AD curve takes place with a change in non-income determinants of consumer spending (Autonomous Consumption) change.
Downward shifts, represent leftward shifts of the AD curve.
Upward shifts represent rightward shifts of the AD curve.
Causes of shifts are changes in:
Consumer confidence (expectations)
Wealth
Credit conditions (money supply)
Tax policy
Part Two-Investment
Determinants of Investment are
Interest Rates (Moves investment along the curve)
Expectations (Expecting better times, shifts the curve upward and the reverse is true)
Technology and Innovation (With more innovation, firms cannot afford to be without the latest, as a matter of survival)
Investor expectations are unstable.
When Investment declines, the AD curve shifts to the left.
A drop in Investment can also reduce Consumption.
A drop in Consumption can reduce Investment.
These changes in Investment are often more than proportional than that of Consumption. In 2001, drops in Consumption were only 7%, while Investment dropped by 13.3%
Part Three-Government Spending
Not including income transfers, The G represents $3.0 trillion per year.
About 67% of that is from State and Local Governments,
Their spending is limited by tax receipts as they cannot engage in deficit spending as the federal government can.
Thus, when AD drops as a result of a drop in the C and the I, so too can G, thus aggravating, not helping the leftward shift of the AD curve.
Part Four – Net Exports
Foreign consumers and businesses (investors) behave in the same way that they do in this country, with the same determinants. In 1997, expectations were damaged and thus U.S. exports to those countries plummeted, thus shifting the AD curve left.
The good news about a lack of consumer confidence HERE exists when consumer confidence reduces imports, which can increase net exports.
It is conceivable to see an increase in AD in Net exports when our Consumption C drops, as long as Consumption by foreign consumers remains the same or increases if their determinants such as income and confidence etc. are better than ours.
Revisiting the Issues of Desired and Undesired Equilibrium.
Market participants make independent spending decisions, thus no one can expect that their total will add up exactly to the right amount of AD to have full employment and/or price stability (or acceptable inflation).
(Recall) Two potential problems with Macro Equilibrium:
Recessionary Gap-The price-output relationship doesn’t always mean we have full employment
Inflationary Gap-Even if the equilibrium DOES create full employment, it won’t last if prices are too high.
Desired if it is accompanied by full employment and no inflation (it is possible to have equilibrium with inflation)
Undesired when it does not give us full employment, which occurs when everyone’s spending doesn’t generate enough AD at current prices.
Undesired when it does not give us stable prices.
Macro Failure exists when AD is too little, too much, or too unstable. When one or more of these exist, the goal of full employment and price stability cannot be reached.
Can we self-adjust from Inflationary Gap or Recessionary Gap?
There are over 4,000 indicators that predict the future of the economy. The most widely used and reported is the Leading Economic Indicators – A barometer of future economic condition from three to six months.
Calculated and reported by the Conference Board (A non profit think tank of which any respected business leader can become a member).
It measures:
Average workweek (Manufacturing)
Initial unemployment claims
New orders for consumer goods
Delivery times (The longer it takes to deliver goods, the greater the ratio of demand and supply)
Plant and equipment orders
Building permits
Inventories (Firms build up inventories when they anticipate higher sales) Not to be confused with undesired inventory that is unsold after a given period of time.
Credit (The more that people are borrowing increases buying power)
Stock prices (S&P 500)
Real M2 (Or the money supply)
Material Prices (When producers step up production, they buy more raw materials, pushing prices higher)
As some of these increase they will indicate good times ahead, but that number may be adjusted downward if others increase, such as initial unemployment claims. Each is given its own weight as to how much of a good predictor they are of times ahead. Those weights may change as the predictor gains or loses it’s potential to be accurate.
The Conference Board Leading Economic Index® (LEI) for the U.S. increased 0.4 percent in January to 94.9 (2004 = 100), following a 0.5 percent increase in December and a 0.3 percent increase in November.
Said Ataman Ozyildirim, economist at The Conference Board: “This fourth consecutive gain in the LEI reflected fairly widespread strength among its components, pointing to somewhat more positive economic conditions in early 2012. The LEI’s increase in January was led not only by improving financial and credit indicators, but also rising average workweek in manufacturing. These both offset consumers’ outlook about the economy, which remained pessimistic, though slightly less so. Meanwhile, the CEI rose again in January as employment, income, and sales data all point to improving current economic conditions despite a lack of contribution from industrial production.”
Added Ken Goldstein, economist at The Conference Board: “Recent data reflect an economy that started the year on a positive note. The CEI shows some small signs of economic strengthening in the fourth quarter and continued to point in this direction in January. The LEI suggests these conditions will continue and could possibly even pick up this spring and
U.S. Composite Indexes: Components and Standardization Factors
Leading Index Factor
1 Average weekly hours, manufacturing 0.2552
2 Average weekly initial claims for unemployment insurance 0.0307
3 Manufacturers' new orders, consumer goods and materials 0.0773
4 Index of supplier deliveries – vendor performance 0.0668
5 Manufacturers' new orders, nondefense capital goods 0.0183
6 Building permits, new private housing units 0.0271
7 Stock prices, 500 common stocks 0.0391
8 Money supply, M2 0.3550
9 Interest rate spread, 10-year Treasury bonds less federal funds 0.1021
10 Index of consumer expectations 0.0284
Coincident Index
1 Employees on nonagricultural payrolls 0.5426
2 Personal income less transfer payments 0.1890
3 Industrial production 0.1493
4 Manufacturing and trade sales 0.1191
Lagging Index
1 Average duration of unemployment 0.0373
2 Inventories to sales ratio, manufacturing and trade 0.1239
3 Labor cost per unit of output, manufacturing 0.0615
4 Average prime rate 0.2822
5 Commercial and industrial loans 0.1112
6 Consumer installment credit to personal income ratio 0.1880
7 Consumer price index for services 0.1959
Chapter 10
Recall the Circular Flow (Not to be confused with the Money Multiplier Process)
Leakages
Savings
Imports
Taxes
Reinjections
Government Spending
Exports
Investment of saved dollars used to make loans and increase spending by consumers, government, and business.
Income Increases and Decreases create a Multiplier Effect
Multiplier = 1/(1-MPC)
If MPC = 75% a change in Income and Spending of $100 billion, eventual change is much larger (4 times $100 billion)
When the multiplier is factored in, you must not increase consumption by more than needed. If the multiplier is 4, you need to divide the needed added spending by the multiplier to get what is called The Desired Fiscal Stimulus.
Example: If needed spending increases = $400 billion and the multiplier is 4, The Desired Fiscal Stimulus = $400 billion/4=$100 billion
The Keynesian adjustment process that leads to the multiplier effect:
Producers cut output and employment when:
Output exceeds AD at current prices (When there is recessionary gap)
Leakages exceed injections
The loss of income causes a drop in consumer spending.
Declines in consumer spending leads to further cutbacks in investment, further declines in employment, and more lost income, and then even further reduction in consumption.
Adjustment to a Recessionary GDP Gap
Recall that Recessionary Gap = The difference between equilibrium real GDP and full employment GDP
Because of the Multiplier effect it would take longer to get back what is lost.
If you increase AD, by shifting it to the right (as mentioned earlier this term), both output and prices go up.
The short-term trade off between unemployment and inflation is the basis for the definition of full employment. Full employment is not zero unemployment but the rate of unemployment consistent with price stability (4 to 6 percent).
The ambiguity about which rate of unemployment might trigger inflation has convinced some analysts to abandon the inflation-based concept of full employment. They prefer to use the term Natural Unemployment that doesn’t depend on inflation trends. It contains structural and frictional unemployment only.
Natural Unemployment is the rate of unemployment that will prevail in the long run. In the short run, both the unemployment rate and the inflation rate may go up or down, but the economy will tend to gravitate toward the long-run Natural Unemployment.
The structural determinants of unemployment, (such as age and composition of the labor force) change over time. When natural forces change, the level of natural unemployment presumably changes as well.
During the 70’s for example, there were few teens, and the rate at which women entered the work force slowed down, thus lowering unemployment without a change in inflation.
The quantity of goods supplied or produced is primarily dependent upon production capacity, labor market efficiencies, and other “structural” forces. These structural forces establish a Natural Unemployment rate that is fairly immune to short-run intervention.
The AS curve tells us is that as we near full employment or the level of output at the limit of capacity, the risk of inflation is higher.
As mentioned above, the ambiguity about which rate of unemployment might trigger inflation has convinced some analysts to abandon the inflation-based concept of full employment, since high prices are likely to follow in the short run, thus neo-classical and monetarists feel that the AS curve is vertical in the long run.
MV=PQ
Milton Friedman (1912-2006) during the 1960s, promoted an alternative macroeconomic policy known as "monetarism". Friedman's challenges to what he later called "naive Keynesian" (as opposed to Neo-Keynesian) theory[4] began with his 1950s reinterpretation of the consumption function, and he became the main advocate opposing Keynesian government policies.[5] In the late 1960s, he described his own approach (along with all of mainstream economics) as using "Keynesian language and apparatus" yet rejecting its "initial" conclusions.[6] He theorized there existed a "natural" rate of unemployment and argued that governments could only increase employment above this rate, e.g., by increasing aggregate demand, only for as long as inflation was accelerating.[7] He argued that the Phillips curve was, in the long run, vertical at the "natural rate" and predicted what would come to be known as stagflation.[8] Though opposed to the existence of the Federal Reserve System, Friedman argued that, given that it does exist, a steady, small expansion of the money supply was the only wise policy.[9]
Friedman actively participated in public debates over numerous policy issues; he was a major advisor to Republican U.S. President Ronald Reagan[10] and Conservative British Prime Minister Margaret Thatcher.[11] His political philosophy extolled the virtues of a free market economic system with minimal intervention.
Monetarists contend that you must increase M at a predictable rate.
Thus they say that the long-run AS curve shows us that it is vertical and there is no reason for producers to depart from this “natural” level of output when AD increases. They are smart enough to know that both costs and prices will rise when spending increases. Thus, rising prices won’t create any new incentive to produce because the profit remains the same as long as costs go up at the same rate as prices.
If you increase AD by shifting the curve out, you will cause inflation unless you match that added demand with added supply. But added supply will not likely happen if costs to produce rise and thus, even with a price increase, no incentive to produce more exists.
Adjustment To An Inflationary GDP Gap
When we reach full employment, Investors often increase Investment, because they may
have high hopes of future sales
need better technology to keep up with demand (they become more capital intensive)
When this happens, the following process unfolds in this order:
The AD curves shifts out to the right
Available inventories shrink (inventory depletion is a sign of impending inflation)
Household incomes will get a boost due to more hiring (luring people out of retirement or other firms or out of the stay-at-home cycle) or extended hours.
The added household income creates induced consumption.
The multiplier effect will begin.
Prices will rise due to demand-pull inflation.
This rise in inflation creates an inflationary gap
Inflationary Gap =The difference between the level of real output at full employment and the level of output at the new equilibrium price level.
The Keynesian analysis of leakages, injections, and the multiplier, concludes that the economy is vulnerable to abrupt changes in spending behavior and won’t self-adjust to a desired macro equilibrium. As a result, we decrease GDP to react, often causing a more than proportional adjustment of increase to the point of inflation, thus causing booms and busts.
Core CPI
The core CPI, a special index published by the Bureau of Labor Statistics (BLS), excludes the volatile prices of food and energy. In excluding these components, BLS recognizes that prices that swing dramatically in response to unusual shifts in weather and other unforeseen events could skew assessments of underlying inflation trends. In August 1995, the Congressional Budget Office refined its analysis of inflation by adopting a separate definition of core inflation: it excluded used cars in addition to food and energy from the overall CPI. The motive was once again to minimize the potentially distorting effects of unusually volatile prices.
Chapter 11
Policy levers deal often by the use of Government Expenditures generated by Government Revenue.
Recall Government Purchases vs. Income Transfers.
Income transfers don’t become part of Aggregate Demand until the transfer recipients decide to spend that income.
To alter aggregate demand the government can use fiscal policy when there has been a change in internal market forces and external shocks:
Purchase more/less goods and services
Raise/lower taxes
Increase/decrease the level of income transfers
Recall the Keynesian approach to recessionary gap:
Get someone to spend more on goods and services, shifting the AD curve to the right, ending the recession by:
Increased government purchases
Tax decreases that induce increased consumption and investment.
The questions that you must then ask
How much of a shift to the right is the right amount?
Answer: If your aggregate demand is at $5.6 trillion and full employment aggregate demand needs to be $6 trillion, you must shift the AD curve to the tune of $400 billion.
How do you do it?
Problem: The AD curve, by this policy will only move to the desired point of full employment if the aggregate supply curve is flat, or only if prices don’t rise when the economy expands.
Please recall that this theory was developed by Keynes during the depression when in fact the AS curve was flat.
When AD shifts to the right, prices will not rise until it is shifted to the point that the AS curve is sloping upward. At that point, an increase in AD doesn’t translate dollar-for-dollar into increased real GDP, instead, when the AD curve shifts to the right, the economy moves up the aggregate supply curve (not horizontally or to the right) thus there is an output and price level change (See Chart on sheet marked Non $ for $ shift
As a result of all of this, it will appear that more fiscal stimulus is needed than $400 billion used in the example above.
Shifting AD by the amount of GDP gap, will only achieve full employment if the AS curve is flat or if prices don’t rise. This because, higher prices reduce Aggregate Demand.
The shortfall is called AD Shortfall.
If AD shortfall = $400 billion and MPC = .75
Desired Fiscal Stimulus = AD shortfall/The multiplier = $400/4 (since MPC of .75 gives a multiplier of 4) =$100 billion.
The effect of a tax cut:
If taxes are cut by $100 billion and the MPC = .75, Increased spending would be $100 billion x .75 = $75 billion.
If the MPC remains at .75, the multiplier would remain at 4 and thus it would increase Consumption by 4 x $75 billion = $300 billion.
Hence a tax cut contains less fiscal stimulus than an increase in government spending of the same size, because initial spending is less than the size of the tax cut.
If AD shortfall = $400 billion and MPC = .75
Thus Desired Tax Cut = Recessionary Gap/1/(1-MPC) = $400 billion/4 = $100 billion
100 billion/.75 = $133 billion
Desired Fiscal Stimulus/MPC = 100 billion/.75
Desired fiscal restraint = $400 billion/4
Fiscal Restraint
If excess AD = $400 billion and MPC = .75, the multiplier = 4
Desired Fiscal restraint = Excess AD/the multiplier. $400 billion/4 = $100 billion.
Desired Increase in taxes = Desired Fiscal Restraint/MPC = $100 billion/.75 = $133 billion.
Problems with the Levers:
Crowding out exists when government borrows all of the money leaving little for I or C to increase.
Legislative lag makes a delay before policies can have an impact and they are often too late.
Pork barrel projects often win out over needed spending cuts for fiscal restraint or when needed as a result of tax cuts.
Chapter 12
Deficit Spending is the use of funds by the government to finance their spending when it exceeds revenue.
The budget deficit is the amount by which government spending exceeds revenue in a given time. The opposite is a budget surplus.
The Keynesian view is not that deficits must be avoided, rather that you must balance the economy, not the budget. Keynes believed that the deficits and surpluses are bi-products of the countercyclical fiscal policy.
When showing restraint during good times, he sees tax revenues going up causing surpluses.
Good economy causes:
Higher income with higher tax base
Higher income with higher tax rates
Less need for income transfer payments
Require less stimulus spending
When stimulating the economy during bad times:
you have more transfer payments
tax revenues fall
spending going up causes deficits.
Keynes wouldn’t have been surprised at the change in significant deficits from 2001-2004. He would have considered the deficits as a routine byproduct of counter cyclical fiscal policy.
Deficits arise when more stimulus is needed and transfer payments are needed during bad times, just as fiscal restraint may cause a budget surplus.
Keynes believed that a balanced budget was only good if the economy was at full employment with stable prices and no leakages.
Many argue that the government can’t control spending that much anyway due to automatic spending.
Discretionary spending 20% is what the government may spend at their discretion.
This is the area more likely to be used for fiscal restraint and fiscal stimulus
Automatic spending (Uncontrollable) 80% is that which is the results of commitments made from prior years, prior congresses and/or prior presidential administrations. Examples include: Social security payments, veterans’ benefits, and interest.
1. Most of these items are automatic stabilizers that respond to cyclical changes in the economy.
a. Unemployment and welfare stabilize the economy when the people lose their jobs.
b. Taxes rise during good times at a higher rate for those with higher income
Higher taxes slow down the economy and reduce demand-pull inflation.
2. The automatic stabilizers imply that the government lacks control of the budget, but in reality, the size of the federal deficit or surplus is sensitive to the economy (be it in expansion or contraction).
When GDP decreases by 1%:
Government spending automatically increases by $2 billion for unemployment, welfare, Social Security and Medicaid. The reverse is true.
Government revenues automatically decline by $28 billion in the areas of individual and corporate income taxes and Social Security taxes, creating a deficit increase of $30 billion.
When Inflation increases by 1%
Government spending automatically increases by $35 billion in retirements, Social Security, and interest.
Government revenue increases by $42 billion automatically in Corporate taxes and Social Security taxes, shrinking the deficit by $7 billion. The reverse is true.
The cyclical deficit is the portion of the government budget balance that is attributed to short-run changes in these economic conditions.
Thus:
The cyclical deficit increases with GDP decreases or slowdowns or with lower inflation.
The cyclical deficit decreases with GDP increases or accelerations or with higher inflation.
The remaining changes in the deficit are the result of fiscal policy (changes in tax rates and spending patterns).
The structural deficit is the federal revenues at full employment minus expenditures at full employment as a result of the fiscal policy at that time.
A balance = what’s left after expenditures are subtracted from revenues.
A cyclical balance is the revenue changes minus the expenditure changes as a result of cyclical growth or slowdowns.
A structural balance is the revenue changes minus the expenditure changes resulting from changes in government spending.
The budget balance = the cyclical balance (from the business cycle) + the structural balance (from fiscal policy)
Measures of thrust of fiscal policy (in either its ability to create GDP growth or slowdowns) are measured in the structural budget balance.
Fiscal stimulus (or $ spent to stimulate the economy) is measured by the increase in the structural deficit (or the shrinkage of the structural surplus)
Fiscal restraint (or fewer $ spent to stimulate the economy) is measured by the decrease in the structural deficit (or increase in the structural surplus).
The economic effects of deficits
Crowding out-creating less borrowing by the private sector and thus less private sector output (notice the production possibilities curve with private vs public goods)
Opportunity costs-Is this shrinkage of output in the private sector worth the amount increased by government spending?
Higher interest rates-They often are symptoms or the result of crowding out, AND they can be a cause of crowding out if the added borrowing increases interest rates to the point that the private sector cannot afford to borrow.
The economic effects of surpluses (when government takes in more than it spends)
Crowding in-Surpluses add to the leakages in the circular flow. If it is too large to put in any one bank, thus they can
Spend it
This is not recommended as it would be a stimulus and crowding in happens usually at full employment.
Cut taxes
This is also not recommended as it would be a stimulus and crowding in happens usually at full employment.
Increase transfers
This is also not recommended as there would be no one in need of the transfer payments at full employment
Pay off old debt
This is best and what many feel they should do.
This benefits the economy when old debt is paid off.
The national debt is accumulated debt of the federal government and has existed since the end of the Revolutionary War (With exception to 1835).
See the text for the debt history.
Who Owns The Debt?
To the government the debt is a liability, but to those who lend to the government by purchasing the issued bonds, it is an asset. Understand the accounting equation: Liabilities = Assets
Thus, the national debt creates debt for the government, but wealth for the bondholders.
The largest bondholder of government bonds is…the government (holding nearly 50% of the national debt)!
Federal Agencies own 16% (Internal)
Social Security owns 17% (Internal)
Federal Reserve 7% (Internal)
State and Local Governments 5% (Internal)
Foreigners 31% (External Debt)
Banks, corporations, insurance companies, individuals 24% (External Debt)
Since banks and individuals own 24%, we say individuals hold the debt directly or indirectly.
Historically, the government has piled up debt without creating economic damage.
As debts become due, the government does not default, they just borrow more to pay off that which is due now (which is considered refinancing).
Many argue that as long as this process continues that the government can borrow eternally, as long as no one demands more of their money back than the government is able to borrow.
But what about interest and cost to our economy?
Interest costs (In 2005 the U.S. Treasury paid over $200 billion in interest)
It removes the government’s ability to balance the budget and fund needed programs.
The cost of the debt to our economy is only affected with opportunity costs when resources (factors of production) are used.
It can cause a problem if that government money is spent on interest, thus reducing the possibility for using it for economic growth, transfer payments, other government purchases, or debt repayment.
Debt may not cause crowding out, when external financing exists overseas.
It permits us to get more public-sector goods without cutting back on private sector production, thus we actually push out the production possibilities curve, thus expanding the economy.
Other nations lend us money for the debt since much of what we buy is comprised of imports.
The national debt cannot stop climbing as long as there is a deficit.
The Gramm-Rudman-Hollings Act of 1985 was passed in order to
a. lower the ceiling of each year’s deficits until a balanced budget was achieved
b. impose automatic cutbacks if Congress did not stay below the ceiling
Debt ceilings are also used to keep the debt under control, but those are often a joke as Congress and the White House usually ignores them or raises them.
Chapter 13
Money is
A medium of exchange (Accepted as payment for goods, services, and debts).
A standard of value (The yardstick of the value of a good or service)
A storer of value (For future purchases)
Replaced the bartering system
Paper money was not allowed by the Constitution until 1861. Then, “Greenbacks” as we have today were issued in order to finance the Civil War.
Examples of money are currency, checking accounts.
Credit cards are a medium of exchange but are not money in that cash or checking must be used to pay the balance on credit, but you are never in debt when you use currency or write a check.
Your checking account is considered money just as much as currency is, but some bank accounts are better substitutes for cash than others.
We need to know this because we need to understand or agree upon what is considered to be the money supply.
The narrowest definition of the money supply is called M1, which includes:
Currency now in circulation
Transaction Account Balances (which are those that are readily accessed by a check or debit card) or wherever direct payment is permitted to a 3rd party without a trip to the bank.
M2 (The most widely watched money supply measure) = M1 + Most savings, Time deposit of less than $100,000, and money market accounts. All short-term investments typically pay a lower return, because people demand more reward for taking risks.
Measuring these items of the money supply gives an understanding of consumers’ purchasing power.
The remaining liquid assets are not as likely to be used for purchases, and thus are not as much of a concern when deciding purchasing power of the consumer.
M3=M2 + Time deposits greater than $100 thousand, repurchase agreements (A repurchase agreement, also known as a repo, RP, or sale and repurchase agreement, is the sale of securities together with an agreement for the seller to buy back the securities at a later date. The repurchase price should be greater than the original sale price, the difference effectively representing interest, sometimes called the repo rate. The party that originally buys the securities effectively acts as a lender. The original seller is effectively acting as a borrower, using their security as collateral for a secured cash loan at a fixed rate of interest.) and overnight Eurodollars (Eurodollars are time deposits denominated in U.S. dollars at banks outside the United States, and thus are not under the jurisdiction of the Federal Reserve). They are used only on a very short-term basis.
L= M3 + All remaining liquid assets (such as T bills, U.S. Savings bonds, Banker’s acceptances (A banker's acceptance, or BA, is a promised future payment, or time draft, which is accepted and guaranteed by a bank and drawn on a deposit at the bank. The banker's acceptance specifies the amount of money, the date, and the person to which the payment is due. After acceptance, the draft becomes an unconditional liability of the bank. But the holder of the draft can sell (exchange) it for cash at a discount to a buyer who is willing to wait until the maturity date for the funds in the deposit.
A banker's acceptance starts as a time draft drawn on a bank deposit by a bank's customer to pay money at a future date, typically within six months, analogous to a post-dated check. Next, the bank accepts (guarantees) payment to the holder of the draft, analogous to a post-dated check drawn on a deposit with over-draft protection.
The party that holds the banker's acceptance may keep the acceptance until it matures, and thereby allow the bank to make the promised payment, or it may sell the acceptance at a discount today to any party willing to wait for the face value payment of the deposit on the maturity date. The rates at which they trade, calculated from the discount prices relative to their face values, are called banker's acceptance rates[1] or simply discount rates), Commercial Paper, Term Eurodollars).
Banks create money in the money supply, because:
when a bank loans money, it simply credits the borrower’s bank account
in making a loan, transaction account balances go up, and such balances are considered a part of the money supply.
| Step One | You deposit $1,000 to the only bank in the world. |
| Step Two | That money is loaned to a person to buy an appliance. |
| Step Three | The firm that sold the appliance deposits that $1,000 in their account and the bank now how $2,000 that can be loaned out. $2,000 now exists in that bank, from the original $1,000 deposit, thus money has been created. |

If the bank loans out all of the money, to someone else, that person would put the money in the bank and the bank would always be able to cover the checks UNLESS all would come for their money at once (Known as a Run On The Bank). They are often self-fulfilling prophecies.
Between 1930-1933, 9,000 banks failed.
The Federal Reserve makes it illegal for banks to loan out all money. A minimum must be kept in reserve (known as the minimum reserve requirement).
If the Fed requires a 20% required reserve ratio, the bank above would have to hold a $200 minimum reserve and they could only loan out $800.
A bank’s reserve ratio = equal to the bank reserves/total deposits.
Bank deposit-creation activities are regulated by government agencies; the most important of which is the Federal Reserve System or the “Fed”.
The Fed limits on how much of those deposits can be loaned out, thus controlling the money supply in that regard.
The money multiplier = 1/(Required Reserve Ratio)
Each bank may lend an amount equal to its excess reserves and no more.
The entire banking system can increase the volume of loans by the amount of excess reserves multiplied by the money multiplier.
(See Spreadsheet)
If Required Reserve Ratio = 20%, the multiplier = 1/20% =1/(1/5) = 5
If Required Reserve Ratio = 25%, the multiplier = 1/25% =1/(1/4) = 4
Obviously there is more than one bank in the world, but collectively these deposits wind up in the banking system as described.
The different types of financial institutions:
Commercial Banks (About 8,000) any financial services available. They hold nearly all demand deposits (transaction accounts) and half of all savings.
S&L’s (About 500) Originally used to pool resources of a neighborhood, offering only savings and home loans. In Ohio, most converted to banks in 1985 due to failure of Home State Federal and the State Insurance fund went bankrupt. Now they act much like the commercial banks and their services thus make it difficult to distinguish from them.
Mutual Savings Banks (About 1,000 located only in New York, Massachusetts, Connecticut, Pennsylvania, and New Jersey) Originally for small savers, but now using their deposits for more things such as investment bonds, and blue chip stocks.
Credit Unions (About 10,000, but less than 5% of total savings) Non-Profit. Formed by a common tie, such as a firm or labor union. Struggling due to competition from bigger banks.
Banks perform two essential functions for the macro economy:
They transfer money from savers to spenders by lending their reserves held on deposit, creating a reinjection into the economy, which counters the savings leakage.
They create additional money by making loans in excess of total reserves.
The Fed can thus control the economy by changing the minimum reserve requirements (although they seldom do).
Three Constraints on Deposit Creation:
Deposits-When the number of deposits decrease, the multiplier will reduce them exponentially. Few deposits are made when people prefer to hold cash.
Borrowers-Fewer borrowers mean less in a circular flow of money from bank to borrower, back to the bank.
Fewer borrowers will exist if interest rates are high or if the there is low consumer confidence.
The Fed (Regulating the minimum reserve requirement, interest rates, and lending standards)
The minimum reserve requirement has actually been used rarely, but NOT as a means of bank safety, but more for controlling the money supply.
Increasing the minimum reserve requirement can truly put the breaks on the economy.
Overnight or Federal Funds are used by banks to borrow overnight when their cash flows seem like they’re going to go below the minimum. The Fed can impact the Money Supply here too by changing the rate for borrowing such funds.
The FDIC (Federal Depositors Insurance Corporation) is a means for banks to guarantee depositors their money in the event of a bank failure. FSLIC (Federal Savings and Loan Insurance Corporation) is for Savings and Loans. This gives banks and S&L’s an opportunity to engage in riskier loans and getting greater profit.
Between 1970 and 1990 many banks and more than half of the S&L’s failed.
In 1988 200 banks failed and that was the worst since the depression of 1929.
These bank and S&L failures happened, because:
they were stuck, holding loans in which they charged 5% interest while having to pay 6% and more in interest to attract savers. S&L’s were particularly hurt since most of their loans were mortgages.
oil and real estate price decreases weakened borrowers’ ability to pay.
Chapter 14
The Fed
The Federal Reserve has several roles:
Clearing of checks (40 billion per year)
Federal Reserve Banks exist all over the country, thus a bank of a member bank in L.A. can clear a check from N.Y without having to wait for the check to travel across the country.
The Twelve Federal Reserve Districts
Addresses and phone numbers
Banks
Branches![econ project. 1]()
Boston
New York
Philadelphia
Cleveland
Richmond
Atlanta
Chicago
St. Louis
Minneapolis
Kansas City
Dallas
San Francisco
Board![econ project. 2]()
The Federal Reserve officially identifies Districts by number and Reserve Bank city.
In the 12th District, the Seattle Branch serves Alaska, and the San Francisco Bank serves Hawaii. The System serves commonwealths and territories as follows: the New York Bank serves the Commonwealth of Puerto Rico and the U.S. Virgin Islands; the San Francisco Bank serves American Samoa, Guam, and the Commonwealth of the Northern Mariana Islands. The Board of Governors revised the branch boundaries of the System in February 1996.
The routing number of any check will reference the Federal Reserve district in which the checks are cleared.
In Boston (District 1) a check drawn on a bank from district 12 used to take weeks to cash. That is now streamlined.
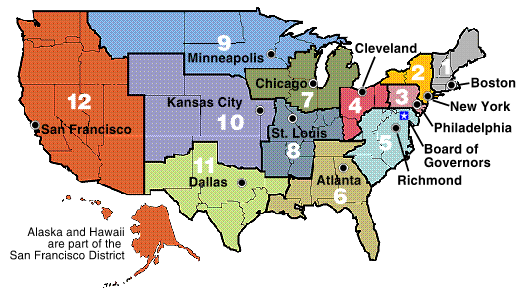
Find Routing Number on Your Check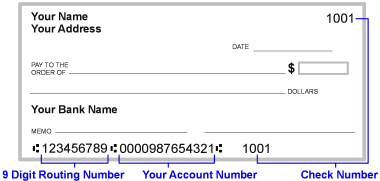
Holding bank reserves
Only small amounts of bank reserves are held in their vaults; the rest is held by the Fed (which allows the Fed to monitor actual reserve levels).
Providing currency
Banks seldom hold much cash, but they often need it for sporadic demand such as holidays and such cash can be provided by the Fed.
Such cash is delivered by armored truck and the amount of it is deducted from the reserves just mentioned.
When the depositors return the cash in deposits, excess cash is then sent back to the Fed.
Providing loans
It provides loans to private banks (called discounting).
Managing the money supply
The organization
The board of governors has seven members.
They are appointed by the President and confirmed by the Senate.
They each have 14 year terms to keep them independent of any given administration or political party.
They cannot be reappointed.
One of the governors is appointed/reappointed by the President to be the Chairperson and that Chairperson must report to Congress at least once every six months.
The current chair is Janet Yellen, the first woman to hold the position.[3] She began her term on February 1, 2014, and previously served as the Vice-Chair under Ben Bernanke from 2010 to 2014.
|
| August 6, 1979 – | ||||
|
| August 11, 1987 – | ||||
|
| February 1, 2006 – | ||||
|
| February 1, 2014[15] — | ||||
 Paul Volcker
 Alan Greenspan
 Ben Bernanke
 Janet Yellen
Alan Greenspan, was first appointed Federal Reserve chairman by President Ronald Reagan in August 1987, he was reappointed at successive four-year intervals until retiring on January 31, 2006 after the second-longest tenure in the position.
The Federal Open Market Committee (FOMC)
It is responsible for the Fed’s daily activity in financial markets, setting up short-term interest rates and the level of reserves held by private banks.
Membership of the FOMC includes all of the board of governors AND 5 of the 12 regional Reserve bank presidents.
They meet in Washington, D.C every month to review the economy’s performance.
It recommends changes in monetary policy to the Chairperson based upon the performance.
Monetary Tools used to control the Money Supply include:
Reserve Requirements: A higher ratio reduces excess funds, the ability to loan, and thus the multiplier. The opposite is true.
Discount Rates: Interest rates charged to banks that wish to borrow when they push the envelope and lend out until there are no excess funds. These loans are called Federal Funds (a.k.a. overnight funds)
Banks may also buy government bonds, but when they become reserve-poor, they can sell those securities and deposit the proceeds in a regional Federal Reserve Bank.
Each bank has an account, much like regular depositors and they can borrow from those accounts when reserve-poor.
By raising the discount rate, the amount of the Money Supply again decreases. The opposite is true.
Open Market Operations: It is by far the greatest impact on the economy compared to the other two and are the principal mechanism for directly altering the reserves of the banking system.
When people decide where to invest idle or excess funds, they make the portfolio decision.
The Fed’s Open Market Operations focuses on the portfolio decisions people make, whether to put them in bank accounts or government bonds. The Feds influence this by making bonds more or less attractive as the economy warrants.
The Fed’s goal is for people to move funds from banks to bonds (or the reverse) depending upon their current goal with the economy.
If people move money to banks, excess reserves increase and so does lending. The opposite is true.
If the fed buys bonds from the public (or lends more to the public), more money goes to banks. Bond sales by the Fed (or borrowing by the Fed) from the public reduces the money going to banks as they drain their savings to lend to the Fed.
The daily volume of the bond market exceeds $500 billion.
Bonds are IOUs, and can be sold and resold before maturity and they typically only pay interest (yield) until maturity.
The price of bonds go up as interest rates fall. The opposite is true.
The less you pay for a bond, the higher its yield (to maturity), thus the Fed can induce people to buy bonds by offering to sell them at a lower price such as $1,000 at 8% for $900. The opposite is true (See Bond Valuation Spreadsheet).
A principal objective of the Federal Reserve Open Market activity is to alter the price of bonds, and therewith their yields, making them a more or less attractive alternative to holding money. This is based upon the fact that participants in the bond market will respond to bond prices and yields.
Summary
If the fed wants people to increase the money supply and therefore desires to provide the banking system with additional reserves, it must persuade people to deposit larger amounts of their assets or portfolios into banks and hold less in the way of bonds.
If the Fed offers to pay a higher price for bonds (bidding up the prices of bonds already held by people in the market), the higher costs lead to lower yields; it will effectively lower bond yields and market interest rates, thus lowering the attractiveness of holding bonds, thus selling the bonds and put more money into savings.
The money given to the public for the bonds they (the public) sell is also put into savings.
The reverse of this process is also true, thus the Fed selling bonds reduces bank reserves.
To increase the money supply the Fed can
Lower reserve requirements
Reduce the discount rate
Increase the cost of bonds
Lower the yield rate
Buy bonds
The reverse is true.
If the Fed pumps more reserves into the banking system by buying bonds, the interest rate for borrowing overnight, federal funds declines as there would be less of demand for it. Thus the federal funds rate is a good indicator of the open market operations.
Chapter 15
There is a supply and demand curve for money, just like any other goods and services, with price being the interest rate.
The demand for money can be measured by the quantity of money people are willing and able to hold (demand) as interest rates fall.
Lower returns (from things such as transaction accounts) have an opportunity cost for not having taken the higher risk (from things such as stocks and bonds), in the amount of the difference between the higher and lower returns. The quantity of money people are willing and able to hold (demand) increases as interest rates fall.
Transaction accounts Savings Stocks and Bonds
Lower returns Moderate returns High returns
Forgone interest is the opportunity cost of money that people choose to hold money.
Demand for Money
Transactions demand for money: Money demanded, needed or held for daily transactions.
Precautionary demand for money: Money demanded, or held for unexpected market transactions or for emergencies.
Speculative demand for money: Money demanded, or held for possible financial opportunities later
People hold or demand more of it as interest rates fall, because the opportunity cost of holding it is less.
The Fed’s goal of using monetary policy is to alter macro economic outcomes, specifically prices, output, and employment.
Monetary stimulus is used to increase AD, done by lowering interest rates.
They lower the cost for Consumers and for Investment.
They lower the opportunity cost of holding inventories, thus businesses buy more for stockpiling.
The jump in spending means more money in the circular flow, thus more deposits, and the multiplier kicks in.
According to Keynes (and others) the Feds stimulate the economy by monetary policy by
An increase in the Money Supply
Causing a reduction in interest rates
Causing an increase in Aggregate Demand
The reverse of all of this is true.
Former Fed Chairperson, Alan Greenspan’s policy guide:
Lowering long-term interest by 1% = $100 billion in fiscal stimulus
Lowering long-term interest by .1% = $10 billion in fiscal stimulus
The stimulus may be an attempt to counter a downward spiral of demand, thus the billions of dollars in stimulus may not have a NET increase in AD, as we saw the Monday after 9/11 when the stock market reopened.
Short vs Long-Term rates.
Short-Term rates are overnight rates, while long-term are for things such as 30-year mortgages.
Sometimes the process does not work in the process mentioned above.
This happens when there are:
1. Long-Term rates that don’t fall. They often fall much slower than the Short-Term (such as in 2001 when the Fed lowered the Federal fund (overnight) rate by 3 percentage points, while during the same period, 30-year rates dropped by only ½ %).
2. Unwilling lenders
There is less willingness of private banks to lend or are more willing to increase reserves for fear that a bad economy will cause loans to not be repaid.
3. There is the Liquidity Trap. Sometimes, when the Fed changes the money supply, interest rates don’t respond in the short-term.
When interest rates drop, the opportunity cost to hold money is cheap.
At such times people hold all the money they can (or maintain liquidity) in order to wait for later opportunities or needs.
This causes fewer deposits, because peoples’ money is “trapped” in their wallets until things change.
If this happens, further increases in the money supply don’t have an effect on interest rates. Keynes called this The Liquidity Trap.
If people keep holding money, deposits don’t increase, and the multiplier doesn’t kick in and Aggregate Demand does not increase.
4. Low Expectations
a. Investment (business) decisions are motivated, not only by interest rates, but by expectations as well. Firms have little incentive to invest when the economy outlook is bleak.
b. Consumers will also be down due to bad expectations.
5. Time Lags
a. There is a time-lag (6-12 months) between the lowering interest rate and people going out and borrowing.
b. There is also legislative lag when government must use an act of Congress to increase the money supply with a tax decrease.
Sometimes Monetary Restraint doesn’t slow down the economy.
This happens when there are:
1. High Expectations of rising sales and profits and jobs by business and consumers
2. Time Lags
3. Global resources of money
a. If business wishes to borrow at a low rate when the Fed raises interest rates, they can go outside the U.S. to borrow.
The Monetarists do not share these beliefs (of Keynes in suggesting raising or lowering the money supply to manage economy) in light of the limitations already mentioned.
As mentioned in a different discussion, the monetarists see the changes in the money supply as unpredictable and ineffective and that real levels of output are not affected by monetary stimulus; only prices change.
They DO see it as a powerful tool for managing inflation.
Recall the Equation of Exchange: MV=PQ (Money Supply x Velocity of Money) = (Price x Quantity Produced and Purchased)
This is not disputed.
If M increases, prices or output must rise or v must fall.
Velocity of money is how often it moves from one person/buyer/seller to the next and it drives the circular flow.
Monetarists see velocity of money as stable and depends upon the structure of the money markets as well as peoples’ habits.
They contend that neither will change with the change in the Money Supply, thus only total spending will rise.
They feel that interest rate movements are secondary to the thrust of monetary policy and should not be its primary focus.
They feel that changes in the money supply must alter total spending, regardless of how interest rates move.
They feel that Q is stable, if producers cannot increase output to meet demand; thus only prices, not output will rise.
The Natural rate of output is the rate at which you produce without having to push production to the envelope and/or without having to increase capacity. It is the structure of the organizations that determines their output.
If natural output does not rise, you can have natural unemployment.
These structural forces establish the natural rate of unemployment.
There is no reason for producers to depart from the natural rate of output when the money supply increases.
They are smart enough to know that both prices and costs will rise when spending increases at the same rate and when this happens, profits remain the same, thus giving no profit incentive to increase output.
The most extreme monetarist perspective concludes that changes in the money supply affect prices only.
Restraint: The monetarists feel that Keynes’ view that reducing the money supply to drive up interest rates to slow the economy won’t work because nominal rates are already likely to be high because inflation drives them up and that an effective anti-inflation policy (if adopted) would drive interest rates down.
The nominal rate of interest = what we actually pay = real rate + expected inflation rate + risk premium
Monetarist feel that the real rate of interest is fairly stable, thus changes in the nominal rate reflect changes in anticipated inflation, and thus they feel that high interest rates are a symptom of inflation, not a cure.
Both Keynes and the Monetarists agree that tightening the money supply is needed to slow down the economy, but
Keynes relies on a quick fix of higher interest rates to slow consumption
Monetarists feel that interest rates will fall with a tight money supply, because people will anticipate less inflation with a tight money supply and reduce nominal rates.
Recall that long-term interest rates don’t mirror the short-term rates when they fall.
If people anticipate no inflation in the long run, long-term rates will fall; they will increase if market participants believe that inflation will worsen in the long-term
Therefore, Monetarists believe that you may have to stall the economy to reduce interest rates and inflation, but rather than take that risk, you must advocate steady, predictable changes in the money supply, reducing uncertainties and stabilizing long-term interest rates and GDP growth.
Monetarists feel that to stimulate employment, raising M in order to lower rates (as Keynes advocates) would only raise P. If everyone sees this happening, nominal interest rates would then go up in anticipated inflation, defeating the purpose of monetary stimulus. They feel that it could actually create inflation on top of our unemployment woes (creating stagflation) as we saw in the late 1970s.
Predictable increases in M would allow firms to plan years in advance for such increases so that a higher M would create a higher Q and not a higher P.
Other problems with tight money:
Higher interest rates hit many industries harder than others disproportionately (such as housing). This not only hurts the economy, but it reduces the share of housing in GDP spending. All related fields are those affected.
Tight money also tends to still be available for larger firms than smaller firms.
Compare fiscal policy between Keynes and the Monetarists:
Keynes: Higher Government Spending (More G) and lower taxes (Less T) will increase velocity of money (V).
Monetarists: Higher Government Spending (More G) and lower taxes (Less T) will NOT increase velocity of money (V), because they feel that V is stable and will be unchanged and thus it won’t help the economy thus fiscal policy helps neither unemployment nor inflation. Nominal interest rates will rise, but real rates won’t.
Compare monetary policy between Keynes and the Monetarists
Keynes: If M goes up, interest rates fall, GDP goes up.
Monetarists: If M goes up, prices go up, thus interest rate go up, aggregate demand is unchanged.
Chapter 16
Supply-Side Economics in depth
The closer that we are to capacity, the greater the risk that fiscal or monetary stimulus will spill over into inflation.
Demand stimulus and restraint cause increases in inflation or decreases in output/employment when the supply curve is upward sloping. The Phillips curve illustrates the trade off between inflation and employment.
Rightward shifts of the aggregate supply curve can reduce inflation and unemployment. It can also shift the Phillips curve to the left.
A leftward shift of the aggregate supply curve is a nightmare, increasing the misery index. They can be caused by a natural disaster, or an abrupt price increase of necessary commodities such as oil.
Oil shocks also create circular flow leakages as we become more dependent upon foreign oil.
The Misery Index (a.k.a. The Tragic Number) = Sum of inflation rate + the unemployment rate.
To shift the curve the right:
Tax incentives for saving, investment, and work.
Keynes believed in tax breaks to make more money available for spending.
Supply-side theorist believed in tax breaks to encourage people to work and produce more.
Higher marginal tax rates give less incentive for people to work (the reverse is true).
Higher marginal tax rates discourage business expansion and increases in output (the reverse is true).
Higher marginal tax rates discourages business investment (I).
The effect of tax reductions depend upon the Tax Elasticity of Supply.
It is equal to the absolute value of the % change in Quantity supplied / % change in the tax rate
Example: if % change in Quantity supplied / % change in the tax rate = 1.50%/-1.00% it would then = 1.5
If there is a tax cut of 10%, there would be an increase in the supply of goods and services of 10% x 1.5= 15% (Thus there is a negative correlation)
Savings incentives are needed by the use of tax breaks to increase savings and expand Investment (I) to increase output.
Investment incentive encourages people to buy stock and start businesses, thus increasing output via increases in supply and it can be done in a capital gain tax. President George Bush Sr. pushed it. President Bill Clinton advocated tax incentives to people when they invested in more plant and equipment up to about 10% of their investment.
Human capital investment
Increase skills and knowledge in the workforce by training, using tax credits to do so, thus improving labor productivity and ultimately the utility of each worker giving them more skills and more income.
Increased funding for local schools (George Bush Sr. advocated getting more money into the classroom).
Affirmative action and removal of discrimination.
Welfare reform encouraged people to work rather than live off of government.
Welfare to work programs between 1996 and 2001 got 2.5 million Americans to work and off of welfare.
Deregulation (removal of the unreasonable or “too high” costs of regulation).
Reduction of the minimum wage and mandatory benefits, and allowing the market to drive them.
Unreasonable occupational safety and health.
Reduction of regulation of transportation industry so that trucking etc. can respond to changes in demand and keep prices down.
Removal of unreasonable food and drug standards and unreasonable environmental protection.
The Reagan Administration often quarreled with Congress as to what was and was not unreasonable regulation.
Trade liberalization
Easing of trade barriers of the Factor markets
Tariffs on imported sugar costs producers and ultimately consumers $2 billion.
By reducing tariffs on imports our products and factors of production drop, but also might lower tariffs charged to us by foreign countries, thus selling more of our goods.
NAFTA was pushed, passed, and signed by President Clinton.
Immigration gives more possibilities for increasing supply and lowering costs.
Infrastructure development
Improving roads, transportation, communication, judicial systems that bind the pieces of the economy into a coherent organism.
Expectations
Because Investment (I) is always a bet on the future economic conditions, expectations directly effect the AS curve.
More regulation and taxes deters investors from expanding production capacity.
See Spreadsheet For The Eclectic (Hybrid) Aggregate Supply Curve
Chapter 18
Dow Jones and other indexes
In a closed economy, Exports and Imports are not a factor in a country’s GDP.
When a country consumes more than it produces, there is a trade deficit.
When the leakage of imports exceeds the reinjection of exports, there is a trade deficit.
Part of any increase in spending is spent on imports by the % amount of the marginal propensity to import (MPM).
Example: Assume 10% MPS in either economy and assume 10% MPM in an open economy.
| Closed Economy | Open Economy | |
| Added Government Spending | $10 billion | $10 billion |
| Added Savings | $1 billion | $1 billion |
| Imports Spending | 0 | $1 billion |
| Multiplier | 1/MPS=1/.10=10 | 1/(MPS+MPM)=1/(.20)=5 |
| Added Consumption | $9 billion ($10 billion * (1-10%)) | $8 billion ($10 billion * (1-20%)) |
| Multiplier induced consumption | 10x $9 billion added consumption= $90 billion | 5 x $8 billion added consumption = $40 billion |
| Cumulative change | $10 billion (original) + $90 billion (above) = $100 billion | $10 billion (original) + $40 billion (above) = $50 billion |
Trade imbalances
permit domestic living standards to exceed domestic output (or to give us more options as consumers when consumption exceeds output (advantage)
even at our full employment, can reduce domestic crowding out when increased government spending could otherwise supplant consumption and investment (advantage)
keep other countries’ economies with a trade surplus, and thus healthy enough to buy our products (advantage)
discourage other countries from setting tariffs on our goods that we export (advantage)
dramatically reduce the impact of fiscal stimulus (disadvantage)
causes much of our capital to leave our country and go to other countries by buying the foreign products (disadvantage)
can also send more capital abroad when we buy more investments overseas than what foreign people buy from our corporations (causing a capital deficit)
Foreign economies tend to be hardest hit by slowdowns in our country when their products are a major import of ours, such as cars and high tech equipment.
Other economies to which we export must stay healthy to keep our trade deficit from widening.
Global coordination and cooperation
IMF (The International Monetary Fund)
The work of the IMF is of three main types. Surveillance involves the monitoring of economic and financial developments, and the provision of policy advice, aimed especially at crisis-prevention. The IMF also lends to countries with balance of payments difficulties, to provide temporary financing and to support policies aimed at correcting the underlying problems; loans to low-income countries are also aimed especially at poverty reduction. Third, the IMF provides countries with technical assistance and training in its areas of expertise. Supporting all three of these activities is the IMF work toward economic research and statistics.
In recent years, as part of its efforts to strengthen the international financial system, and to enhance its effectiveness at preventing and resolving crises, the IMF has applied both its surveillance and technical assistance work to the development of standards and codes of good practice in its areas of responsibility, and to the strengthening of financial sectors.
The IMF also plays an important role in the fight against money-laundering and terrorism
Group of eight
The Group of Eight (G8, and formerly the G6 or Group of Six) is a forum for governments of eight nations of the northern hemisphere: Canada, France, Germany, Italy, Japan, Russia, the United Kingdom, and the United States; in addition, the European Union is represented within the G8, but cannot host or chair. "G8" can refer to the member states or to the annual summit meeting of the G8 heads of government. The former term, G6, is now frequently applied to the six most populous countries within the European Union (see G6 (EU)). G8 ministers also meet throughout the year, such as the G7/8 finance ministers (who meet four times a year), G8 foreign ministers, or G8 environment ministers.
Each calendar year, the responsibility of hosting the G8 rotates through the member states in the following order: France, United States, United Kingdom, Russia, Germany, Japan, Italy, and Canada. The holder of the presidency sets the agenda, hosts the summit for that year, and determines which ministerial meetings will take place. Lately, both France and the United Kingdom have expressed a desire to expand the group to include five developing countries, referred to as the Outreach Five (O5) or the Plus Five: Brazil, China, India, Mexico, and South Africa. These countries have participated as guests in previous meetings, which are sometimes called G8+5. Recently, France, Germany, and Italy are lobbying to include Egypt to the Outreach Five (O5) and expand the G8 to G14. [2]
The Dow Jones ESI (Economic Sentiment Indicator)
The Dow Jones Economic Sentiment Indicator aims to predict the health of the U.S. economy by analyzing the coverage of 15 major daily newspapers in the U.S. using a proprietary algorithm to look for positive and negative sentiment about the economy in every article in each of the newspapers.
For Example: In March of 2010, better-than-expected regional business news along with small improvements in several national economic measures provided enough bright spots in a month with decidedly mixed economic news to help drive the Dow Jones Economic Sentiment Indicator (ESI) up in March to 39.4, a modest, but promising, increase from 38.1 in February.
The ESI represents one of the most comprehensive and far-reaching examinations of media coverage as an economic indicator. The ESI's back-testing to 1990 shows that the ESI clearly highlighted the risk that the U.S. economy was sliding into recession in 2001 and 2008 and suggests the indicator can help predict economic turning points as much as seven months in advance of other indicators.
Unlike some other indicators where 50 is a clear break-point between recession and recovery, the ESI needs to be read with reference to longer trends. Based on the ESI's performance since 1990, previous recoveries have been marked by substantial month-to-month gains, with a jump of three points seeming to be a sign of significant improvement. A drop below 50 marks the point at which there is a clear risk of a slowdown.
The Dow Jones Economic Sentiment Indicator is calculated using a proprietary algorithm through Dow Jones Insight, a media tracking and analysis tool. More information about the Economic Sentiment Indicator and its development is available at http://dowjones.com/esi .
Dow Jones Insight uses innovative text mining and analytic technologies to help organizations keep informed about relevant issues, news, conversations and trends emerging in mainstream, Web and social media. Dow Jones Insight's global content collection includes more than 25,000 news and information sources as well as blogs, message boards, and posts from YouTube and Twitter.
About Dow Jones
Dow Jones & Company is a News Corporation company. (NWS, NWSA; ASX: NWS, NWSLV; www.newscorp.com) Dow Jones is a leading provider of global business news and information services.
VIX - CBOE Volatility IndexWhat Does VIX - CBOE Volatility Index Mean?
The ticker symbol for the Chicago Board Options Exchange (CBOE) Volatility Index which shows the market's expectation of 30-day volatility. It is constructed using the implied volatilities of a wide range of S&P 500 index options. This volatility is meant to be forward looking and is calculated from both calls and puts. The VIX is a widely used measure of market risk and is often referred to as the "investor fear gauge".
Put Options give a person to sell a set number of shares of stock to another person at a given price. The person they have the right to sell the stocks to consider the options Call Options giving that person the right to buy the number of shares of stock at that given price.
There are three variations of volatility indexes: the VIX tracks the S&P 500, the VXN tracks the Nasdaq 100 and the VXD tracks the Dow Jones Industrial Average.
![]()
Investopedia explains VIX - CBOE Volatility Index
The first VIX, introduced by the CBOE in 1993, was a weighted measure of the implied volatility of eight S&P 100 at-the-money put and call options. Ten years later, it expanded to use options based on a broader index, the S&P 500, which allows for a more accurate view of investors' expectations on future market volatility. VIX values greater than 30 are generally associated with a large amount of volatility as a result of investor fear or uncertainty, while values below 20 generally correspond to less stressful, even complacent, times in the markets.
World Bank is a term used to describe an international financial institution that provides leveraged loans[2] to developing countries for capital programs. The World Bank has a stated goal of reducing poverty.
The World Bank differs from the World Bank Group, in that the World Bank comprises only two institutions: the International Bank for Reconstruction and Development (IBRD) and the International Development Association (IDA), whereas the latter incorporates these two in addition to three more:[3] International Finance Corporation (IFC), Multilateral Investment Guarantee Agency (MIGA), and International Centre for Settlement of Investment Disputes (ICSID).
The League of Nations (LON) was an inter-governmental organization founded as a result of the Treaty of Versailles in 1919–1920, and the precursor to the United Nations. At its greatest extent from 28 September 1934 to 23 February 1935, it had 58 members. The League's primary goals as stated in its Covenant included preventing war through collective security, disarmament, and settling international disputes through negotiation and arbitration.[1] Other goals in this and related treaties included labor conditions, just treatment of native inhabitants, trafficking in persons and drugs, arms trade, global health, prisoners of war, and protection of minorities in Europe.[2]
The diplomatic philosophy behind the League represented a fundamental shift in thought from the preceding hundred years. The League lacked its own armed force and so depended on the Great Powers to enforce its resolutions, keep to economic sanctions which the League ordered, or provide an army, when needed, for the League to use. However, they were often reluctant to do so.
(MPM Review)
MPS 40% and MPM 40%
| Closed Economy | Open Economy | |
| Added Government Spending | $40 billion | $40 billion |
| Added Savings | $16 billion | $16 billion |
| Imports Spending | 0 | $16 billion |
| Multiplier | 1/MPS=1/.40=2.5 | 1/(MPS+MPM)=1/(.80)=1.25 |
| Added Consumption | $24 billion | $8 billion |
| Multiplier induced consumption | 2.5 x $24 billion added consumption= $60 billion | 1.25 x $8 Billion |
| Cumulative change | $100 billion | $50 billion |


