biology lab
Studies of yeast respiration with the oxygen electrode
Aims
You will measure compare the rates of respiration by yeast of sugars at different conditions using the oxygen electrode.
Good laboratory practice is essential: no eating or drinking; wear lab coats at all times; handle chemicals carefully and with gloves; read, understand and reflect about the experiment.
Introduction
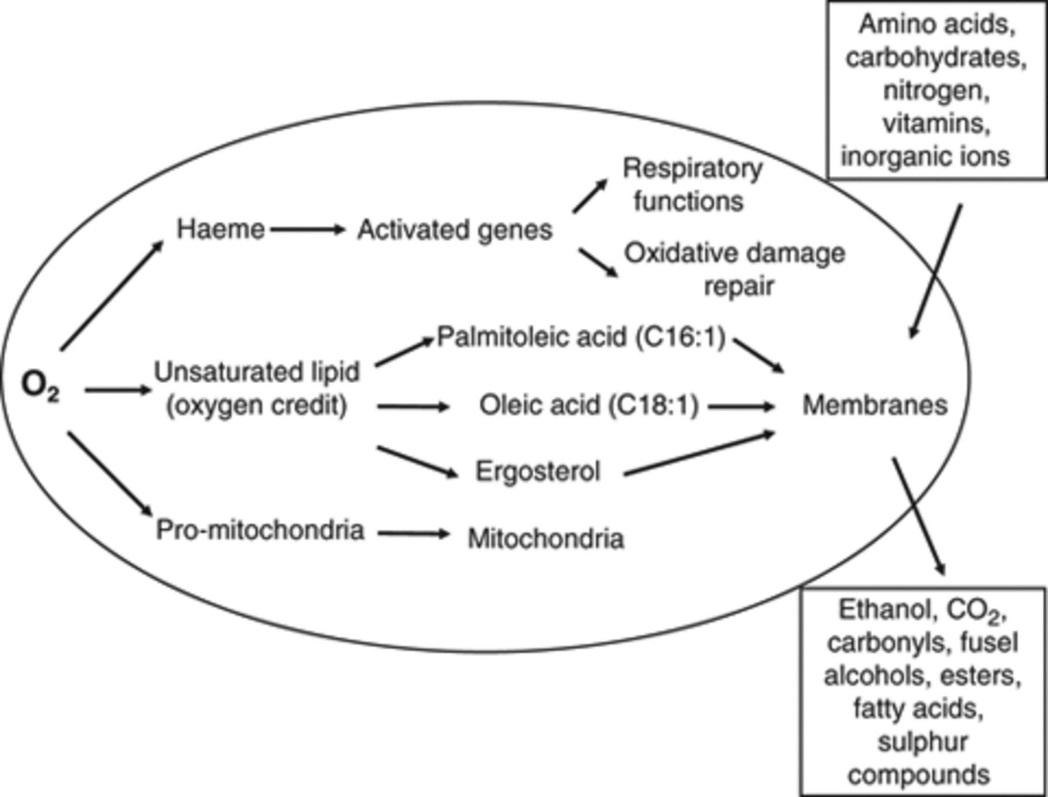
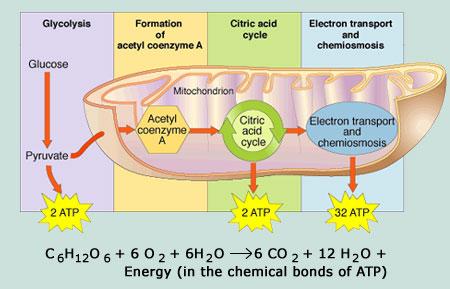
Under aerobic conditions sugars are respired to carbon dioxide and water via the glycolytic pathway and the citric acid cycle. The respiration of a yeast suspension is conveniently monitored by following the decline in the concentration of dissolved oxygen using an oxygen electrode. It is essential to starve the yeast suspension by bubbling a stream of air through it overnight to deplete endogenous reserves of glycogen, otherwise a high rate of respiration is observed before the substrate (eg. a sugar) is added. Even then, a small rate of respiration is usually observed due to metabolism of remaining endogenous reserves. It is usual practice to estimate this, the endogenous rate, and to apply a correction for it.
Materials:
7.5 mL 0.05M K phosphate buffer pH 5.0, saturated with air at 30C by bubbling.
7.5 mL 0.05M K phosphate buffer pH 1.0, saturated with air at 30C by bubbling.
7.5 mL 0.05M K phosphate buffer pH 9.0, saturated with air at 30C by bubbling.
5 mL 1% (w/v) suspension of fresh yeast in the buffer above, starved by bubbling with air at 30C for at least 4 hours.
Glucose (0.16M), Galactose (0.16M), Ethanol (0.16M), Sodium Azide (0.16M)
Procedure
1. Pipette 1500 L of air-saturated buffer into the reaction vessel of an oxygen electrode. Note the temperature of the water bath in which the buffer is immersed; you will need this for a subsequent calculation. If you do not have a thermometer, note the temperature as 30C.
2. Calibrate the electrode by turning the dial till it reaches 100. If the electrode reading fluctuates wildly or drifts steadily downwards, consult a member of staff.
3. Add 1000 μL of the 10 mg/mL yeast suspension to the reaction vessel, and start recording the data every 5 seconds.
5. When you reach 100 seconds, inject 25 L of 0.16 M glucose solution through the vent to the electrode chamber using a Hamilton syringe and allow the data to accumulate until 200 seconds, at this time inject 25 L of 0.16 M sodium azide solution through the vent to the electrode chamber using a Hamilton syringe and allow the data to accumulate the end of the run (360 seconds). Ensure that the needle enters the electrode chamber.
6. Pipette out the contents of the reaction chamber with a dropping pipette and wash out the reaction chamber three times with distilled water.
7. Determine respiration rates before and after the addition of 25 L of 0.16 M solution of galactose by repeating steps 1-3.
8. Pipette out the contents of the reaction chamber with a dropping pipette and wash out the reaction chamber three times with distilled water.
9. Pipette 1500 L of air-saturated buffer (pH 1) into the reaction vessel of an oxygen electrode. Note the temperature of the water bath in which the buffer is immersed; you will need this for a subsequent calculation. If you do not have a thermometer, note the temperature as 30C.
10. Calibrate the electrode by turning the dial till it reaches 100. If the electrode reading fluctuates wildly or drifts steadily downwards, consult a member of staff.
11. Add 1000 μL of the 10 mg/mL yeast suspension to the reaction vessel, and start recording the data every 5 seconds.
12. When you reach 100 seconds, inject 25 L of 0.16 M glucose solution through the vent to the electrode chamber using a Hamilton syringe and allow the data to accumulate until 200 seconds, at this time inject 25 L of 0.16 M sodium azide solution through the vent to the electrode chamber using a Hamilton syringe and allow the data to accumulate the end of the run (360 seconds). Ensure that the needle enters the electrode chamber.
13. Pipette out the contents of the reaction chamber with a dropping pipette and wash out the reaction chamber three times with distilled water.
14. Determine respiration rates before and after the addition of 25 L of 0.16 M solution of galactose by repeating steps 1-3.
15. Pipette out the contents of the reaction chamber with a dropping pipette and wash out the reaction chamber three times with distilled water.
16. Pipette 1500 L of air-saturated buffer (pH 1) into the reaction vessel of an oxygen electrode. Note the temperature of the water bath in which the buffer is immersed; you will need this for a subsequent calculation. If you do not have a thermometer, note the temperature as 30C.
17. Calibrate the electrode by turning the dial till it reaches 100. If the electrode reading fluctuates wildly or drifts steadily downwards, consult a member of staff.
18. Add 1000 μL of the 10 mg/mL yeast suspension to the reaction vessel, and start recording the data every 5 seconds.
19. When you reach 100 seconds, inject 25 L of 0.16 M glucose solution through the vent to the electrode chamber using a Hamilton syringe and allow the data to accumulate until 200 seconds, at this time inject 25 L of 0.16 M sodium azide solution through the vent to the electrode chamber using a Hamilton syringe and allow the data to accumulate the end of the run (360 seconds). Ensure that the needle enters the electrode chamber.
20. Pipette out the contents of the reaction chamber with a dropping pipette and wash out the reaction chamber three times with distilled water.
21. Determine respiration rates before and after the addition of 25 L of 0.16 M solution of galactose by repeating steps 1-3.
| seconds | Glucose pH 5 | Galactose pH 5 | Glucose pH 1 | Galactose pH 1 | Glucose pH 9 | Galactose pH 9 |
|
|
|
|
|
| ||
|
|
|
|
|
| ||
| 10 |
|
|
|
|
| |
| 15 |
|
|
|
|
| |
| 20 |
|
|
|
|
| |
| 25 |
|
|
|
|
| |
| 30 |
|
|
|
|
| |
| 35 |
|
|
|
|
| |
| 40 |
|
|
|
|
| |
| 45 |
|
|
|
|
| |
| 50 |
|
|
|
|
| |
| 55 |
|
|
|
|
| |
| 60 |
|
|
|
|
| |
| 65 |
|
|
|
|
| |
| 70 |
|
|
|
|
| |
| 75 |
|
|
|
|
| |
| 80 |
|
|
|
|
| |
| 85 |
|
|
|
|
| |
| 90 |
|
|
|
|
| |
| 95 |
|
|
|
|
| |
| 100 |
|
|
|
|
| |
| 105 |
|
|
|
|
| |
| 110 |
|
|
|
|
| |
| 115 |
|
|
|
|
| |
| 120 |
|
|
|
|
| |
| 125 |
|
|
|
|
| |
| 130 |
|
|
|
|
| |
| 135 |
|
|
|
|
| |
| 140 |
|
|
|
|
| |
| 145 |
|
|
|
|
| |
| 150 |
|
|
|
|
| |
| 155 |
|
|
|
|
| |
| 160 |
|
|
|
|
| |
| 165 |
|
|
|
|
| |
| 170 |
|
|
|
|
| |
| 175 |
|
|
|
|
| |
| 180 |
|
|
|
|
| |
| 185 |
|
|
|
|
| |
| 190 |
|
|
|
|
| |
| 195 |
|
|
|
|
| |
| 200 |
|
|
|
|
| |
| 205 |
|
|
|
|
| |
| 210 |
|
|
|
|
| |
| 215 |
|
|
|
|
| |
| 220 |
|
|
|
|
| |
| 225 |
|
|
|
|
| |
| 230 |
|
|
|
|
| |
| 235 |
|
|
|
|
| |
| 240 |
|
|
|
|
| |
| 245 |
|
|
|
|
| |
| 250 |
|
|
|
|
| |
| 255 |
|
|
|
|
| |
| 260 |
|
|
|
|
| |
| 265 |
|
|
|
|
| |
| 270 |
|
|
|
|
| |
| 275 |
|
|
|
|
| |
| 280 |
|
|
|
|
| |
| 285 |
|
|
|
|
| |
| 290 |
|
|
|
|
| |
| 295 |
|
|
|
|
| |
| 300 |
|
|
|
|
| |
| 305 |
|
|
|
|
| |
| 310 |
|
|
|
|
| |
| 315 |
|
|
|
|
| |
| 320 |
|
|
|
|
| |
| 325 |
|
|
|
|
| |
| 330 |
|
|
|
|
| |
| 335 |
|
|
|
|
| |
| 340 |
|
|
|
|
| |
| 345 |
|
|
|
|
| |
| 350 |
|
|
|
|
| |
| 355 |
|
|
|
|
| |
| 360 |
|
|
|
|
|
For your report you need to plot and obtain:
Plot out your results using excel with the time scale in seconds. Use a different symbol for each substrate and mark the point on the plot where the substrate was added.
Determine the slope of the linear part of each curve (using the slope function of EXCEL) before and after the addition of substrate making use of as many experimental points as possible. Where the rate increases steadily after the addition of substrate take the maximum rate achieved.
Correct the rate obtained following the addition of substrate for the endogenous rate, ie. Subtract the rate obtained before substrate was added. Your rates should be in s-1.
Calculate the rate of respiration of each substrate in mol O2 consumed per min per mg wet weight of yeast as follows:
Rate in mol/min/mg = (corrected slope x 60 x 0.237 x 3)/(100 x 10)
(Multiplying by 60 s/min converts the rate from s-1 to min-1)
(Multiplying by 0.237 x 3 and dividing by 100 converts the rate from a change in electrode reading/min to mol O2 consumed/min since the electrode was set to read 100 on buffer saturated with air at 30C which contains 0.237 mol O2 per mL or 0.237 x 3 mol in the 3 mL (3000 L) system)
(Division by 10 converts the rate to mol/min/mg yeast since 10 mg of yeast was added to the system, ie. 1 mL (1000 L) of a 10 mg/mL suspension.)
You should comment in your discussion mitochondrial diseases, how monitoring oxygen is important, respiratory chain blockers.
Your full write up experiments should be written up under the headings below, as appropriate. You will still need to keep a good lab notebook but there will be a formal write up to hand in two weeks after the lab class.
The turnitin report will be marked as:
Abstract: 5 marks
Introduction: 15marks
Safety Audit: 5 marks
Materials and methods: 5 marks
Results: 45 marks
Conclusion and Discussion: 20 marks
Referencing: 5 marks
GUIDELINES ON TURNITIN REPORTS
The format for writing a lab report generally follows the standardized approach outlined here, but you may find some assignments issued to you on different modules have slightly different requirements. Always check with the person setting the assessment if you are unsure! For this module, the full report should follow the structure outlined below.
TITLE : This is a concise (one sentence) heading that summarizes what the report is about.
ABSTRACT: This is conventionally a 200 word summary of the report. In the first sentence, the research question should be introduced and in the second sentence the methodology should be described. The major results of the study should be reported in the next sentence and your concluding statement should include an interpretation of the impact and significance of your result. A selection of published abstracts written by some of your lecturers are available on Blackboard under ‘Learning Materials’- check them out! You will see that there are various ways of writing an abstract and this is ultimately dictated by the journal in which the work is published. Being able to write a concise summary of your work with adherence to word counts is excellent academic writing practice.
INTRODUCTION: This section is often the most variable between different assessments. The introduction should be 1 side of A4 (12pt font) and aims to introduce the research question being addressed whilst putting it into context of what is already known about the subject (i.e. the background information). In brief, the introduction should include;
1) A description of the research question and a summary of what is currently known about the research question (for example, if you are investigating the effect of drug X on protein X, then what is currently known about drug X and protein X?). This is usually the longest section of the introduction.
2) A statement concerning the aims of your study and what methods will be used to address the aims (for example, ‘We aim to assess the effect of drug X on the activity of protein X by measuring protein X activity via a colorimetric assay utilizing spectrophotometry’)
SAFETY AUDIT: Before starting, read through the entire experiment and check all materials and solvents involved for hazardous properties, making brief notes. A safety audit should include the risk phrases and numbers as well as the safety phrases and numbers for each material. You can find the in the MSDS (material safety datasheet for each chemical).
MATERIALS AND METHODS: This should be a summary of the experimental procedure, written in your own words in the third person passive, e.g. "sodium chloride (20 g) was added to a stirred solution of silver nitrate (2 g) in water (50 ml). The white precipitate was collected, washed with water (20 ml), and dried at 70 ˚C" etc. It must not be copied from the laboratory manual. Note that quantities are placed in parentheses () after the name of the substance to which they refer, i.e. "water (50 ml)" is correct, while "50 ml of water" is wrong. You should NOT simply cut and paste the full protocol listed in the module book! Occasionally, you may be asked to put ‘as per the module book’ with an appropriate citation, but not in this module! For the reports associated with this module, you should produce a short and concise summary of the protocol written in past tense and remember, it should contain enough practical detail to enable anyone else to successfully repeat the work. Important information that should be incorporated in this section includes the citation of volumes and concentrations of all reactants used, the temperature and pH used, the timings of reaction etc and any other important variables (and how they were controlled).
RESULTS: In this section you should show your results (using graphs, tables, photographs etc) AND describe your results. It is not enough to simply put a graph in this section without explaining what it shows! You don’t need to interpret or explain the results in this section (that is for the discussion section!), just ‘describe what you see’ and identify any trends/patterns. Present your quantitative (or indeed qualitative) results in the clearest possible way with adequate linking of each part of the experiment (if more than one part) in a logical sequence. Ensure that tables and graphs are self-explanatory and provide all the information necessary to allow interpretation of the data without reference to the text. Tables should have an appropriate title above them for example ‘Table 1- Protein X activity at different concentrations of drug X’ whereas figures (graphs, pictures, photographs) should have an appropriate title below them for example ‘Figure 1- Protein X activity at different concentrations of drug X’. Graphs also need a clear heading for example ‘A graph to show the relationship between absorbance at 495nm of protein X and drug X concentrations’ and both x and y axes should be appropriately labelled and include a citation of units of measurements. Remember, the Y axis values should be the dependent variable, i.e., what was measured during the experiment or calculated at the end of the experiment. The X axis values are the independent variables, i.e. the ‘conditions’ that are actually known, set-up and controlled in the experiment. Always compare your analytical data (e.g. melting points) with published values, and quote the source of your information in full, i.e. authors name and initials, title of the journal or book, publisher (if a book), year, volume, and page number.
DISCUSSION and CONCLUSSION: In this section you should explain and discuss your results with reference to the underlying scientific principles and other research in the field. You should try to include a discussion of; 1) Any overall trends and patterns in the results and how/why anomaly formation might have occurred. A thorough scientific explanation of the results should be offered and you should link this to scientific literature (including textbooks and scientific publications). What scientific evidence exists to support your findings? Is there any scientific evidence that contradicts your findings? What is the scientific explanation of this? 2) How the results fit in with the original aims. Did your results address the aims of the study? If your results are not what you expect- what could be the scientific explanation? 3) Errors, limitations, improvements and alternative approaches. Were there any difficulties encountered during the lab work? How accurate and precise were your methods/equipment? Were all variables sufficiently controlled? Were there any limitations of the methods used? Could any of these factors have affected the reliability and variability of your data? How could you have improved the study? Are there any other alternative approaches (such as those used in industry, clinical/research labs) that could be used to address the same research aims? 4) Future investigations How could you extend the study to understand the research question in more detail?. CONCLUSSION: You should give a brief, justified conclusion/summary of your results and their significance (3-4 lines only).
BIBLIOGRAPHY: This section goes at the end of the write up. Any reading material that you have consulted during the write-up should be cited in text and in the bibliography section at the end of the report using the Harvard System method- full details of how to reference appropriately can be found in the Study Skills module book. In brief, in the main body of the text you should cite the author surnames (if only one or two authors) and year published (Smith, 2010 or Smith & Jones, 2010). If there are more than three authors, you cite the first author surname followed by ‘et al’ and the year published (Smith et al, 2010). For example; In the bibliography section at the end, the full citation should be provided, and these should be listed in alphabetical order by first author surname. Different information needs to be listed, depending on what kind of source you used for your information. In brief, the minimum you should cite is;
For journal articles cite author(s) surname(s), initial(s), year of publication, title, journal, volume, pages.
For example Smith,J. (1995). Amylases in plants. Journal of Botany 54, p123-456.
For books cite editor(s) name, initial(s), year of publication, title, edition, place of publication and publishers.
For example Jones, B. and Evans, C. (2004). Carbohydrate Biochemistry. 20th edition. New York: Academic Press.
For websites cite author(s) surname(s), initial(s), title, year of publication, publisher (if appropriate), available at (followed by full web site address) accessed on: (followed by date you accessed the site as some internet material may change or be updated
Bloggs, F. A guide to enzymes and their uses [on-line]. University of Salford, 2005. Available at: http://www.enzymes.nature.uses.org.html. [Accessed on 30th Sept. 2011].
More detailed information and guidelines concerning referencing via the Harvard method can be found in the Study Skills module book and on the Blackboard site for this module under ‘Learning Materials’.
A WARNING ABOUT PLAGIARISM
Plagiarism is very serious example of unfair practice. It can be defined as the compilation, incorporation and/or documentation by students of work which is NOT their own, in all types of work submitted for assessment (e.g. essays, theses, dissertations, laboratory write-ups etc). When you write up your coursework or similar you must always acknowledge any books, texts, papers, articles or information sources that you have used and any ideas or work that are not your own. You should not take any text word-for-word from any source- the University has access to advanced technology that compares your work to that of all other student submissions all over the world as well as internet sources and textbooks etc. IF YOU COPY ANYTHING FROM ANYWHERE, WORD FOR WORD THEN OUR SOFTWARE WILL DETECT THIS AND YOU WILL BE INVESTIGATED FOR ACADEMIC MISCONDUCT!!!!!!!!! Always put everything into your own words. When you have to submit your report via the TURNITIN system on Blackboard, you can submit a ‘draft’ version of your report before you submit your final report which allows you to check how similar your report is to other sources. Please use this draft submission facility!
Examples of plagiarism
1. Copying and submitting other students’ work or giving your work to someone else is plagiarism (we can’t prove who copied from who!). If you were not there for the lab, you cannot submit the report.
2. Working together on coursework (unless otherwise stated) and submitting the same or very similar work is plagiarism!
3. Submission of a joint/group piece of work (as directed by a member of staff) for assessment is not plagiarism unless there is evidence that the work is not your own (for example putting your name on a piece of work that you did not actually contribute to).
4. Using the same data as your lab partner (when collected together) is not plagiarism. Using another groups data without permission of the member of staff leading the lab is plagiarism.
5. ‘Sharing’ and submitting the same figures with your lab partner is plagiarism. Even when you have the same data as your peers you should create your own graphs and produce your own labels/titles etc.
6. Copying work (even if a single sentence) word for word from any source is plagiarism. If you need to do this (for example, when providing a scientific definition or quotation) then use quotation marks but you shouldn’t do this frequently.
7. Not citing in text or not having a bibliography is plagiarism. At L4, we may ‘forgive’ a forgotten or incorrect citation since you are in the process of learning how to reference appropriately. You will, however, lose marks for this and the consequences or inadequate referencing are much more severe at L5. Get into good habits now!
8. Not attending the practical session and submitting the work (in class or assessment) is plagiarism.
9. Do NOT use the module handbook to copy the protocol/procedure, this should be in your OWN words
Please refer to the University’s Academic Quality Assurance booklet for the policy and guidelines on plagiarism. You have been warned!
IMPORTANT SAFETY INFORMATION
Safety is of paramount importance in the laboratory. Before you begin practical work you will receive a lecture on key aspects of safety in the laboratories. You must wear safety spectacles at all times. Tie back long hair, and do not wear open-toed sandals. You must wear a lab coat at all times. You must not eat, drink, run, listen to personal stereos or use mobile phones in the laboratory. Be aware of the danger of fires. Many solvents are both volatile and flammable and may ignite if the liquid or the vapour comes in contact with flames or hot surfaces. Do not use a Bunsen burner until you are absolutely sure that no one is using a flammable solvent nearby, and always turn it off immediately after use. Be aware of the danger of cuts. Together with fires, cuts are the most common accidents we encounter. Check your glassware for breakages or sharp edges, and check carefully for cracks or 'star-cracks' in glassware which is to be used under suction (e.g. filtration flasks), or under pressure (e.g. chromatography columns). Keep ground glass joints clean so that they do not stick. Handle sample vials carefully – they can easily break when the caps are being fitted. All accidents must be reported to a member of academic staff. This is so that we can see that they are properly dealt with, and take steps to prevent repetitions. In cases of skin contact, wash thoroughly with soap and water. If skin blisters contact a demonstrator. In case of skin puncture, e.g. glass cuts, wash thoroughly under a running tap for several minutes and seek a demonstrator's advice. In cases of eye contact, rinse eyes with an eyewash and contact a demonstrator immediately. In cases of oral intake, contact the demonstrator immediately. You must be aware of the location of safety equipment. This includes eye-wash stations, fire extinguishers, fire blankets, and drench showers. Treat all chemicals with caution. Do not get any compound, especially one for which no specific safety information is available, on your hands or skin, and do not breathe dust or vapours. Use protective clothing, e.g. gloves, when necessary and only handle more dangerous or unpleasant compounds in fume cupboards. Do not leave spillages, alert a demonstrator or technician when anything is spilt.


