Write 3 pages and a half please
Group 1 27
Investigation of a Tutoring Program
Prepared for Mr. Troy Place
By
IME316
November 30, 2012
Table of Contents
List of Illustrations...........................................................................................................................3
Executive Summary.........................................................................................................................4
Introduction......................................................................................................................................5
Purpose................................................................................................................................5
Procedure.............................................................................................................................5
Limitations...........................................................................................................................6
Report Format......................................................................................................................7
Discussion Section...........................................................................................................................7
Determining the Demographics of R espondents.................................................................7
Generalizing the Demand and Supply for a Tutoring Program...........................................8
Analyzing Majors vs. Demand and Supply.........................................................................9Analyzing Class Standing vs. Demand and Supply..........................................................12
Analyzing Respondent GPA vs. Demand and Supply......................................................14
Considering Wages and Costs of a Tutoring Program......................................................15
Identifying Tutoring Service Locations, Times, and Duration..........................................16
Conclusions....................................................................................................................................17
Recommendations..........................................................................................................................19
Appendix A: Tutoring Program Questionnaire.............................................................................21
List of Illustrations
Table 1: Respondents’ Majors at CEAS......................................................................................... 8
Table 2: Respondents’ Majors vs. Demand..................................................................................10
Table 3: Respondents’ Majors vs. Supply....................................................................................11
Figure 1: Respondents’ Class Standings vs. Demand....................................................................12
Figure 2: Respondents’ Class Standings vs. Supply......................................................................13
Figure 3: Respondents’ GPAs vs. Demand...................................................................................14
Figure 4: Respondents’ GPAs vs. Supply.....................................................................................15
Executive Summary
Western Michigan University’s chapter of Alpha Pi Mu (APM), a national industrial engineering honor fraternity, has indicated that they are considering the establishment of a tutoring program at the College of Engineering and Applied Sciences (CEAS). To aid in their investigation, our group chose to conduct a survey analysis that focused on determining the specifics of initiating such a program.
After analyzing 100 surveys, we found that the percentage of students wanting to have a tutor and the percentage of students willing to tutor were both above 50%, and of those, 88% would use the services at least 4 times per semester. This reveals that there is an adequate demand and supply for the program. Moreover, approximately half of the surveyed majors had a majority of students interested in a tutoring program (both wanting a tutor and willing to tutor). Therefore, we recommend that APM pursue the initiation of the tutoring program, extending the services to all majors within the CEAS.
The data collected supports targeting underclassmen and students with lower grade point averages (GPAs) for those wanting a tutor in specific classes. Also, u pperclassmen and students with higher GPAs should be sought out to become tutors within the program. Thus, APM should focus their advertising efforts accordingly.
From the responses, we recommend APM charge $10 per hour to each tutee and pay each tutor $8.50 in order to return a 15% profit. Analyses further suggested that tutoring sessions be conducted at both Parkview (CEAS) and main campus, with the majority being held in Parkview’s study lounges and classrooms, as requested by 55% of respondents. More tutoring sessions should be scheduled for time slots after 4pm than morning or afternoon sessions. Finally, these sessions should last one hour each, as indicated by 71% of respondents.
Introduction
Purpose:
The purpose of this assignment is to form conclusions based on an analysis of responses to distributed questionnaires. A group member, serving as the acting secretary of Alpha Pi Mu (APM), a national industrial engineering honor fraternity, indicated that APM is considering the establishment of a tutoring program. As all four group members will attest, courses within Western Michigan University’s College of Engineering and Applied Sciences (CEAS) can be very rigorous and demanding. With this in mind, our group chose to investigate the initiation of a tutoring program, specifically focusing on the following:
Demand of students wanting such a service
Supply of students interested in becoming tutors
The general range of majors interested
Charge for tutoring services and wages for tutors
Tutoring service time, location, and duration.
The following parts of our introduction provide a brief description of the procedure, the limitations, and the format of our report.
Procedure:
To begin our investigation, we had to develop a questionnaire and distribute copies to students in the CEAS. Collectively, we developed a survey questionnaire around the concerns of APM. We broke down APM’s major concerns into several specific questions listed on the questionnaire (see Appendix A). We handed out our questionnaires in a manner to try to get a representative sample of all CEAS majors and class standings. Questionnaires were distributed to students in the CEAS computer lab in hopes of obtaining the insights of upperclassmen and to IME1420 students to reflect underclassmen. Additionally, we went to different study lounges to get opinions from a variety of majors.
Once the questionnaires were gathered, we tallied responses using an online data collection tool. During this time, we found that many questionnaires were completed incorrectly, and thus, were discarded. Given this, one-hundred surveys were still used in the analyses. Because 100 samples were used, the given percentages are equal to the number of respondents at any given percentage. Lastly, we formed appropriate conclusions and recommendations for APM based on these findings from the 100 surveys.
Limitations:
In conducting this survey, there were a few limitations that we had to compensate for when analyzing the data that we collected . First, since the list of majors that we provided was not exhaustive, eight respondent majors were written in as “other” and thus may be underrepresented. Also, out of the thirteen categories given, there are seven majors with three or less responses, which do not have a significant bearing within the study.
Another hindrance that we encountered was when students gave multiple responses to questionnaire questions 7, 8, and 9. These surveys were discarded from data tabulation. To prevent this in the future, these questions could have a note to instruct surveyors to only mark one answer.
We planned to attain a representative sample of all class standings. However, this was not accomplished; we only had 30% underclassmen to 70% upperclassmen. Assuming that more upperclassmen would be willing to tutor than underclassmen, the data gathered could reflect higher values for this area. Similarly, we may have underrepresented values for wanting a tutor.
Report Format:
The remainder of this report provides a discussion that analyzes the respondents’ questionnaires and the subsequent conclusions and recommendations based on these analyses. With respect to the purpose of this report, the discussion section is broken down into seven themed subsections as follows:
Subsection 1: Determining the Demographics of Respondents
Subsection 2: Generalizing the Demand and Supply for a Tutoring Program
Subsection 3: Analyzing Majors vs. Demand and Supply
Subsection 4: Analyzing Class Standing vs. Demand and Supply
Subsection 5: Analyzing Respondent GPA vs. Demand and Supply
Subsection 6: Considering Wages and Costs of a Tutoring Program
Subsection 7: Identifying Tutoring Service Locations, Times, and Duration.
Discussion Section
Determining the Demographics of Respondents
Within the CEAS, we obtained 100 surveys that can be categorized by gender, class standing, major, and grade point average (GPA) based on questions 1 through 4 of the questionnaire. Of the 100 surveys collected, 78 respondents were male and 22 were female. This is expected due to the high ratio of men to women within the CEAS. The class standing distribution consisted of 12 freshmen, 18 sophomores, 31 juniors, 31 seniors and 8 graduate students. As described in the limitations section, we do have an abundance of upperclassmen compared to underclassmen. To improve the study, a better distribution should be gathered.
The distribution of majors for the one hundred respondents can be seen in Table 1. From this table, we can see that the majors with the most responses were mechanical and aeronautical engineering, electrical and computer engineering, civil and construction engineering, and industrial engineering. Altogether, seven majors had 3 or less respondents. Again, as mentioned in the limitations section, the study could be improved by gathering a more representative sample from each major.
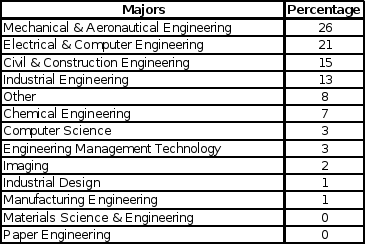
Table 1: Respondents’ Majors at CEAS
When analyzing the respondents’ GPAs, we found that 4% of the students had a GPA within the range of less than 2.0 on a 4.0 scale, 8% were in the 2.01 to 2.5 range, 26% were in the 2.51 to 3.0 range, 40% were in the 3.01 to 3.5 range, and 22% were in the 3.51 to 4.0 range. Cumulatively, this shows that 88% of the surveyed students had GPAs which fell into the range of 2.51 to 4.0. Also, the overall GPAs tend to follow a skewed left normal distribution with a mode of 3.01 to 3.5 representing a letter grade of B to BA. This seems like a good distribution for CEAS students.
Generalizing the Demand and Supply for a Tutoring Program
In order to justify implementing a tutoring service, we first needed to determine if there was a large enough demand for tutors, and also if there would be an adequate supply of students willing to serve as tutors. These levels of demand and supply were investigated based on both the amount of students interested in participating in such a service, as well as the amount of times they would utilize the services each semester.
After tabulating the 100 questionnaires, specifically focusing on questions 5 and 5a, we found that 56 students responded “yes” to wanting a tutor for one or more of their classes. When these 56 students were asked the number of times they would use a tutor each semester, the replies were as follows: 7 responses for 1 to 3 times, 21 for 4 to 8 times, 19 for 9 to 12 times, 2 for 13 to 15 times, and 7 for more than 15 times.
Using questions 6 and 6a, when asked if they would be willing to tutor students in chosen classes, 51 students responded “yes.” Again, we asked these 51 students how many times each semester they would be willing to tutor. We found the students’ responses to be as follows: 6 responses for 1 to 3 times, 23 for 4 to 8 times, 12 for 9 to 12 times, 3 for 13 to 15 times, and 7 for more than 15 times.
The amount of students wanting to have a tutor and the amount of students willing to tutor were both above 50%. Moreover, of those interested in a tutoring service (both wanting a tutor and willing to tutor), 88% would use the services at least 4 times per semester. From these responses, we have concluded that there is both a large enough demand and supply for a tutoring service. Therefore, based on general supply and demand values, a tutoring program would be a worthwhile project for APM.
Analyzing Majors vs. Demand and SupplyAnother aspect of the tutoring program that we wanted to investigate was the practicality of extending the tutoring services to all CEAS majors. Although APM is a fraternity for industrial engineers, the tutoring program could be designed as a service for all engineering majors if there were adequate demand and supply. In order to study this correlation of majors to demand and supply, we analyzed data from questions 3, 5 and 6 of our questionnaire.
The number and respective percentages of students wanting a tutor, categorized by their major, are shown in Table 2. As shown, more than 50% of the students surveyed within each of the following majors responded that they would like to have a tutor in one of more of their classes: civil and construction engineering, computer science, electrical and computer engineering, engineering management technology, imaging, industrial engineering, and those included in other majors. Of the six categories with less than 50%, four majors (industrial design, manufacturing engineering, materials science and engineering, and paper engineering) had only one or no surveys retrieved from their major. Therefore, these majors do not represent an adequate population of the students within these categories.
| Major | Total # Responses in Each Major | Wanting a Tutor | NOT Wanting a Tutor | ||
| # Students | % Students | # Students | % Students | ||
| Chemical Engineering | 28.6% | 71.4% | |||
| Civil and Construction Engineering | 15 | 53.3% | 46.7% | ||
| Computer Science | 66.7% | 33.3% | |||
| Electrical and Computer Engineering | 21 | 13 | 61.9% | 38.1% | |
| Engineering Management Technology | 66.7% | 33.3% | |||
| Imaging | 100.0% | 0.0% | |||
| Industrial Design | 0.0% | 100.0% | |||
| Industrial Engineering | 13 | 69.2% | 30.8% | ||
| Manufacturing Engineering | 0.0% | 100.0% | |||
| Materials Science and Engineering | N/A | N/A | |||
| Mechanical and Aeronautical Engineering | 26 | 12 | 46.2% | 14 | 53.8% |
| Paper Engineering | N/A | N/A | |||
| Other | 75.0% | 25.0% | |||
| Total: | 100 | 56 |
| 44 |
|
In addition, Table 3 is provided below for the number and percentages of students whom are willing to tutor students in classes of their choice, again categorized by major. This table shows that at least half of the students surveyed in the following majors are willing to tutor students for the tutoring program: computer science, electrical and computer engineering, engineering management technology, industrial design, industrial engineering, and mechanical engineering. Again, four of the seven categories with less than 50% interest had only one or no surveys retrieved from their major, which does not sufficiently represent the population.
| Major | Total # Responses in Each Major | Willing to Tutor | NOT Willing to Tutor | ||
| # Students | % Students | # Students | % Students | ||
| Chemical Engineering | 42.9% | 57.1% | |||
| Civil and Construction Engineering | 15 | 26.7% | 11 | 73.3% | |
| Computer Science | 66.7% | 33.3% | |||
| Electrical and Computer Engineering | 21 | 12 | 57.1% | 42.9% | |
| Engineering Management Technology | 66.7% | 33.3% | |||
| Imaging | 50.0% | 50.0% | |||
| Industrial Design | 0.0% | 100.0% | |||
| Industrial Engineering | 13 | 69.2% | 30.8% | ||
| Manufacturing Engineering | 0.0% | 100.0% | |||
| Materials Science and Engineering | N/A | N/A | |||
| Mechanical and Aeronautical Engineering | 26 | 16 | 61.5% | 10 | 38.5% |
| Paper Engineering | N/A | N/A | |||
| Other | 25.0% | 75.0% | |||
| Total: | 100 | 51 | 49 | ||
Table 3: Respondents’ Majors vs. Supply
Because approximately half of the surveyed majors had a majority of students interested in a tutoring program (both wanting a tutor and willing to tutor), we recommend that APM extend the services to all majors. According to the current data, it appears that there would be ample participation from majors outside of industrial engineering for the tutoring program. However, seven of the thirteen majors surveyed received three or less responses. In order to obtain more accurate results, we recommend that more surveys be distributed in order to obtain a better representation of each major.
Analyzing Class Standing vs. Demand and SupplyTo get an idea of what classes wanted to participate in a tutoring service, we correlated respondent class standing to their want for a tutor and willingness to become a tutor. This requires questionnaire question 2 to be compared with both questions 5 and 6. Figures 1 and 2, shown below, break down this correlation by percentage (“yes”/ “no”) within each class.
Looking at Fig. 1, we see that the percentage of “yes” answers for wanting a tutor exceed that of “no” answers in four out of the five given class standings. The only class standing that did not have this tendency was seniors. The gap between freshmen, sophomores, and graduate students display a trend of significantly larger “yes” responses than “no” responses.
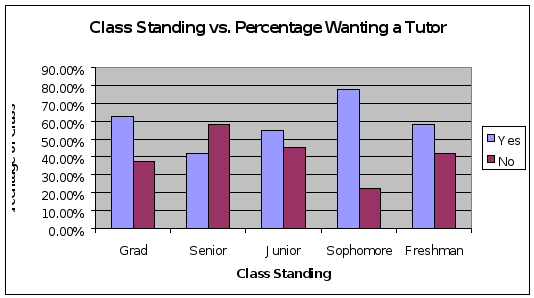
Figure 1: Respondents’ Class Standings vs. Demand
Referring to Fig. 2, we can see that only graduate students and seniors had a greater percentage of “yes” than “no” responses for willing to become tutors. It can also be stated that freshmen, sophomores, and juniors all had about the same percentages for their willingness to become tutors, with a “yes” response of approximately 45%.
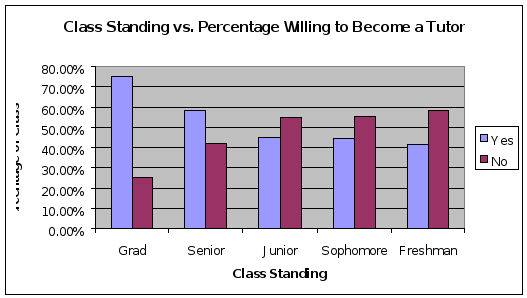
Figure 2: Respondents’ Class Standings vs. Supply
The results obtained from correlating class standing to the demand and supply of a tutoring service generally matched our underlying assumption. That is, a majority of freshmen, sophomores, juniors and graduate students would want a tutor for one or more of their classes. Many classes at the CEAS are challenging, regardless of the grade level, and consequently all class standings realize the benefit of having a tutor to help. This is especially the case for freshmen and sophomores, as they are adjusting to new collegiate demands.
On the other hand, greater majorities of upper-level students, including graduate students and seniors, are willing to become tutors. This was expected because as students advance in their studies, they have a greater knowledge base and are therefore more willing to help out others in their struggle. Overall, this data suggests that APM should focus on advertising to graduate students and seniors to become tutors, while all majors, but specifically underclassmen, should be targeted for tutor offerings.
Analyzing Respondent GPA vs. Demand and Supply
In addition to identifying general supply and demand totals, we chose to correlate these totals by the respondents’ GPA to investigate any trends. Respondent answers to question 4 were plotted against their answers “yes” or “no” to both questions 5 and 6, as shown Fig. 3 and Fig. 4, respectively.
Cumulatively , 88% of respondents fell into the range of GPA’s from 2.51 to 4.0 covering the GPA divisions of 2.51-2.5, 2.51-3.0, and 3.51-4.0. Looking at this range in Fig. 3, we can see a declining trend in yes responses as GPA increases. In the lower end of this range (2.51-3.0), the responses for “yes” of wanting a tutor significantly outweigh responses of “no.” Referencing Fig. 4, we can see that in the higher end of the described range (3.51-4.0), there are more “yes” responses for willing to tutor than “no” responses. Moreover, looking at the extreme 4% of respondents falling in the division of <2.00 GPA, we see that all respondents want a tutor and only 1 out of 4 respondents is willing to become a tutor.
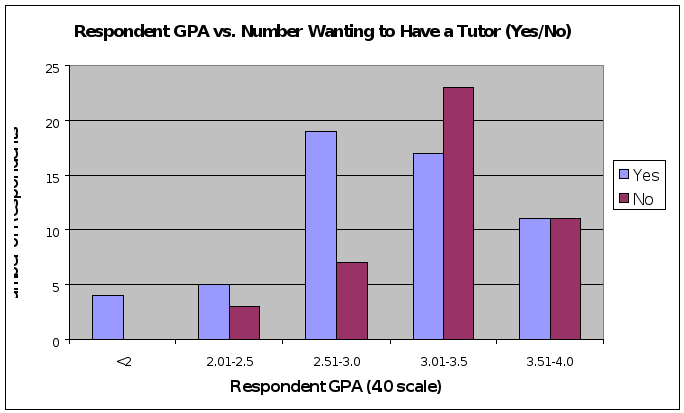
Figure 3: Respondents’ GPAs vs. Demand
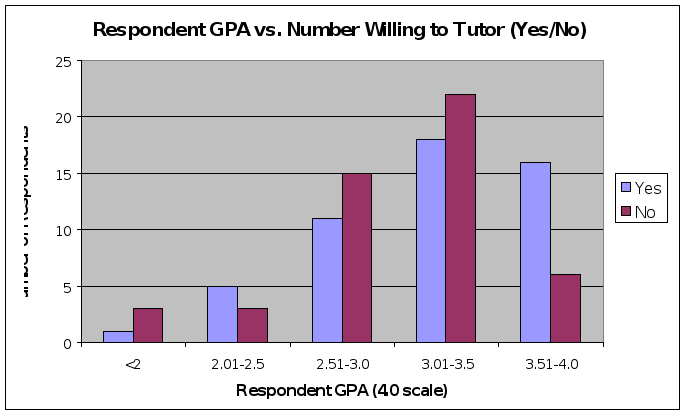
Figure 4: Respondents’ GPAs vs. Supply
Analyzing the graphs, we did find some slight correlations between wanting a tutor and willingness to tutor. In general, those wanting to receive a tutor had lower GPAs than those not wanting a tutor. Similarly, those willing to become tutors had higher GPA scores than those students not interested in becoming tutors. This makes sense, in that students with higher GPAs would be more capable of aiding other students because grades generally reflect performance in classes and knowledge of class topics. Students with lower GPAs, on the other hand, may be struggling in classes and looking for additional help from a tutoring service to boost their grades. Based on these findings, we recommend that APM suggest that teachers inform their students of the tutoring service. Specifically, those students with lower GPAs could be advised to obtain a tutor, and those with higher GPAs could be advised to become tutors.
Considering Wages and Costs of a Tutoring Program
In order to decide how much APM would need to charge each tutee and pay each tutor, questions 5b and 6b were developed on the questionnaire. These questions ask those respondents either wanting a tutor or willing to tutor what the highest cost they would be willing to pay per hour for a tutor and the lowest amount they would be willing to tutor for per hour, respectively.
These responses were tallied by cumulative frequency with the following results. 19 of the 56 respondents (34%) interested in having a tutor would pay less than $7 per hour. 33 respondents (59%) were willing to pay $7-10, 3 (5%) for $11-14, and 1 (2%) for $15-20. Of the 51 respondents willing to become a tutor, 5 (10%) were willing to tutor for less than $7 per hour, 35 (69%) for $7-10, 9 (18%) for $11-14, and 2 (3%) for $15-20.
It can be seen from the data that the majority of respondents felt that both the tutoring wage and cost should be set to $7-10 per hour. However, it should be noted that tutoring fees should exceed tutor wages since APM will be retaining a portion of these fees for fundraising and service scheduling/advertising costs. Given this, we would recommend that APM charge $10 per hour to each tutee and pay each tutor $8.50. This would be equivalent to a 15% profit for APM for each hour of tutoring completed.
Identifying Tutoring Service Locations, Times, and Duration
Given that the supply and demand were great enough to start a tutoring program, it would be important to identify the location, time, and duration of the tutoring sessions. Such questions were included in our survey with questions 7, 8, and 9, respectively. The results are described below.
Overall, we found that for a location, 30% of the 100 respondents wished for the tutoring to take place in a Parkview (CEAS’s) study lounge, followed by a Parkview classroom (25%), the Waldo Library (21%), the Bernhard Center (15%), and Parkview’s computer lab (9%). Cumulatively, nearly two-thirds of respondents wished to have tutoring at Parkview, whereas one-third wanted it to occur on main campus either at the Bernhard Center or at the Waldo Library. If the proper demand and supply exist, it would be beneficial to have tutoring in both locations. The greatest request for a tutoring location was the study lounges at Parkview. However, almost a quarter of students wanted the tutoring to take place in a Parkview classroom, which would call for special arrangements to be made to reserve a classroom. Moreover, tutors and tutees might find that the study lounges are too busy, which would push for a classroom reservation. If the service takes off, then classrooms and availability times should be further considered.
For the tutoring time of day, we found that only 9% wanted the 8am to 12pm time slot, 20% wanted 12pm to 4pm, 43% wanted 4pm to 8pm, and 28% wanted 8pm to 12am. This infers that most respondents want evening or night sessions more so than morning or afternoon sessions. This can probably be linked to the fact that most students work or attend class during the day and are freer in the evenings. Therefore, APM will likely have to schedule more tutoring time slots for evening or night sessions than morning or afternoon sessions.
Lastly, for the length of each tutoring session, most respondents wanted them to last for 1 hour (71%), whereas 17% wanted 1.5-hour sessions, 9% wanted 2-hour sessions, and only 3% wanted half-hour sessions. Given the great number of people who wanted the sessions to last for one-hour, we feel that this should be a standard time for all sessions with circumstantial exceptions.
Conclusions
In conclusion, we, in conjunction with Alpha Pi Mu (APM), were able to appropriately conduct a survey analysis to investigate the initiation of a tutoring service at Western Michigan University’s College of Engineering and Applied Sciences (CEAS). One-hundred surveys were used in the analyses of this report. The most represented majors were mechanical and aeronautical engineering, electrical and computer engineering, civil and construction engineering, and industrial engineering. Seven majors had three or less respondents, which present an inadequate proportion. Similarly, we had hoped to get an even distribution for class standings; however, we only accumulated 30% underclassmen and 70% upperclassmen for the analyses. Of those surveyed, 88% had GPAs which fell into the range of 2.51 to 4.0, with a mode of 3.01 to 3.5 representing a letter grade of B to BA.
Overall, our main investigation goal was to establish the demand and supply for a tutoring program. We found that the percentage of students wanting to have a tutor and the percentage of students willing to tutor were both above 50%, and of those, 88% would use the services at least 4 times per semester. This reveals that there is an adequate demand and supply for the program. Moreover, approximately half of the surveyed majors had a majority of students interested in a tutoring program (both wanting a tutor and willing to tutor). This tells us that there is a large range of majors interested in the tutoring service.
We also found that the majority of freshmen, sophomores, juniors and graduate students want a tutor for one or more of their classes. On the other hand, greater majorities of upper-level students, including graduate students and seniors, are willing to become tutors. In addition, those wanting to receive a tutor had lower GPAs than those not wanting a tutor. Similarly, those willing to become tutors had higher GPA scores than those students not interested in becoming tutors.
We also wanted to investigate the cost, wage, location, time, and duration of tutoring sessions. We found that the majority of respondents felt that both the tutoring wage and cost should be set to $7-10 per hour. Additionally, nearly two-thirds of respondents wished to have tutoring at Parkview (CEAS), whereas one-third wanted it to occur on main campus either at the Bernhard Center or at the Waldo Library. The greatest request for a tutoring location was for the study lounges at Parkview. Respondents also wanted evening or night sessions more so than morning or afternoon sessions. Lastly, 71% of respondents wanted sessions to last for 1 hour.
Recommendations
Based on the data conclusions, we have formed several recommendations for Alpha Pi Mu regarding the initiation of a tutoring service , which are as follows:
Begin a tutoring program, as supported by general supply and demand responses
Extend the services to all majors within CEAS
Target underclassmen as students wanting tutors; whereas, upperclassmen should be targeted for students willing to become tutors
Suggest that teachers inform their students of the tutoring service. Specifically, those students with lower GPAs could be advised to obtain a tutor, and those with higher GPAs could be advised to become tutors
Charge $10 per hour to each tutee and pay each tutor $8.50 to return a 15% profit
Conduct tutoring sessions at both Parkview (CEAS) and main campus. The majority of sessions should be held in Parkview’s study lounges and classrooms, but also consider the Waldo Library and the Bernhard Center for main campus venues
Schedule tutoring session time slots for evening (4pm to 8pm) or night (8pm to 12am) more so than morning (8am to12pm) or afternoon (12pm to 4pm)
Make standard session time one hour.
Although 100 samples were taken to make these recommendations, there were several underlying facts that can skew our results. We found there to be an under representation in several majors as well as in class standings, and therefore suggest more questionnaires be distributed to gather more accurate results. Additionally, many surveys were discarded due to the fact that they gave multiple responses to questionnaire questions 7, 8, and 9. To prevent this in the future, these questions could have a note to instruct respondents to only mark one answer.
Appendix A: Tutoring Program Questionnaire
Please do NOT write your name on this questionnaire. The results of this questionnaire will be used for analysis in a survey project in IME3160, in conjunction with Alpha Pi Mu, to investigate the initiation of a tutoring program at Western Michigan University. Please check the appropriate answer to each question.
1. Gender: Male Female
2. What is your class standing? Freshman Sophomore Junior Senior Grad Student
3. What is your major?
Chemical Engineering Industrial Design
Civil and Construction Engineering Industrial Engineering
Computer Science Manufacturing Engineering
Electrical & Computer Engineering Materials Science & Engineering
Engineering Management Technology Mechanical & Aeronautical Engineering
Imaging Paper Engineering
Other _____________________
4. What is your current GPA? < 2.0 2.01-2.5 2.51-3.0 3.01-3.5 3.51-4.0
5. Would you like to have a tutor for one or more of your classes? Yes No
a. If yes, how many times would you use a tutor each semester?
1-3 4-8 9-12 13-15 >15
b. If yes, what is the highest price you would be willing to pay for a tutor (per hour)?
<$7 $7-$10 $11-14 $15-$19 >$20
6. Would you like to tutor students in classes of your choice? Yes No
a. If yes, how many times would you be willing to tutor each semester?
1-3 4-8 9-12 13-15 >15
b. If yes, what is the lowest price you would be willing to tutor for (per hour)?
<$7 $7-$10 $11-14 $15-$19 >$20
*If you answered yes to either question 5 or 6, then please answer 7 thru 9.
7. Where would you like the tutoring to take place?
Bernhard Center Library
Parkview Computer Lab Parkview Classroom Parkview Study Lounge
8. What time of day would you like tutoring to take place?
8am-12pm 12pm-4pm 4pm-8pm 8pm-12am
9. How long should each tutoring session last?
0.5 hours 1 hour 1.5 hours 2 hours


