Soft Drink Case Study
PepsiCo: Is diversification a choice?
Mohamed Ezz, MD, DM (UMUC)
PepsiCo (PEP)
www.pepsico.com
Overview
PepsiCo, a world leader in beverages, food, and snacks with net revenues of more than $ 65 billion, has a product portfolio of 22 of the most iconic brands in the industry; each of which has annual retail sales of more than one billions dollars. PepsiCo is the world’s # 2 carbonated beverage maker. The company’s brand portfolio includes (PepsiCo, 2016):
A. Beverages: Pepsi, 7-Up, Mountain Dew, Sierra Mist, Mirinda, Gatorade, Tropicana, Lipton, and Aquafina.
B. Snacks: Doritos, Frito-Lay, Tostitos, Ruffles, Cheetos, Fritos, Brisk, and Walkers,
C. Foods: Quaker Oates and Rice-A-Roni.
PepsiCo: History & Background (Hoovers, 2016)
Pepsi was invented in 1898 by pharmacist Caleb Bradham in New Bern, North Carolina. He named his new drink Pepsi-Cola and marketed it as a cure for indigestion and dyspepsia. Bradham followed Coca-Cola’s bottling franchise model and by World War I 300 bottlers had signed up. Following the war, Bradham started stockpiling sugar to safeguard against rising prices; however, in 1920 sugar prices plunged, leading to his bankruptcy in 1923.
After changing ownership for some time, Loft Candy bought the company in 1931. During the Depression (1939), the company doubled the size of its bottles to 12 ounces without raising its price, which helped improve its fortune. In 1939 Pepsi introduced the first radio jingle in the world. In 1941, Loft Candy merged with its Pepsi subsidiary to create the Pepsi Cola Company.
The company acquired Mountain Dew in 1964 and Frito Lay in 1965, and changed its name to PepsiCo. In 1972 PepsiCo began distributing Stolichnaya vodka in the States in return for being the only Western firm allowed to bottle soft drinks in the Soviet Union. PepsiCo bought Pizza Hut (1977), Taco Bell (1978), and KFC (1986) and became a formidable force in the fast food industry. In the period from 1991 - 1996 PepsiCo aggressively expanded its international bottling operations; however, it was no match Coca-Cola's well-oiled international distribution machine. The Company then focused its attention to the organization of its international network.
In 1997, PepsiCo spun off its $10 billion fast-food unit (currently Yum! Brands), which better positioned to sell its soft drinks at other restaurants. Also in 1997 PepsiCo bought Smith snacks and Borden's Cracker Jack snack from United Biscuits. In 1998, PepsiCo bought Seagram's Tropicana juices, the main competitor to Coca Cola’s minute Maid for $3.3 billion. In 1999, the company sold a 65% stake in its new Pepsi Bottling Group in an IPO. .
In 2001, PepsiCo bought the Quaker Oates Company for more than $13 billion, and added the market leader Gatorade sports drink brand to its portfolio The Company then sold its competing All Sport energy drink to The Atlanta-based Monarch Beverage Company.
In 2004 PepsiCo, attempted to create a joint-venture with the Ocean Spray, the juice maker; however, the cranberry farmers who own the company refused. In 2005, PepsiCo then bought General Mill’s stake of their joint venture (Snack Ventures Europe) (SVE) for $750 million creating Europe's largest snack food company.
PepsiCo Organizational Structure
In 2003, PepsiCo started a major restructuring that created four company divisions (Hoovers, 2016):
1. PepsiCo International
2. PepsiCo Beverages North America
3. Frito-Lay North America
4. Quaker Foods North America.
In its quest to become a fully integrated global beverage and food company, PepsiCo announced in 2012 a new organizational structure, where the regions retain P&L responsibility, while its global groups operate across regions to fully leverage the scale and power of the company (PepsiCo, 2012).
PepsiCo: Industries
PepsiCo operates in two industries mainly:
1. Non-alcoholic beverages: Key economic drivers include: Per capita soft drink consumption healthy eating index, per capita disposable income, per capita sugar and sweetener consumption, and price of corn. Producers are expected to refresh their product lines to decelerate falling demand (Ibis World, 2016).
2. Snacks: Key economic drivers include: Per capita disposable income, healthy eating index, and price of corn. More innovative flavors and healthier foods will boost industry growth (Ibis World, 2016).
Snack food producers also compete with substitute snacks such as cookies, crackers and granola bars. Also, healthier brand extensions of regular crackers and cookies, including organic and reduced-fat varieties, have boosted demand for snacks. In addition, increased snacking in the morning has led consumers to snack on more granola bars and cereal (Ibis World, 2016).
PepsiCo: Competition
Non-alcoholic beverages
Table 1: PepsiCo: Competition
| 2015 Key Figures | PepsiCo | Coca Cola | Mondelez International | Dr Pepper Snapple Group |
| Annual Sales | $63.06B | $44.29B | $29.64B | $6.28B |
| Employees | 263,000 | 123,200 | 99,000 | 19,000 |
| Market Cap | $145.58B | $185.76B | $70.85B | $17.51B |
Source: Hoover (2016)
Table 2: PepsiCo Competitors’ financial performance
| 2015 Profitability | PepsiCo | Coca Cola | Mondelez International | Dr Pepper Snapple Group | Industry Median | Market Median |
| Gross Profit Margin | 55.20% | 60.22% | 39.20% | 59.50% | 35.28% | 39.35% |
| Pre-Tax Profit Margin | 11.53% | 20.38% | 28.02% | 19.33% | 0.06% | 6.76% |
| Net Profit Margin | 8.23% | 16.59% | 26.46% | 12.49% | 3.60% | 5.68% |
| Return on Equity | 38.27% | 27.08% | 28.66% | 36.50% | 0.38% | 5.93% |
| Return on Assets | 7.39% | 7.98% | 11.70% | 9.50% | 0.05% | 1.85% |
Source: Hoover (2016)
Cola wars: There is a never-ending war for the domination of the global carbonated beverage markets, between PepsiCo and Coca Cola, as well as Dr Pepper Snapple (DPS) and a host of other smaller rivals. The continuing decrease in per-capita consumption of soda and falling profits have forced the beverage companies to increasingly depend on their other business lines; especially the snacks industry. However, that change has not been easy (CBS News, 2015).
When Coca-Cola changed its Coke formula in 1985, Pepsi had a short-lived triumph in the cola wars, until Coca Cola reintroduced the Coca-Cola classic, after the new formula proved to be a failure. In 1991, the rivalry between the two companies was extended to ready-to-drink tea. As a response to Coca-Cola's Nestea venture with Nestle’, PepsiCo joined forces with Lipton (Hoovers, 2016)).
Coca-Cola shares have risen about 12% in 2014; while PepsiCo’s share rose 25%, the company being more diversified. Dr. Pepper Snapple Group’s shares surged more than 62% as all its operations are in North America and had no currency exposure. S&Ps forecasts a continued decline in the carbonated beverage business as consumers seek healthier alternatives (CBS News, 2015).
B. Snacks
Kraft Heinz Company
In July 2015 Kraft joined Heinz to create The Kraft Heinz Company, the world’s fifth largest food and beverages company (and third in North America) with combined revenues of $ 29 billion. The company’s portfolio includes (Hoovers, 2016):
1. Kraft natural and processed cheeses.
2. Beverages (Maxwell House coffee and Kool-Aid drinks)
3. Convenient meals (Oscar Mayer meats, Lunchables, and Kraft mac 'n cheese)
4. Grocery fare (Cool Whip topping, Velveeta, and Shake N' Bake coatings)
5. Nuts (Planters).
6. Ketchup line (Heinz).
PepsiCo: Advertising
In 2015, PepsiCo’s advertising expenses amounted to $ 2.4 billion (Statista, 2016).
Pepsi realized that being interrupted by ads can be annoying. Accordingly, the company’s newest 2016 ad campaign involves five-second ad for its new emoji-clad soda bottles. The ads will roll out all summer on TV and online. The campaign is an attempted by PepsiCo to slow down the consumer trend of moving towards healthier non-sugary options. PepsiCo is betting that the less disruptive advertising and the emojis will lure its consumers in, as they appeal to most people (USA Today, 2016).
PepsiCo is planning to market the more than 70 globally and locally specially designed emoji bottles and cans in more than 100 global markets this year (including the U.S.), drastically expanding a campaign that started last year in Canada, Thailand, and Russia, Canada and Thailand (Advertising Age, 2016)
PepsiCo Financials
Products and Operations (Hoovers, 2016)
Table 3: Country-wise sales 2013-2014
| Country | $ million | % of total | $ million | % of total |
| 2013 Sales | 2014 Sales | |||
| US | 33,626 | 50 | 34,219 | 51 |
| Russia | 4,908 | 4,414 | ||
| Mexico | 4,347 | 4,113 | ||
| Canada | 3,195 | 3,022 | ||
| UK | 2,115 | 2,174 | ||
| Brazil | 1,835 | 1,790 | ||
| Other | 16,389 | 25 | 16,951 | 25 |
| Total | 66,415 | 100 | 66,683 | 100 |
Table 4: Product-wise sales 2014
| 2015 Sales | ||
| $ million | % of total | |
| PepsiCo Americas Beverages | 21,154 | 31 |
| Frito-Lay North America | 14,502 | 22 |
| Europe | 13,290 | 20 |
| Latin America Foods | 8,442 | 13 |
| Asia, Middle East & Africa | 6,727 | 10 |
| Quaker Foods North America | 2,568 | |
| Total | 66,683 | 100 |
Table 5 In-depth earnings estimates (Hoovers, 2016)
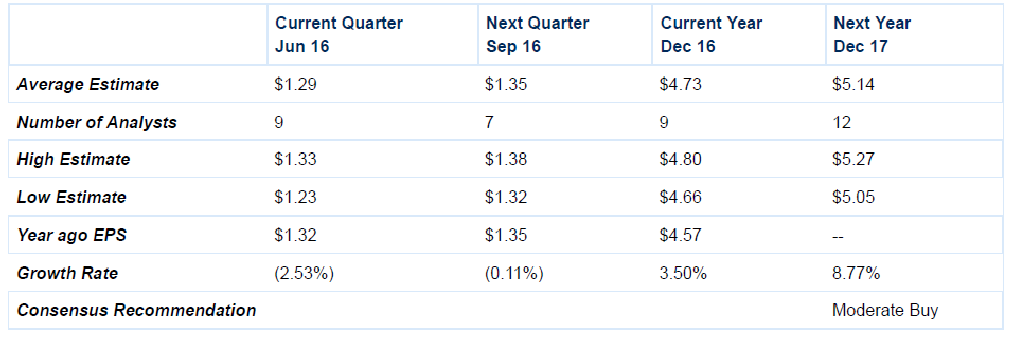
Table 6: Earnings estimates and forecast (Hoover, 2016)
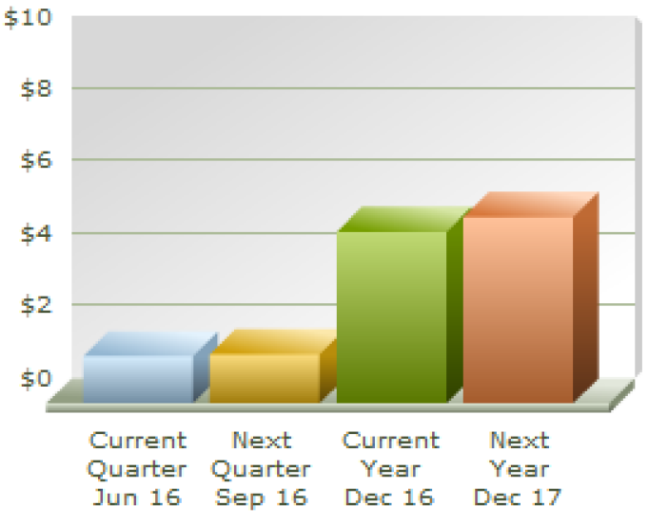
Table 7: Basic Financial Information (PepsiCo, 2016)
| PepsiCo: Basic Financial Information (PepsiCo, 2016) | |
| Sales (2015) | $ 63 billion |
| Sales Growth (vs. 2014) | 5.4% |
| Net Income (2015) | $ 5.5 billion |
| Net Income Growth (vs. 2014) | 16.3% |
Table 8: PepsiCo Annual Data (Yahoo! Finance, 2016) All numbers in thousands
| ||||||||||||||||||||||||||||||||||||||||||||||||||||||||||||||||||||||||||||||||||||||||||||||||||||||||||||||||||||||||||||||||||||||||||||||||||||||||||||||||||||||||||||||||||||||||||||||||||||||||||||||||||||||||||||||||||||||||||||||||||||||||||||||||||||||||||
References
Advertising Age (2016). Pepsi preps global emoji can and bottle campaign. Retrieved on May 9th from http://adage.com/article/cmo-strategy/pepsi-preps-global-emoji-bottle-campaign/302748/
CBS News (2015). Coke, Pepsi and the new front in the cola wars. Retrieved on May 9th from http://www.cbsnews.com/news/coke-pepsi-and-the-new-front-in-the-cola-wars/
Hoovers (2016). Kraft Heinz Company. Retrieved from www.hoovers.com
Hoovers (2016). PepsiCo. Retrieved from www.hoovers.com
Ibis World (2016). Ibis industry report: Snack food production in the U.S. Retrieved on May 10th from www.ibisworld.com
PepsiCo (2016). Annual reports and proxy information. Retrieved on May 9th from http://www.pepsico.com/Investors/Annual-Reports-and-Proxy-Information
PepsiCo (2016). Brand explorer. Retrieved on May 9th from http://www.pepsico.com/Brands/BrandExplorer
PepsiCo (2012). PepsiCo announces new global structure and leadership to drive continued growth. Retrieved on May 9th from http://www.prnewswire.com/news-releases/pepsico-announces-new-global-structure-and-leadership-to-drive-continued-growth-142287945.html
Statista (2016). PepsiCo's advertising expenses worldwide. Retrieved on May 9th from http://www.statista.com/statistics/286547/pepsico-advertising-spending-worldwide/
USA Today (2016). Pepsi goes for brevity with five-second ads for emoji bottles. Retrieved on May 9th from http://www.usatoday.com/story/money/2016/04/25/pepsi-emoji-ad-campaign-5-second-ads/83494216/
Yahoo! Finance (2016). PepsiCo Income Statement. Retrieved on May 9th from https://finance.yahoo.com/q/is?s=PEP&annual
6


