Financial Accounting
BAFI1042-Investment
Assignment 1 – Due on 1st of May 2015
Student Names: Faustine Adi Susanto (s3413722)
Kim Ho Yeon (s3504669)
Lee Shi Yau (s3474122)
Sheillapatricia( s3439145)
Van Nguyen Xuan Hoang (s3245838)

Market Research
Date
1 May 2015
Forecast Change:
Company
Crown Resorts Limited
ASX Yahoo!Finance Bloomberg
CWN.AU CWN.AX CWN:ASE
Rating
Sell
Executive Summary
The purpose of this paper is to present the equity valuation analysis of Crown Resorts Limited thorough examine the company’s financial performance and its competitiveness level under a Porter Five Forces framework. From Markowitz’s concepts, Capital Asset Pricing Model (CAPM), the valuation of Crown Resorts Limited will be assessed together with distinct valuation models.
This report has been divided into three main parts: Financial Performance and Current issues, Valuation Models and evaluation of Crown Resorts Limited’s price.
Supporting of the analysis of data gathered and financial statements, the intrinsic current value of Crown Resort Limited securities trading at ASX will be estimated to provide the potential investors advice regarding their investment position on Crown Resort Limited securities.
This report explains about Crown in detail about analyzing and identifying the industry as well as its major competitors in the market. Our group has been used some techniques to understand the value of Crown in order to estimate the share price. The models that we calculated include CAPM, DDM and FCFE.
According to the valuation models of DDM we have estimated that the share price is currently underpriced whereas using the FCFE models the share price is trading at overvalued price. Therefore, we believe to use DDM model to estimate the future price as it gives more accurate valuation.
2
Executive Summary 3
Table of Content 5
Introduction 6
Recent history 7
Financial Performance of Crown Resorts 8
Peer Group Analysis for Crown Resorts and its competitors (Echo Entertainment & Sky City Entertainment 10
DuPont and Peer Group Analysis Comparison 12
Macroeconomic factors 16
Microeconomic factors 18
Capital asset pricing model (CAPM) 20
Market Return and Risk Premium 22
Market risk premium 23
Dividend Discounted Model 23
Sensitivity Analysis 27
Free Cash Flow to Equity (FCFE) 28
Valuation 34
Appendix 35
References: 78
PRASHANT MEHRA, (2015).UBS cuts Crown price target as Macau downturn bites. 79
JP Morgan, (2015). Crown’s VIP strength ‘positive surprise. 79
Emily Stewart, (2015). James Packer's Melco Crown Macau joint venture faces structural decline: analysts. 79
Multi-stage Dividend Discount Models, (2015) 80
Executive Summary 3
Table of Content 4
Introduction 5
Recent history 6
Financial Performance of Crown Resorts 7
Peer Group Analysis for Crown Resorts and its competitors (Echo Entertainment & Sky City Entertainment 9
DuPont and Peer Group Analysis Comparison 10
Macroeconomic factors 14
Microeconomic factors 16
Capital asset pricing model (CAPM) 18
Market Return and Risk Premium 20
Market risk premium 21
Dividend Discounted Model 21
Sensitivity Analysis 24
Free Cash Flow to Equity (FCFE) 25
Valuation 30
Appendix 31
References: 62
PRASHANT MEHRA, (2015).UBS cuts Crown price target as Macau downturn bites. 63
JP Morgan, (2015). Crown’s VIP strength ‘positive surprise. 63
Emily Stewart, (2015). James Packer's Melco Crown Macau joint venture faces structural decline: analysts. 63
Multi-stage Dividend Discount Models, (2015) 63
Introduction
Publically listed in the ASX in 2007, Crown Resort is one of the largest companies in the entertainment sector which focuses mainly on the casino and gaming, and hospitality (hotels and resorts) world widely. Crown has operated the business in some overseas countries such as Crown in Macau (Melco Crown Entertainment Limited) and London (Crown Aspin all’s) to expand its market as well as to attract more number of visitors and customers to Crown over years. In Australia, there are two company of Crown which located in Melbourne and Perth. The head quarter is based on the Crown Casino Melbourne Entertainment Complex.
Recent history
Crow is one of Australia’s largest entertainment groups. Its core businesses and investments are primary from resorts sector. It has two leading integrated resorts in Australia, Crown Melbourne Entertainment Complex and Crow Perth Entertainment Complex.
Crown Melbourne:
It is one of the biggest resorts in southern hemisphere comprising a casino, hotels, function rooms, restaurants, and shopping center and entertainment facilities. It received the prestigious Australian Employer of the Year at the Australian Training Awards in 2013 and Victorian Employer of the Year by the Victorian Government afterward. Also, in 2014 receiving award the 2014 casino/ Integrated Resort of the Year at the prestigious International Gaming Awards (IGA) in London. Based on the outstanding performance in the industry, Crown Melbourne targets to attract both Australian and International visitors.
Crown Perth:
It is a premier resort including a casino, two international hotels, the art convention center, and award-winning food and beverage outlets. Due to its unique position as the only venue in Western Australia offers electronic gaming and table games. Besides, it is constructing a six-star hotel to extensive its offering in terms of hotels, restaurants.
Based on ACIL Allen Consulting estimation, Crown Melbourne contributed about $3.1 billion and Crown Perth contributed around $1.4 billion to Australian real GDP. Auditing firm KPMG, claimed that in 2012 the yearly value-added associated with the capital expenditure and operations was approximately $2.1 billion (Crown Melbourne) and $800 million (Crown Perth). There are over 14000 employees in both resorts which lead to the largest single-site employers in Victoria and Western Australia, respectively.
Financial Performance of Crown Resorts
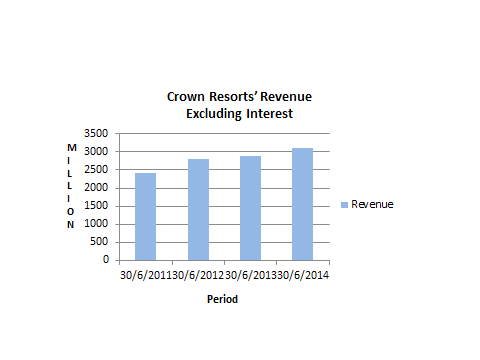
Figure 1: Crown Resorts’ Total Revenue Excluding Interest
Source from: CWN Australian Stock Exchange Ltd
As seen figure 1, it clearly shows that the revenues of Crown Resorts have been on a constant increase for the past few years. For the year ending of 2014, Crown Resorts Limited has growth revenues from $2.9 AUD to $3.1 AUD. According to the Crown Australian Stock Exchange Ltd, the company has also impressively reduce the percentage of sales devoted to cost of goods sold from 79.43% to 77.08%. Hence, this has led to a bottom line growth from $395.8 AUD to $655.8 AUD.
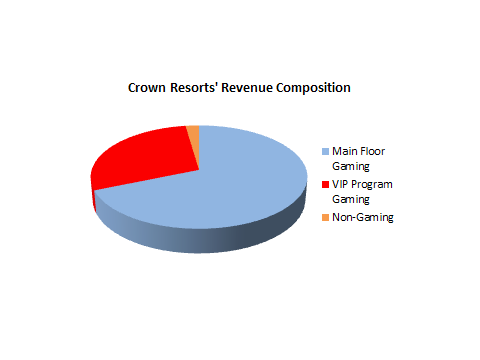
Figure 2: Crown Resorts’ Revenue Composition 2014
Source from: Crown Resort Limited 2014 Full Year Results Presentation Slides
The three main components of Crown Resort’s revenue are namely main floor gaming, VIP program gaming, as well as non-gaming which consists of revenue from services such as dining, hotel, spa, and bars.
Firstly, main floor gaming revenue was $1,507.7 million, which increased by 1.4% more and the non-gaming revenue was $634.8 million, also an increase of 4.5% on the prior comparable period (PCP). However, the results of VIP program gaming has dropped by 1.5% which was $49.9 million on the PCP. Fortunately, the overall results for the year were still satisfactory as the overall operating margin increased 0.2% to 28.5% and the actual net profit after significant items was $655.8 million, which was up by 66% on the previous year.
The annual report of Crown Resorts 2014 shows that, the normalised EBITDA from Crown Melbourne was $561.8 million, and the reported EBITDA was $593.3 million which saw an increase of 8.4% on the PCP. This reflects a win rate of 1.46%, which higher than the theoretical win rate of 1.35%, and generated a positive EBITDA variance of $31.5 million. This is equivalent to a win rate of 1.36% in the PCP which resulted in a positive EBITDA variance of $0.4 million.
As for Crown Perth, the normalised EBITDA was $241.6 million, and the reported EBITDA for the period was $315.7 million, up by 31.1% on the PCP. This reflects a win rate of 2.21%, which much higher than theoretical win rate of 1.35%, and generated a positive EBITDA variance of $74.1 million.
During the year of 2014, Crown received dividends of $94.4 million from MCE, of which $68.6 million was from the 2013 special dividend and $25.8 million for the quarter ending 31 March 2014. For the quarter ending 30 June 2014, MCE has announced the payment of a dividend of which Crown’s share will be US$14.5 million.
Source: Crown Resorts Annual Reports 2011 -2014
Peer Group Analysis for Crown Resorts and its competitors (Echo Entertainment & Sky City Entertainment
Crown Resorts
Crown Resorts owns and operates two of Australia's leading gaming and entertainment complexes. In order to ensure for future growth, a portfolio is provided by Crown that has been accumulated to complement existing core businesses. According to Crown’s annual report, the result in comparison to the prior period has been impacted by a decrease in the VIP program play win rate which also means that the current period also included a mark-to-market loss on the company's investment in Echo Entertainment Group. This was partially offset by improved Australian casino operations results.
Echo entertainment group (EGP)
Echo Entertainment group trades in terms of hotels and casino complexes, The Star Sydney, Jupiter’s Hotel & Casino on the Gold Coast, Treasury Casino & Hotel in Brisbane and Jupiter’s Townsville. Additionally, it manages the Gold Coast Convention and Exhibition Centre on behalf of the Queensland Government, The Townsville Entertainment and Convention Centre, too.
Recently, there is an amount of money $870 million transferred from The Star as an intangible reflection of new company’s capacity and capability to invest in its properties. That contribution is great of importance for the gross revenue growth 6.8% in financial year 2014 as increasing Australia’s lucrative international VIP in business market.
During 2014, The Star’s performance was improved with revenue of $1,277.3 million, up 6.2% compare to previous year. It has achieved EBIT of $170.2 million, increases 9.1% of last year.
Queensland has generated EBIT of $43.6 million, decreases 4.0% of last year. While its gross revenue went up by 1.1% to $283.6 million.
Sky city Entertainment Group Limited (SKC)
Sky City Entertainment Group Limited is one of leading entertainment and gaming business and considered as an iconic status in New Zealand and in Australia. Since the first casino was opened in Auckland in 1996, SKC determined to serve a good return for its shareholders and to corporate well in community.
Redevelopment of Adelaide Casino was significantly affected on the revenue, declined 27.4% to $AUD13.5 million (EBITDA). Because it reduced the visitation in disruption period higher costs associated when launching new games and facilities, increasing in marketing expenditure and labour costs over the period. Besides, SKC transformed Adelaide Casino into a world-class integrated Casino and entertainment destination.
DuPont and Peer Group Analysis Comparison
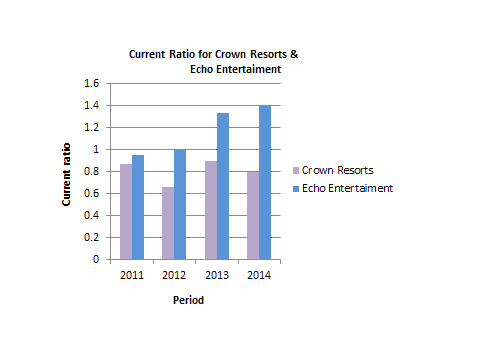
Figure 3: Current Ratio for Crown Resorts & Echo Entertainment
Crown Resorts current ratio indicates that it has a weaker ability to meet its financial obligations as compared to Echo Entertainment, its closest competitor.
Crown Resorts’ current ratio fluctuates between 0.6, to 1 over the past 4 years. While Echo Entertainment’s current ratio observes a steady increase from less than 1 in 2011 to 1.4 in 2014.
It is generally accepted that business should have a current ratio of greater than 2 in order to have enough assets to cover its liabilities (Accounting-simplified.com, 2014). However, Echo Entertainment has demonstrated that the company has been able to operate well with a current ratio below 1.5 and similarly for Crown Resorts with a current ratio below 1 over the previous 4 years. This indicates that Crown Resorts is more effective in its investment in current assets to generate a higher net income each year.
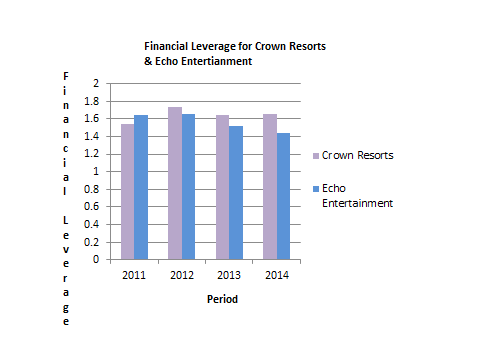
Figure 4: Financial Leverage for Crown Resorts & Echo Entertainment
The financial leverage multiplier is the amount of debt which a firm uses to finance its asset, basically showing the overall financial risk or capital structure. What this means it that a firm with a higher amount of debt than equity is considered to be highly leveraged.
Crown Resorts latest figure shows their financial leverage ratio to be at 1.65 as compared to Echo Entertainment’s 1.45, a difference of 0.2. Since 2012, Echo Entertainment’s financial leverage multiplier shows to be consistently lower than of Crown Resorts. This translates to Crown Resorts having a higher portion in debt of their total assets, in contrast to Echo Entertainment who has a larger portion of equity over total assets.
As observed from the graph, Crown Resorts has had a stable financial leverage for 3 years since 2012. This is favourable for Crown Resorts as investors would not usually wish to see a company change their leverage by a large margin between periods.
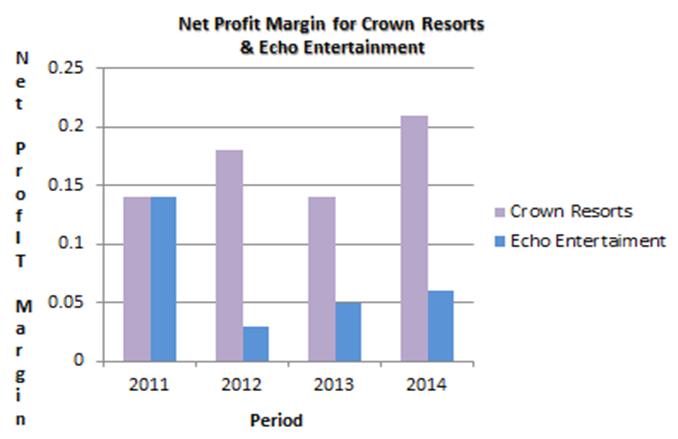
Figure 5: Net Profit Margin for Crown Resorts & Echo Entertainment
The net profit margin is essentially a measure of how much out of every dollar of sale a company actually retains in earnings. As seen in the graph above, Crown Resorts and Echo Entertainment has the same net profit margin in year 2011. However, from 2012 to 2014, Crown Resorts net profit margin is significantly higher than Echo Entertainment. What this means for Crown Resorts is that they have been more profitable than Echo Entertainment and have better control over its costs. The fall in net profit margin for Echo Entertainment can be attributed to the high operating expenses associated with the opening phase of The Star.
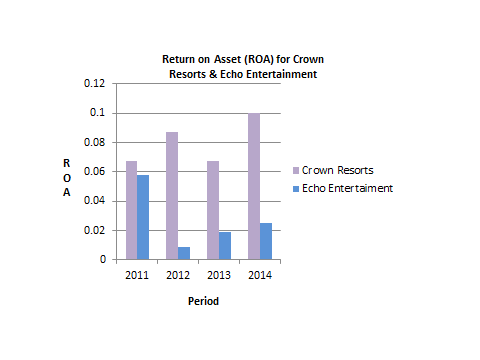
Figure 6: Return on Asset for Crown Resorts & Echo Entertainment
Crown Resorts has demonstrated that it is more effective in managing its assets to generate sales revenue over the previous six years. Echo Entertainment’s ROA is significantly lower than Crown Resorts’, indicating that it may be experiencing internal efficiency issues. Crown Resorts increase in ROA over the past 4 years signifies an expected increase in profitability. The large fall in ROA for Echo Entertainment can be attributed to the high operating expenses on new assets associated with the opening phase of The Star.
Macroeconomic factors
The changes in macroeconomic significantly influence on the volatility of business’ performance. Major economists believe that there numerous effect of macroeconomic factors on the operation of businesses, however in this report, mainly focuses on the impact of some factors: relative interest rate, relative inflation rates, and growth of GDP and movement of global economy.
1. Inflation rate
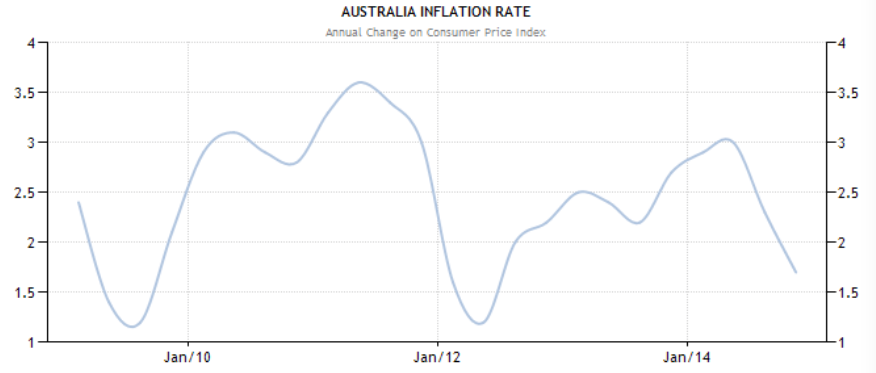
Figure 7: Australia inflation rate (Trading economics 2015)
The inflation rate in Australia has been dropped to the trough at 1.2% in the last quarter of 2009. However, its rate climbed up rapidly and hit the peak at 3.6% in September 2010. After that, the trend declined to the trough as the same as last quarter 2009 and up to now the rate was fluctuated and kept at 1.6% in 2014.
Average of inflation is around 2.5% at the end 2014, which is the range of medium-term price stability of Reserve Bank and the Government between 2 and 3 per cent, over the cycle (RBA, 2013). This rate is also plausible to the target of monetary policy because it keeps the economic performance at the stable level and avoids the interaction with tax system, uncertainty circumstances (price and wages), and distributional effects (erosion of the real value of money), RBA (2013) stating.
2. Interest rate and Government regulation
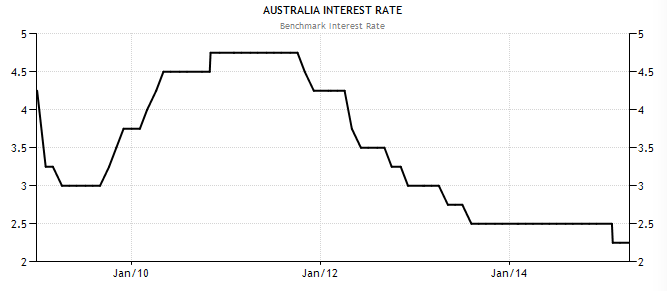
Figure 8: Australia interest rate (Trading economics 2015)
Keri, P (2015) claimed that Australia was one of the few nations where the interest rate climbed between 2009 and 2013; however, the RBA has been in charge of monetary policy by cutting rate and reducing the cost of borrowing to the low of 2.25 per cent in 2014. Most economists think that it is better to keep the interest rate at 3% to maintain the unemployment from rising because at 2.25 per cent it is likely to raise unemployment rate (Keri, P 2015).
In fact, lowering the interest rate so that banks can refinance and RBA can bring down the cost of consumer, housing and business credit. Additionally, some types of mortgage rates could be reduced to the lowest level in recent 50 years (Mark, M 2015 claims).
3. GDP growth rate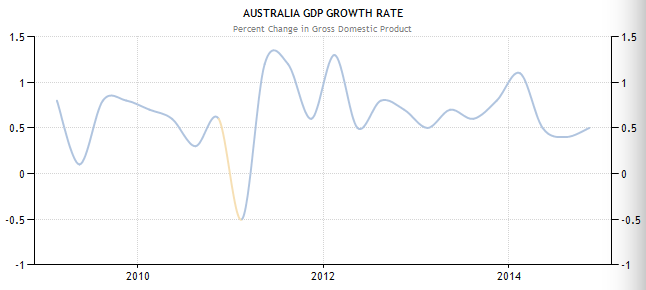
Figure 9: Australia GDP growth rate (Trading economics 2015)
The growth rate declined slightly from 0.8% in 2009 to 0.5% in 2014, but it dropped dramatically and reached at the trough of -0.5% in 2011. Over 20 years Australian economy suffers the worst GDP, thanks to the natural disaster, cyclones in Queensland and Western Australia in late December 2010, reported by The Telegraph news. There was a slump 6.1 percentage in mining production in March quarter, 2.4 per cent in manufacturing and 8.9 per cent in agricultural output.
4. Other factors
Crown owns and operating hotels and casinos therefore it is reliable on the number of tourists coming into Australia. This means there are factors will impact on the number of tourists flowing into Australia. The first reason is the fluctuation in foreign exchange market, for example if the AUD depreciates so the more tourists will come to Australia to take advantage of the higher currency conversion rate. Also, it could be a reason for the import and export companies to change the amount of import and export.
Microeconomic factors
Although the net income of Crown Resorts have been increasing throughout the years, however, Crown is still experiencing structural and cyclical challenges this is mainly due to the weak consumer sentiment which has adversely impacted on its trading and causes Crown Resorts to face the issue.
Taxation ‘Super Tax’
If Crown does not win a reduced VIP tax rate, the Melbourne venue will be 'trying to compete with one hand tied behind its back' said the chief executive of James Packer's Crown Resorts.
Crown Resorts has been for a long period at a major competitive disadvantage on the issue of taxation. Crown Resorts is required to pay a huge amount of tax called ‘super tax’ for the government. It is subjected to a super tax of 1 percentage per each $20 million of gaming revenue from regular players or even up to a maximum of 12.25 percentages from VIP players.
In Countries like Macau, Singapore as well as NSW, the VIP revenue is taxed at a flat rate, however, Crown's Victorian VIP revenue is taxed progressively. Its effective rate of tax is 14 per cent, but can rise to 22 per cent in line with increasing revenue. A lower tax rate means VIP business is more profitable, which means casinos can spend more on inducements and marketing. To Crown Resorts this is an uneven tax regime which becomes of their major factor in Crown's VIP slide.
Capital asset pricing model (CAPM)
In order to forecast CWN’s share price value, CAPM model has been selected. This model allows investors to evaluate the risk – return trade-off for both diversified portfolios and individual securities (Reilly & Brown, 2012, p.216). In this model, the main components that will help to evaluate the risk – return will be the risk free rate, market return, market risk premium and Beta)
Risk free rate
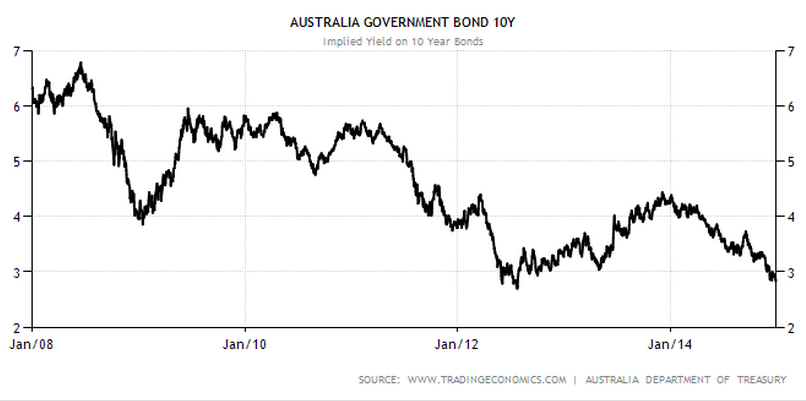
Figure 10: Australia Government Bond
In theoretical, risk free rate mean zero risk. However, this will never happen in reality as every investment have a different level of risk; it could be high or low but never be zero.
In this case, we will use 10 years government bond as our risk free rate of return for our CAPM model as the Treasury bonds are often concerns as a risk-free assets as the default return from government is considerably low. In this case, the yield for government 10 years bond is 2.873% as of the 28 December 2014 (Investing.com, 2015).
Beta coefficient
The Beta coefficient of security is the systematic risk, defined as the variability in all risky assets caused by macroeconomic variables, remains in Portfolio Market (Reilly & Brown, 2012 pg. 212). The beta coefficient is calculated by the regression analysis from the data percentage changed of share price from crown resort against the percentage changed of price index from S&P/ASX 200.

Figure 11: Regression Analysis for CWN vs INDEX 200 ASX
The raw beta has been calculated from figure 2 is 0.87 (Full calculation shown on Appendix 1)
And Adjusted Beta is calculated by the formula:
| Adjusted Beta = Raw beta(0.67) + 1(0.33) |
= 0.87 (0.67) + 1(0.33)
= 0.91
Market Return and Risk Premium
Market Return
The market return is calculated based on the analysis on the GDP annual growth rate of Australia.
| Economic Outlook based on GDP | Rm | Weight | E(Rm) = Pm x Rm |
| Very Strong (>5%) | 25% | 10% | 2.500% |
| Strong (2 - 5%) | 15% | 30% | 4.500% |
| Weak (1 - 2%) | 5% | 50% | 2.500% |
| Very Weak (1%) | -5% | 10% | -0.500% |
Table 1: Economic Outlook Calculation Group Developed Index
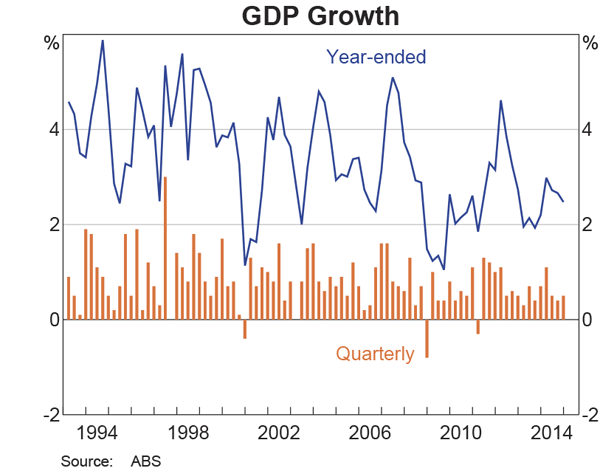
Figure 12:GDP Growth
Based on the GDP growth of Australia in 2014 which is about 2.5%, the economic outlook is strong. Therefore the E(Rm) = 4.5%
Market risk premiumMarket risk premium can be calculated by subtracting the risk free rate from the expected market return, which is equal to 1.627%
CAPM calculation
E(Ri) = RFR + βi (Rm – Rf)
= 0.02873 + 0.91 (0.045 – 0.02873)
= 0.0435357 ≈ 4.35%
Dividend Discounted Model
The Dividend Discount model is used to value the price of a stock by assuming predicted dividends and discounting them back to present value. In order to get valid result, the required return on equity must be greater than growth rate and the growth is at constant rate. The dividend is calculated in the future so that we can estimate whether the stock price is undervalued or overvalued and decide to buy or sell.
There are two methods that can be used to calculate the DDM which based on different stocks. Both methods can be used to evaluate stock of the company. The methods are:
Constant Growth Rate
![]()
![]()
The assumption of the model is that the dividend grow at constant rate for infinite period and the growth rate cannot be equal or higher the required rate of return.
Multistage Dividend Discount Model
![]()
The second model is attempting any number of patterns of future streams of predicted dividend. These can be caused by the change in growth rate based on the company’s condition and economic trends.
Estimate Dividend Growth
In the Dividend model, the growth is an important factor in determining the share price or stock in company regardless the growth is constant or not. The growth rate can be calculated by multiplying the Retention Rate (RR) and Return of Equity (ROE) where Retention Rate (RR) = 1-Dividend Payout Ratio.
Where Payout Ratio = Dividend / Net Income
According to Crown’s annual report, the growth is on the table below.
| Year | 2011 | 2012 | 2013 | 2014 |
| Growth | 1.7020% | 7.6483% | 5.0738% | 10.4665% |
| ROE | 10.34% | 16.28% | 11.25% | 16.98% |
| RR | 16.46% | 46.98% | 45.10% | 61.64% |
| Payout Ratio | 83.54% | 53.02% | 54.90% | 38.36% |
Table 2: Growth Rate of Crown Resorts
The growth tend to increase in the past years and the current growth is 10.47% where the required return is lower than growth rate therefore we will apply the multistage growth rate.
We forecast the future dividend based on some source, history data and analysis for past few years but this is only assumption which cannot be a reliable true.
Increase Asian casino market growth
Expansion in Australian
New dividend income
Attractive value
Leading position in Australia
| Phase 1 | Phase 2 | Phase 3 |
| Slow – Moderate Growth Stage | High Growth Stage | Constant Growth Stage |
| 2016-2017 | 2018-2019 | 2020 onwards |
| Dividend Growth Rate 6% | Dividend Growth Rate 10% | Dividend Growth Rate 3% |
| Economy is at the end of the recovery stage and the growth start to increase | Economy is at expansion stage which the growth is increasing and possibly reach peak | Economy is at stable condition |
Table 3: Forecasting growth rate of DDM
Intrinsic Share Price
Based on the ASX (2015), the current share price for Crown Resort is $13.460 as of April 21st 2015. The table above are what we have estimated growth in future. We used multistage dividend growth because our growth rate in the past is not stable and the growth exceeds the required rate of return which calculated in CAPM. Crown resort’s share price should be $16.705 based on what we calculated in forecasting the future price. Therefore, we believe that we should buy the stocks since the stock is trading at undervalued price. If the assumption and calculation in table below is reliant, the Crown is trading at 124.3% of discount rate.
| Actual | Forecast | |||||
| Time Period | 0 | 1 | 2 | 3 | 4 | 5 |
| Estimate Growth | 6% | 6% | 10% | 10% | 3% | |
| Dividend | 0.19 | 0.2014 | 0.2135 | 0.2349 | 0.2584 | 0.2713 |
| Required return | 4.35% | 4.35% | 4.35% | 4.35% | 4.35% | 4.35% |
| Discount Factor | 1 | 0.958313368 | 0.918364512 | 0.880080989 | 0.8433934 | 0.8082351 |
| Discount DPS | 0.1930 | 0.1961 | 0.2067 | 0.2179 | 0.2193 | |
| Perpetuity / | 20.6992 | |||||
| NPV | 16.7298 | |||||
Table 4: Intrinsic share price
Sensitivity Analysis
Figure 17: Sensitivity analysis based on Required
| Market Risk Premium (%) | |||||
| Beta | 1.427 | 1.527 | 1.627 | 1.727 | 1.827 |
| 0.71 | 25.97 | 22.95 | 19.42 | 18.01 | 17.56 |
| 0.81 | 23.86 | 20.87 | 17.85 | 16.97 | 15.67 |
| 0.91 | 21.20 | 18.90 | 16.73 | 15.05 | 13.74 |
| 1.01 | 20.96 | 15.72 | 15.21 | 14.55 | 12.56 |
| 1.11 | 17.64 | 13.75 | 14.72 | 13.90 | 10.97 |
Figure18:Based on Estimated Growth Rate
| Phase 1 ( %) | |||||
| Phase 2 (%) | 4% | 5% | 6% | 7% | 8% |
| 8% | 13.9032 | 14.9854 | 15.8470 | 16.4297 | 17.2964 |
| 9% | 14.2065 | 15.2829 | 16.2883 | 17.3072 | 18.6520 |
| 10% | 14.6750 | 15.7242 | 16.7298 | 17.9285 | 19.0521 |
| 11% | 15.3402 | 15.9052 | 17.1716 | 18.4107 | 19.6207 |
| 12% | 16.1507 | 16.4974 | 17.6132 | 19.0142 | 20.0518 |
The Sensitivity Analysis shows the inverse relationship between the intrinsic value of company while assuming constant growth and the required rate of return. As it can be seen on table above, as the beta or market risk premium goes down, the intrinsic price of the company in this model will increase and vice versa. The next table shows the intrinsic value of phase 1 and phase 2 of assumption on the dividend growth rate. When the dividend growth rate decreases, the intrinsic share value would increase and vice versa.
Free Cash Flow to Equity (FCFE)
Free Cash Flow to Equity is a measurement of the cash that can be paid to the shareholder in a company after it pays all the expenses and debt repayments. Analysts often use FCFE in an attempt to determine the value of the company.
| Year | 2010 | 2011 | 2012 | 2013 | 2014 |
| Net Income | 292.000 | 336.000 | 513.000 | 396.000 | 656.000 |
| Depreciation Expenses | 144.137 | 175.567 | 200.576 | 220.909 | 227.706 |
| Capital Expenditure | 333.325 | 356.745 | 489.889 | 280.879 | 414.125 |
| Current Asset | 374.143 | 350.422 | 381.967 | 494.653 | 563.523 |
| Current Liabilities | 573.956 | 401.859 | 579.604 | 551.88 | 708.553 |
| Working Capital | -199.813 | -51.437 | -197.637 | -57.227 | -145.03 |
| ∆ Working Capital | -213,789 | 148.376 | -146.2 | 140.41 | -87.803 |
| Debt repayment | 450,000 | 384.600 | 347.786 | 2191.326 | 660.115 |
| New debt issues | 250,000 | 660.341 | 962.542 | 2083.708 | 763.53 |
| FCFE | 13,891.625 | 282.187 | 984.643 | 88.002 | 660.799 |
| Share Outstanding | 758.39 | 758.39 | 728.39 | 728.39 | 728.39 |
| FCFE per share | 18.31725761 | 0.372 | 1.351807411 | 0.120817145 | 0.907204931 |
Table 5: Historical FCFE
Historical FCFE growth rate
Table 5 shows us the FCFE per share in the past few years. To calculate FCFE per share, we use the data from the Crown annual report (Statement of Cash Flow and Income Statement) in year 2011 until year 2014.
There are two ways in calculating the growth differences, which are the constant FCFE model and the multi-stage FCFE model. The constant FCFE model refers to the model that has stable growth rate.
On the other hand, the multi-stage FCFE model is calculated according to the present value of the FCFE each year for the outstanding growth period with additional of the terminal price of the present value in ending period.
Where
Thus, a phase of the company’s growth rate needs to be calculated in order to forecast the intrinsic value of the company price.

Figure19: FCFE per share trend
The graph above (Figure 20) shows us a trend of CWN’s FCFE per share from year 2010 through 2014. In the year 2010 CWN has the highest peak of FCFE per share, which was $18.32 and in 2011 it dropped dramatically to $0.37 per share. The highest peak in 2010 was a result in the change of working capital. The working capital of year 2009 was $213,589 due to the current asset was much higher than the current liabilities, whereas from year 2010 to 2014, CWN’s current assets were lower than the current liabilities, which resulted minus in working capitals.
Forecasted Growth Rate
| Phase 1 | Phase 2 | Phase 3 | |
| Slow-Moderate growth rate | High growth rate | Constant growth rate | |
| 2015-2016 | 2017-2019 | 2020-onwards | |
| 5% | 7.2% | 3.7% | |
Table 5:Forcasted growth rate
Using the different growth rates from DDM, we have forecasted the equity price derivation of Crown Resorts Ltd for the next few years. We have calculated the intrinsic value or NPV, which is sold at a discount rate of 4.35%. Below are the table of forecasted growth rate and NPV.
NPV
Table 6: NPV
| Historical | Forecast | |||||||
| Year | 2014 | 2015 | 2016 | 2017 | 2018 | 2019 | 2020 (Constant Growth) | |
| Expected Growth | 5% | 5% | 7.2% | 7.2% | 7.2% | 3.7% | ||
| FCFE($) | 0.9072 | 0.95257 | 1.00019344 | 1.07220736 | 1.14940629 | 1.23216353 | 1.27775360 | |
| Perpetuity | 7.27336664 | |||||||
| Discount Factor (k=4.35%) | 0.95831337 | 0.91836451 | 0.88008099 | 0.84339338 | 0.80823515 | 0.77454255 | ||
| NPV | $10.37 | |||||||
Based on ASX (2015), the current market share price of CWN is $13.74. Clearly, the Net Present Value or intrinsic value is less than the market share price ($13.74>$10.37). From this result, we can see that the current market share price is over-valued.
Sensitivity Analysis
Sensitivity Analysis of FCFE will show us how sensitive the NPV result to changes in each of a model’s input with 1% changes in RR and 0.5% changes in growth rate. In addition, the importance of various forecasting errors can be evaluated through inclusive sensitivity analysis.
| Variance | -2% | -1.5% | -1% | -0.5% | 0.% | 0.5% | 1% | 1.5% | 2% | |
| Variance | Growth/ RR | 1.7% | 2.2% | 2.7% | 3.2% | 3.7% | 4.2% | 4.7% | 5.2% | 5.7% |
| -4% | 0.35% | 12.3329 | 12.3672 | 12.4016 | 12.4359 | 12.4703 | 12.5046 | 12.5389 | 12.5733 | 12.6076 |
| -3% | 1.35% | 11.7668 | 11.7992 | 11.8315 | 11.8639 | 11.8963 | 11.9286 | 11.9610 | 11.9933 | 12.0257 |
| -2% | 2.35% | 11.2351 | 11.2656 | 11.2961 | 11.3266 | 11.3572 | 11.3877 | 11.4182 | 11.4487 | 11.4792 |
| -1% | 3.35% | 10.7353 | 10.7641 | 10.7929 | 10.8217 | 10.8504 | 10.8792 | 10.9080 | 10.9368 | 10.9656 |
| 0% | 4.35% | 10.2652 | 10.2924 | 10.3195 | 10.3467 | 10.3738 | 10.4010 | 10.4282 | 10.4553 | 10.4825 |
| 1% | 5.35% | 9.8226 | 9.8483 | 9.8739 | 9.8996 | 9.9252 | 9.9509 | 9.9765 | 10.0022 | 10.0278 |
| 2% | 6.35% | 9.4057 | 9.4299 | 9.4541 | 9.4784 | 9.5026 | 9.5269 | 9.5511 | 9.5753 | 9.5996 |
| 3% | 7.35% | 9.0126 | 9.0355 | 9.0584 | 9.0814 | 9.1043 | 9.1272 | 9.1501 | 9.1730 | 9.1959 |
| 4% | 8.35% | 8.6418 | 8.6635 | 8.6852 | 8.7068 | 8.7285 | 8.7502 | 8.7719 | 8.7935 | 8.8152 |
Table 7: Sensitivity analysis based on required rate of return and growth rate
From the sensitivity analysis table, we can conclude that the required rate of return (RR) has inverse relationship with the growth rate. The higher the growth rate and the lower the required of return, the greater the NPV will be and vice versa.
Valuation
We have calculated the NPV or the intrinsic value of CWN with two different model which are dividend discounted model (DDM), which is cash based and free cash flow to equity (FCFE), which is based on accounting rules. By calculating the intrinsic value with two models, investors can get the idea of the future value of the company. The figure below will show us the result and comparison of the intrinsic values with market value.
| Valuation Model | Calculated Price | Actual Price | Evaluation | |||
| DDM | $16.72 | $13.74 | Overvalued | |||
| FCFE | $10.37 | $13.74 | Undervalued |
Table 8: Evaluation table
From table 8, we can see the DDM and FCFE are showing different result. The calculated price from DDM model is more than the actual price (over-valued) , as FCFE model calculated price is less than the actual price (undervalued).We recommend to sell this stock as according to the DDM model value, the market price is overvalued. Calculated price from the DDM model is higher than the FCFE model calculated price, so we can assume several things:
Flotation cost on new equity issues creates an expense, which decreases value.
If the firm borrows money to pay dividends, the firm may become overleveraged (relative to optimal) leading to a loss in value
Paying too much in dividends can lead to capital rationing constraints where good project is rejected, resulting in a loss of wealth.
Higher value of DDM is considered as warning on the sustainability of expected dividends,
Appendix
Appendix 1: DuPont Analysis 3 steps process – Crown Resorts
| Year | June 2011 | June 2012 | June 2013 | June 2014 |
| Net Income | 336,000 | 513,000 | 396,000 | 656,000 |
| Net Sales | 2,409,241 | 2,808,870 | 2,895,000 | 3,095,000 |
| Total Assets | 5,023,775 | 5,872,530 | 6,010,000 | 6,569,000 |
| Total Equity | 3,260,360 | 3,374,750 | 3,652,600 | 3,981,700 |
| Net Income/Net Sales | 0.14 | 0.18 | 0.14 | 0.21 |
| Net Sales/ Total Assets (Assets Turnover) | 0.48 | 0.52 | 0.49 | 0.49 |
| Total Assets/ Total Equity | 1.54 | 1.74 | 1.64 | 1.65 |
| ROE | 10.34% | 16.28% | 11.25% | 16.98% |
| Payout Ratio | 83.54% | 53.02% | 54.90% | 38.36% |
| Retention Rate (RR) | 16.46% | 46.98% | 45.10% | 61.64% |
| Growth = ROE x RR | 1.70% | 7.65% | 5.07% | 10.46% |
Appendix 2: DuPont Analysis 5 steps process – Crown Resorts
| Year | June 2011 | June 2012 | June 2013 | June 2014 |
| Net Income | 336,000 | 513,000 | 396,000 | 656,000 |
| Net Sales | 2,409,241 | 2,808,870 | 2,895,000 | 3,095,000 |
| Total Assets | 5,023,775 | 5,872,530 | 6,010,000 | 6,569,000 |
| Total Equity | 3,260,360 | 3,374,750 | 3,652,600 | 3,981,700 |
| EBIT | 469,294 | 503,753 | 520,144 | 537,800 |
| Interest Expense | (66578) | (102062) | (120410) | (99046) |
| Income taxes | (71259) | (106493) | (96236) | (46125) |
| EBT | 407,114 | 619,818 | 751,999 | 441,912 |
| Net Income/EBT | 0.825321654376907 | 0.827662313775979 | 0.526596444942081 | 1.48445844421514 |
| EBT/EBIT | 0.86750310040188 | 1.23040061299883 | 1.44575156110616 | 0.821703235403496 |
| EBIT/Sales | 0.194789147287465 | 0.179343650649549 | 0.179669775474957 | 0.173764135702746 |
| Sales/Total Assets | 0.479567854850187 | 0.478306624231805 | 0.481697171381032 | 0.471152382402192 |
| Total Assets/Total Equity | 1.54086511918929 | 1.7401377879843 | 1.64540327437989 | 1.6497978250496 |
| ROE | 10.34% | 16.28% | 11.25% | 16.98% |
| Growth = ROE x RR | 1.70% | 7.65% | 5.07% | 10.46% |
Appendix 3: DuPont Analysis 3 steps process – Echo Entertainment
| Year | June 2011 | June 2012 | June 2013 | June 2014 |
| Net Income | 226,000 | 42,000 | 84,000 | 106,000 |
| Net Sales | 1,613,000 | 1,616,000 | 1,738,000 | 1,806,000 |
| Total Assets | 3,892,000 | 4,682,000 | 4,346,000 | 4,218,000 |
| Total Equity | 2,378,000 | 2,817,000 | 2,864,000 | 2,932,000 |
| Net Income/Net Sales | 0.14 | 0.03 | 0.05 | 0.06 |
| Net Sales/ Total Assets (Assets Turnover) | 0.41 | 0.35 | 0.40 | 0.43 |
| Total Assets/ Total Equity | 1.64 | 1.66 | 1.52 | 1.44 |
| ROE | 9.41% | 1.74% | 3.04% | 3.72% |
| Payout Ratio | 1.23% | 1.70% | 1.90% | 2.74% |
| Retention Rate (RR) | 98.77% | 98.30% | 98.10% | 97.26% |
| Growth = ROE x RR | 9.29% | 1.71% | 2.98% | 3.62% |
Appendix 4: DuPont Analysis 5 steps process – Echo Entertainment
| Year | June 2011 | June 2012 | June 2013 | June 2014 |
| Net Income | 226,000 | 42,000 | 84,000 | 106,000 |
| Net Sales | 1,613,000 | 1,616,000 | 1,738,000 | 1,806,000 |
| Total Assets | 3,892,000 | 4,682,000 | 4,346,000 | 4,218,000 |
| Total Equity | 2,378,000 | 2,817,000 | 2,864,000 | 2,932,000 |
| EBIT | 347,000 | 145,000 | 186,000 | 242,000 |
| Interest Expense | (4,000) | (82,000) | (71,000) | (62,000) |
| Income taxes | (117,000) | (8,000) | (26,000) | (47,000) |
| EBT | - | - | - | - |
| Net Income/EBT | - | - | - | - |
| EBT/EBIT | - | - | - | - |
| EBIT/Sales | 0.21512710 | 0.08972772 | 0.10701956 | 0.13399779 |
| Net Sales/Total Assets | 0.41 | 0.35 | 0.40 | 0.43 |
| Total Assets/Total Equity | 1.64 | 1.66 | 1.52 | 1.44 |
| ROE | 9.41% | 1.74% | 3.04% | 3.72% |
| Growth = ROE x RR | 9.29% | 1.71% | 2.98% | 3.62% |
Appendix 4: Data Analysis for CWN – Frequency Weekly
| Start | 4/01/2008 | |||
| End | 26/12/2014 | |||
| Frequency | W | |||
| Name | CROWN RESORTS | S&P/ASX 200 - PRICE INDEX | ||
| Code | A:CWNX | ASX200I(PI) | ||
| CURRENCY | A$ | A$ | ||
| 4/01/2008 | 13.4 | 6306.8 | ||
| 11/01/2008 | 11.9 | 5981.6 | ||
| 18/01/2008 | 11.07 | 5747.3 | ||
| 25/01/2008 | 11.5 | 5860.3 | ||
| 1/02/2008 | 12.15 | 5842.9 | ||
| 8/02/2008 | 11.25 | 5658 | ||
| 15/02/2008 | 11.3 | 5606.6 | ||
| 22/02/2008 | 11.15 | 5559.9 | ||
| 29/02/2008 | 11.6 | 5572.1 | ||
| 7/03/2008 | 10.17 | 5264 | ||
| 14/03/2008 | 10.87 | 5206.9 | ||
| 21/03/2008 | 11.19 | 5127.5 | ||
| 28/03/2008 | 10.52 | 5351.1 | ||
| 4/04/2008 | 11.43 | 5619.6 | ||
| 11/04/2008 | 10.82 | 5439.3 | ||
| 18/04/2008 | 10.73 | 5429.7 | ||
| 25/04/2008 | 10.88 | 5587.3 | ||
| 2/05/2008 | 10.97 | 5700.4 | ||
| 9/05/2008 | 11.03 | 5771.8 | ||
| 16/05/2008 | 11 | 5931 | ||
| 23/05/2008 | 10.65 | 5768 | ||
| 30/05/2008 | 10.53 | 5654.7 | ||
| 6/06/2008 | 10.2 | 5592.1 | ||
| 13/06/2008 | 9.45 | 5378.1 | ||
| 20/06/2008 | 8.9 | 5288.3 | ||
| 27/06/2008 | 9.21 | 5237 | ||
| 4/07/2008 | 9.02 | 5082.1 | ||
| 11/07/2008 | 8.57 | 4979.9 | ||
| 18/07/2008 | 7.83 | 4840.4 | ||
| 25/07/2008 | 7.95 | 4970.5 | ||
| 1/08/2008 | 7.69 | 4904 | ||
| 8/08/2008 | 8.08 | 4986.2 | ||
| 15/08/2008 | 8.26 | 4981.7 | ||
| 22/08/2008 | 8.43 | 4931.4 | ||
| 29/08/2008 | 9.15 | 5135.6 | ||
| 5/09/2008 | 9.63 | 4877.1 | ||
| 12/09/2008 | 9 | 4903.8 | ||
| 19/09/2008 | 8.44 | 4804.1 | ||
| 26/09/2008 | 8.79 | 4904.8 | ||
| 3/10/2008 | 7.91 | 4695.4 | ||
| 10/10/2008 | 6.99 | 3960.7 | ||
| 17/10/2008 | 6.41 | 3970.8 | ||
| 24/10/2008 | 6.66 | 3869.4 | ||
| 31/10/2008 | 6.7 | 4018 | ||
| 7/11/2008 | 6.98 | 4051.3 | ||
| 14/11/2008 | 6.38 | 3748.1 | ||
| 21/11/2008 | 4.95 | 3416.5 | ||
| 28/11/2008 | 4.64 | 3742.5 | ||
| 5/12/2008 | 4.8 | 3489.9 | ||
| 12/12/2008 | 5.18 | 3510.4 | ||
| 19/12/2008 | 5.75 | 3615.7 | ||
| 26/12/2008 | 5.78 | 3582.2 | ||
| 2/01/2009 | 6.1 | 3713.8 | ||
| 9/01/2009 | 6.05 | 3735.7 | ||
| 16/01/2009 | 6.01 | 3550.9 | ||
| 23/01/2009 | 5.6 | 3342.7 | ||
| 30/01/2009 | 5.54 | 3540.7 | ||
| 6/02/2009 | 5.22 | 3469.9 | ||
| 13/02/2009 | 5.4 | 3559.1 | ||
| 20/02/2009 | 4.83 | 3402.4 | ||
| 27/02/2009 | 5.19 | 3344.5 | ||
| 6/03/2009 | 5.11 | 3145.5 | ||
| 13/03/2009 | 5.9 | 3345.2 | ||
| 20/03/2009 | 5.87 | 3465.8 | ||
| 27/03/2009 | 6.5 | 3672.3 | ||
| 3/04/2009 | 6 | 3735.6 | ||
| 10/04/2009 | 6.35 | 3671.6 | ||
| 17/04/2009 | 6.73 | 3776.7 | ||
| 24/04/2009 | 6.64 | 3712.3 | ||
| 1/05/2009 | 6.82 | 3769.6 | ||
| 8/05/2009 | 7.3 | 3941.7 | ||
| 15/05/2009 | 6.97 | 3773.2 | ||
| 22/05/2009 | 7.17 | 3761.6 | ||
| 29/05/2009 | 7.23 | 3818 | ||
| 5/06/2009 | 7.7 | 3971.2 | ||
| 12/06/2009 | 7.44 | 4062.2 | ||
| 19/06/2009 | 7.2 | 3899.6 | ||
| 26/06/2009 | 7.05 | 3903.8 | ||
| 3/07/2009 | 7.03 | 3828.2 | ||
| 10/07/2009 | 6.69 | 3794.1 | ||
| 17/07/2009 | 7.32 | 4000.8 | ||
| 24/07/2009 | 7.34 | 4089.8 | ||
| 31/07/2009 | 7.5 | 4244 | ||
| 7/08/2009 | 7.23 | 4299.4 | ||
| 14/08/2009 | 7.33 | 4461 | ||
| 21/08/2009 | 7.08 | 4290.6 | ||
| 28/08/2009 | 8.1 | 4489.6 | ||
| 4/09/2009 | 8.17 | 4435.5 | ||
| 11/09/2009 | 8.14 | 4596.1 | ||
| 18/09/2009 | 8.35 | 4693.2 | ||
| 25/09/2009 | 8.88 | 4713.3 | ||
| 2/10/2009 | 8.59 | 4601.6 | ||
| 9/10/2009 | 8.49 | 4752.9 | ||
| 16/10/2009 | 8.7 | 4836.4 | ||
| 23/10/2009 | 8.6 | 4859.4 | ||
| 30/10/2009 | 8.25 | 4643.2 | ||
| 6/11/2009 | 8.16 | 4594 | ||
| 13/11/2009 | 8.15 | 4706.4 | ||
| 20/11/2009 | 8.13 | 4685.8 | ||
| 27/11/2009 | 7.68 | 4572.1 | ||
| 4/12/2009 | 8.03 | 4702.2 | ||
| 11/12/2009 | 7.76 | 4635.2 | ||
| 18/12/2009 | 7.69 | 4650.5 | ||
| 25/12/2009 | 7.75 | 4790.9 | ||
| 1/01/2010 | 8.04 | 4870.6 | ||
| 8/01/2010 | 7.7 | 4912.1 | ||
| 15/01/2010 | 7.84 | 4899.6 | ||
| 22/01/2010 | 7.66 | 4750.6 | ||
| 29/01/2010 | 7.76 | 4569.6 | ||
| 5/02/2010 | 7.83 | 4514.1 | ||
| 12/02/2010 | 7.78 | 4562.1 | ||
| 19/02/2010 | 7.57 | 4635.1 | ||
| 26/02/2010 | 8 | 4637.7 | ||
| 5/03/2010 | 8.28 | 4767.2 | ||
| 12/03/2010 | 8.17 | 4818.1 | ||
| 19/03/2010 | 8.28 | 4872.2 | ||
| 26/03/2010 | 8.19 | 4896.9 | ||
| 2/04/2010 | 8.1 | 4907.7 | ||
| 9/04/2010 | 8.33 | 4948.1 | ||
| 16/04/2010 | 8.16 | 4984.7 | ||
| 23/04/2010 | 8.06 | 4881.5 | ||
| 30/04/2010 | 8.24 | 4807.4 | ||
| 7/05/2010 | 7.98 | 4480.7 | ||
| 14/05/2010 | 8.33 | 4611.1 | ||
| 21/05/2010 | 7.61 | 4305.4 | ||
| 28/05/2010 | 7.7 | 4457.5 | ||
| 4/06/2010 | 8 | 4449.4 | ||
| 11/06/2010 | 8.13 | 4505.4 | ||
| 18/06/2010 | 8 | 4551.9 | ||
| 25/06/2010 | 7.9 | 4413 | ||
| 2/07/2010 | 7.73 | 4238.7 | ||
| 9/07/2010 | 7.9 | 4396.3 | ||
| 16/07/2010 | 7.73 | 4422.7 | ||
| 23/07/2010 | 8 | 4458.4 | ||
| 30/07/2010 | 7.96 | 4493.5 | ||
| 6/08/2010 | 8.15 | 4566.1 | ||
| 13/08/2010 | 8.32 | 4459.6 | ||
| 20/08/2010 | 8.39 | 4430.9 | ||
| 27/08/2010 | 8.41 | 4370.1 | ||
| 3/09/2010 | 8.38 | 4541.2 | ||
| 10/09/2010 | 8.3 | 4560.3 | ||
| 17/09/2010 | 8.5 | 4638.9 | ||
| 24/09/2010 | 8.42 | 4601.9 | ||
| 1/10/2010 | 8.42 | 4579.2 | ||
| 8/10/2010 | 8.49 | 4681.4 | ||
| 15/10/2010 | 8.78 | 4688.9 | ||
| 22/10/2010 | 8.47 | 4648.2 | ||
| 29/10/2010 | 8.33 | 4661.6 | ||
| 5/11/2010 | 8.82 | 4800.6 | ||
| 12/11/2010 | 8.5 | 4692.7 | ||
| 19/11/2010 | 8.59 | 4629.2 | ||
| 26/11/2010 | 8.25 | 4598.3 | ||
| 3/12/2010 | 8.36 | 4694.2 | ||
| 10/12/2010 | 8.06 | 4745.9 | ||
| 17/12/2010 | 8.22 | 4763.1 | ||
| 24/12/2010 | 8.4 | 4777.3 | ||
| 31/12/2010 | 8.25 | 4745.2 | ||
| 7/01/2011 | 8.28 | 4705 | ||
| 14/01/2011 | 8.61 | 4801.5 | ||
| 21/01/2011 | 8.7 | 4755.6 | ||
| 28/01/2011 | 8.68 | 4774.9 | ||
| 4/02/2011 | 8.77 | 4862.7 | ||
| 11/02/2011 | 8.51 | 4880.9 | ||
| 18/02/2011 | 8.7 | 4936.7 | ||
| 25/02/2011 | 8.23 | 4836.5 | ||
| 4/03/2011 | 8.6 | 4864.3 | ||
| 11/03/2011 | 8.23 | 4644.8 | ||
| 18/03/2011 | 8.05 | 4626.4 | ||
| 25/03/2011 | 8.01 | 4742.6 | ||
| 1/04/2011 | 8.18 | 4861.8 | ||
| 8/04/2011 | 8.43 | 4940.6 | ||
| 15/04/2011 | 8.38 | 4852.1 | ||
| 22/04/2011 | 8.42 | 4913.8 | ||
| 29/04/2011 | 8.43 | 4823.2 | ||
| 6/05/2011 | 8.5 | 4743 | ||
| 13/05/2011 | 8.51 | 4711.4 | ||
| 20/05/2011 | 8.54 | 4732.2 | ||
| 27/05/2011 | 8.74 | 4684 | ||
| 3/06/2011 | 8.8 | 4583.1 | ||
| 10/06/2011 | 8.46 | 4562.1 | ||
| 17/06/2011 | 8.55 | 4484.9 | ||
| 24/06/2011 | 8.57 | 4508.1 | ||
| 1/07/2011 | 8.97 | 4591.2 | ||
| 8/07/2011 | 9.12 | 4654.7 | ||
| 15/07/2011 | 8.66 | 4473.5 | ||
| 22/07/2011 | 9.15 | 4602.8 | ||
| 29/07/2011 | 8.92 | 4424.6 | ||
| 5/08/2011 | 8.32 | 4105.4 | ||
| 12/08/2011 | 8.2 | 4172.6 | ||
| 19/08/2011 | 8.01 | 4101.9 | ||
| 26/08/2011 | 8 | 4200 | ||
| 2/09/2011 | 8.22 | 4242.9 | ||
| 9/09/2011 | 8.06 | 4194.7 | ||
| 16/09/2011 | 8.07 | 4149.4 | ||
| 23/09/2011 | 8.16 | 3903.2 | ||
| 30/09/2011 | 7.97 | 4008.6 | ||
| 7/10/2011 | 7.93 | 4162.9 | ||
| 14/10/2011 | 7.78 | 4205.6 | ||
| 21/10/2011 | 7.85 | 4141.9 | ||
| 28/10/2011 | 8.26 | 4353.3 | ||
| 4/11/2011 | 8.13 | 4281.1 | ||
| 11/11/2011 | 8.07 | 4296.5 | ||
| 18/11/2011 | 8.15 | 4177 | ||
| 25/11/2011 | 8.1 | 3984.3 | ||
| 2/12/2011 | 8.41 | 4288 | ||
| 9/12/2011 | 8.16 | 4203 | ||
| 16/12/2011 | 8.18 | 4159.2 | ||
| 23/12/2011 | 8.1 | 4140.4 | ||
| 30/12/2011 | 8.09 | 4056.6 | ||
| 6/01/2012 | 7.96 | 4108.5 | ||
| 13/01/2012 | 8.13 | 4195.9 | ||
| 20/01/2012 | 8.2 | 4239.6 | ||
| 27/01/2012 | 8.19 | 4288.4 | ||
| 3/02/2012 | 8.33 | 4251.2 | ||
| 10/02/2012 | 8.4 | 4245.3 | ||
| 17/02/2012 | 8.23 | 4195.9 | ||
| 24/02/2012 | 8.3 | 4306.8 | ||
| 2/03/2012 | 8.47 | 4273.1 | ||
| 9/03/2012 | 8.38 | 4212 | ||
| 16/03/2012 | 8.65 | 4276.2 | ||
| 23/03/2012 | 8.6 | 4270.4 | ||
| 30/03/2012 | 8.69 | 4335.2 | ||
| 6/04/2012 | 8.75 | 4319.8 | ||
| 13/04/2012 | 8.75 | 4323.3 | ||
| 20/04/2012 | 8.99 | 4366.5 | ||
| 27/04/2012 | 8.95 | 4362 | ||
| 4/05/2012 | 9.19 | 4396 | ||
| 11/05/2012 | 9.06 | 4285.1 | ||
| 18/05/2012 | 8.7 | 4046.5 | ||
| 25/05/2012 | 8.54 | 4029.2 | ||
| 1/06/2012 | 8.35 | 4063.9 | ||
| 8/06/2012 | 8.13 | 4063.7 | ||
| 15/06/2012 | 8.65 | 4057.3 | ||
| 22/06/2012 | 8.42 | 4048.2 | ||
| 29/06/2012 | 8.49 | 4094.6 | ||
| 6/07/2012 | 8.46 | 4157.8 | ||
| 13/07/2012 | 8.54 | 4082.2 | ||
| 20/07/2012 | 8.49 | 4199.1 | ||
| 27/07/2012 | 8.42 | 4209.8 | ||
| 3/08/2012 | 8.43 | 4221.5 | ||
| 10/08/2012 | 8.56 | 4277.3 | ||
| 17/08/2012 | 8.85 | 4370.1 | ||
| 24/08/2012 | 8.99 | 4349 | ||
| 31/08/2012 | 8.98 | 4316.1 | ||
| 7/09/2012 | 9.27 | 4325.8 | ||
| 14/09/2012 | 9.17 | 4390 | ||
| 21/09/2012 | 9.27 | 4408.3 | ||
| 28/09/2012 | 9.1 | 4387 | ||
| 5/10/2012 | 9.38 | 4494.4 | ||
| 12/10/2012 | 9.42 | 4486.6 | ||
| 19/10/2012 | 9.69 | 4571.1 | ||
| 26/10/2012 | 9.46 | 4472.4 | ||
| 2/11/2012 | 9.79 | 4460.1 | ||
| 9/11/2012 | 10.14 | 4462 | ||
| 16/11/2012 | 9.89 | 4336.8 | ||
| 23/11/2012 | 10.06 | 4413 | ||
| 30/11/2012 | 10.25 | 4506 | ||
| 7/12/2012 | 10.16 | 4551.8 | ||
| 14/12/2012 | 10.13 | 4583.1 | ||
| 21/12/2012 | 10.59 | 4623.6 | ||
| 28/12/2012 | 10.61 | 4671.3 | ||
| 4/01/2013 | 11 | 4723.8 | ||
| 11/01/2013 | 11.52 | 4709.5 | ||
| 18/01/2013 | 11.8 | 4771.2 | ||
| 25/01/2013 | 11.71 | 4835.2 | ||
| 1/02/2013 | 11.73 | 4921.1 | ||
| 8/02/2013 | 11.59 | 4971.3 | ||
| 15/02/2013 | 11.77 | 5033.9 | ||
| 22/02/2013 | 11.75 | 5018.1 | ||
| 1/03/2013 | 11.91 | 5086.1 | ||
| 8/03/2013 | 12.45 | 5123.4 | ||
| 15/03/2013 | 12.42 | 5120.2 | ||
| 22/03/2013 | 11.99 | 4967.3 | ||
| 29/03/2013 | 12.3 | 4966.5 | ||
| 5/04/2013 | 12.6 | 4891.4 | ||
| 12/04/2013 | 12.67 | 5013.5 | ||
| 19/04/2013 | 12.45 | 4931.9 | ||
| 26/04/2013 | 12.8 | 5097.5 | ||
| 3/05/2013 | 12.9 | 5129.5 | ||
| 10/05/2013 | 12.99 | 5206.1 | ||
| 17/05/2013 | 13.45 | 5180.8 | ||
| 24/05/2013 | 12.83 | 4983.5 | ||
| 31/05/2013 | 12.85 | 4926.6 | ||
| 7/06/2013 | 12.15 | 4737.7 | ||
| 14/06/2013 | 12.39 | 4791.8 | ||
| 21/06/2013 | 12.02 | 4738.8 | ||
| 28/06/2013 | 12.11 | 4802.6 | ||
| 5/07/2013 | 12.6 | 4841.7 | ||
| 12/07/2013 | 13.07 | 4973.9 | ||
| 19/07/2013 | 12.77 | 4972.1 | ||
| 26/07/2013 | 12.7 | 5042 | ||
| 2/08/2013 | 13.26 | 5116.8 | ||
| 9/08/2013 | 13.26 | 5055.2 | ||
| 16/08/2013 | 13.6 | 5113.9 | ||
| 23/08/2013 | 14.34 | 5123.4 | ||
| 30/08/2013 | 14.61 | 5135 | ||
| 6/09/2013 | 15 | 5145 | ||
| 13/09/2013 | 15.68 | 5219.6 | ||
| 20/09/2013 | 15.63 | 5276.7 | ||
| 27/09/2013 | 15.85 | 5307.1 | ||
| 4/10/2013 | 15.8 | 5208 | ||
| 11/10/2013 | 15.79 | 5230.9 | ||
| 18/10/2013 | 16.75 | 5321.5 | ||
| 25/10/2013 | 16.79 | 5386.3 | ||
| 1/11/2013 | 17.08 | 5411.1 | ||
| 8/11/2013 | 16.67 | 5400.7 | ||
| 15/11/2013 | 16.7 | 5401.7 | ||
| 22/11/2013 | 16.55 | 5335.9 | ||
| 29/11/2013 | 16.9 | 5320 | ||
| 6/12/2013 | 16.47 | 5186 | ||
| 13/12/2013 | 15.9 | 5098.4 | ||
| 20/12/2013 | 16.52 | 5265.2 | ||
| 27/12/2013 | 16.91 | 5324.1 | ||
| 3/01/2014 | 17.14 | 5350.1 | ||
| 10/01/2014 | 17.17 | 5312.4 | ||
| 17/01/2014 | 17.6 | 5305.9 | ||
| 24/01/2014 | 17.21 | 5240.9 | ||
| 31/01/2014 | 16.68 | 5190 | ||
| 7/02/2014 | 16.54 | 5166.5 | ||
| 14/02/2014 | 17.4 | 5356.3 | ||
| 21/02/2014 | 16.68 | 5438.7 | ||
| 28/02/2014 | 17.28 | 5404.8 | ||
| 7/03/2014 | 17.55 | 5462.3 | ||
| 14/03/2014 | 17.22 | 5329.4 | ||
| 21/03/2014 | 17.13 | 5338.1 | ||
| 28/03/2014 | 16.51 | 5366.9 | ||
| 4/04/2014 | 17.16 | 5422.8 | ||
| 11/04/2014 | 16.52 | 5428.6 | ||
| 18/04/2014 | 16.4 | 5454.2 | ||
| 25/04/2014 | 16.47 | 5531 | ||
| 2/05/2014 | 16.33 | 5458.1 | ||
| 9/05/2014 | 15.82 | 5460.8 | ||
| 16/05/2014 | 15.67 | 5479 | ||
| 23/05/2014 | 16.06 | 5492.8 | ||
| 30/05/2014 | 16.26 | 5492.5 | ||
| 6/06/2014 | 15.76 | 5464 | ||
| 13/06/2014 | 15.26 | 5405.1 | ||
| 20/06/2014 | 14.97 | 5419.5 | ||
| 27/06/2014 | 15.19 | 5445.1 | ||
| 4/07/2014 | 15.98 | 5525 | ||
| 11/07/2014 | 15.6 | 5486.8 | ||
| 18/07/2014 | 15.28 | 5531.7 | ||
| 25/07/2014 | 15.86 | 5583.5 | ||
| 1/08/2014 | 16 | 5556.4 | ||
| 8/08/2014 | 14.75 | 5435.3 | ||
| 15/08/2014 | 15.49 | 5566.5 | ||
| 22/08/2014 | 16.18 | 5645.6 | ||
| 29/08/2014 | 15.8 | 5625.9 | ||
| 5/09/2014 | 15.16 | 5598.7 | ||
| 12/09/2014 | 15.04 | 5531.1 | ||
| 19/09/2014 | 14.68 | 5433.1 | ||
| 26/09/2014 | 13.97 | 5313.4 | ||
| 3/10/2014 | 13.62 | 5318.2 | ||
| 10/10/2014 | 13.46 | 5188.3 | ||
| 17/10/2014 | 13.71 | 5271.7 | ||
| 24/10/2014 | 14.07 | 5412.2 | ||
| 31/10/2014 | 14.47 | 5526.6 | ||
| 7/11/2014 | 14.15 | 5549.1 | ||
| 14/11/2014 | 14.19 | 5454.3 | ||
| 21/11/2014 | 14.02 | 5304.3 | ||
| 28/11/2014 | 14.38 | 5313 | ||
| 5/12/2014 | 13.84 | 5335.3 | ||
| 12/12/2014 | 13.1 | 5219.6 | ||
| 19/12/2014 | 12.44 | 5338.6 | ||
| 26/12/2014 | 12.58 | 5394.5 | ||
| RM(ln) CWN | RM(ln) S&P |
| -0.118716307 | -0.052940326 |
| -0.072299653 | -0.039957911 |
| 0.038108289 | 0.019470618 |
| 0.054982134 | -0.002973548 |
| -0.076961041 | -0.032156776 |
| 0.004434597 | -0.009125998 |
| -0.013363228 | -0.008364353 |
| 0.0395656 | 0.00219188 |
| -0.131562888 | -0.056880809 |
| 0.066564491 | -0.010906525 |
| 0.029013821 | -0.015366458 |
| -0.061742315 | 0.042683936 |
| 0.08296327 | 0.04895834 |
| -0.054845204 | -0.032610111 |
| -0.008352717 | -0.001766492 |
| 0.013882685 | 0.028612281 |
| 0.008238033 | 0.020040183 |
| 0.005454559 | 0.012447642 |
| -0.00272356 | 0.027208843 |
| -0.032335381 | -0.027867433 |
| -0.011331566 | -0.019838342 |
| -0.031840606 | -0.01113217 |
| -0.076372979 | -0.039019736 |
| -0.059963465 | -0.016838319 |
| 0.034238574 | -0.009748018 |
| -0.020845516 | -0.030024253 |
| -0.051176601 | -0.020314751 |
| -0.090305223 | -0.028412449 |
| 0.015209419 | 0.026523077 |
| -0.033251145 | -0.01346924 |
| 0.049471089 | 0.016622898 |
| 0.022032715 | -0.000902898 |
| 0.020372184 | -0.010148275 |
| 0.081957107 | 0.040573758 |
| 0.051129347 | -0.051645901 |
| -0.067658648 | 0.005459634 |
| -0.064242269 | -0.020540695 |
| 0.040632403 | 0.020744597 |
| -0.10548693 | -0.043631011 |
| -0.123647226 | -0.170162529 |
| -0.086621285 | 0.002546808 |
| 0.038260214 | -0.025868129 |
| 0.005988042 | 0.03768481 |
| 0.04094139 | 0.008253551 |
| -0.089880819 | -0.077788772 |
| -0.253780521 | -0.09263241 |
| -0.06467321 | 0.091137202 |
| 0.033901552 | -0.069880755 |
| 0.076189138 | 0.005856909 |
| 0.104394799 | 0.029555483 |
| 0.005203828 | -0.009308338 |
| 0.053885088 | 0.036078474 |
| -0.008230499 | 0.005879606 |
| -0.006633523 | -0.050734125 |
| -0.070658151 | -0.060422229 |
| -0.010772097 | 0.057545584 |
| -0.059497099 | -0.020198673 |
| 0.033901552 | 0.025381929 |
| -0.111552486 | -0.045026639 |
| 0.07188723 | -0.017163859 |
| -0.015534293 | -0.061344346 |
| 0.143752947 | 0.061553622 |
| -0.005097717 | 0.035417004 |
| 0.101947543 | 0.057874683 |
| -0.080042708 | 0.017090279 |
| 0.056695344 | -0.017280914 |
| 0.058120331 | 0.028223078 |
| -0.01346318 | -0.017198982 |
| 0.026747508 | 0.015317264 |
| 0.068014876 | 0.044643207 |
| -0.046259123 | -0.043688655 |
| 0.02829043 | -0.003079049 |
| 0.008333382 | 0.014882326 |
| 0.062981293 | 0.039341591 |
| -0.03434948 | 0.022656383 |
| -0.032789823 | -0.040850715 |
| -0.021053409 | 0.001076454 |
| -0.002840911 | -0.019555719 |
| -0.049572832 | -0.00894749 |
| 0.089996454 | 0.053047113 |
| 0.002728515 | 0.022001728 |
| 0.021564178 | 0.037010152 |
| -0.036663984 | 0.012969257 |
| 0.01373648 | 0.036897478 |
| -0.034701608 | -0.038946373 |
| 0.134590154 | 0.045337028 |
| 0.008604847 | -0.012123262 |
| -0.003678729 | 0.035567769 |
| 0.025471359 | 0.020906535 |
| 0.061540018 | 0.004273647 |
| -0.033202821 | -0.023984231 |
| -0.011709736 | 0.032350889 |
| 0.024434025 | 0.017415684 |
| -0.011560822 | 0.004744331 |
| -0.041549003 | -0.04551119 |
| -0.010969031 | -0.010652679 |
| -0.001226242 | 0.02417218 |
| -0.002457004 | -0.004386626 |
| -0.056941376 | -0.024564041 |
| 0.044564981 | 0.028057866 |
| -0.034202194 | -0.014351136 |
| -0.009061551 | 0.003295393 |
| 0.00777206 | 0.029743545 |
| 0.03673624 | 0.016498848 |
| -0.043208754 | 0.008484416 |
| 0.018018506 | -0.00254798 |
| -0.023226851 | -0.030882643 |
| 0.01297035 | -0.038845252 |
| 0.008980176 | -0.012219842 |
| -0.006406172 | 0.010577212 |
| -0.027363271 | 0.01587473 |
| 0.055248474 | 0.00056078 |
| 0.034401427 | 0.027540577 |
| -0.01337406 | 0.010620529 |
| 0.01337406 | 0.011165921 |
| -0.010929071 | 0.005056771 |
| -0.011049836 | 0.002203048 |
| 0.027999395 | 0.008198264 |
| -0.020619287 | 0.007369557 |
| -0.012330612 | -0.020920671 |
| 0.022086787 | -0.015296152 |
| -0.032061932 | -0.070377113 |
| 0.042925045 | 0.028687156 |
| -0.090400284 | -0.068596391 |
| 0.011757157 | 0.034718022 |
| 0.038221213 | -0.001818815 |
| 0.016119382 | 0.012507422 |
| -0.016119382 | 0.010268051 |
| -0.012578782 | -0.030989998 |
| -0.021753897 | -0.040298112 |
| 0.021753897 | 0.03650666 |
| -0.021753897 | 0.005987091 |
| 0.034332679 | 0.008039588 |
| -0.005012542 | 0.007841951 |
| 0.023588927 | 0.016027541 |
| 0.020644328 | -0.023600373 |
| 0.008378266 | -0.006456352 |
| 0.002380954 | -0.013816832 |
| -0.003573559 | 0.038405402 |
| -0.0095924 | 0.004197117 |
| 0.023810649 | 0.017088858 |
| -0.009456335 | -0.008008007 |
| 0 | -0.004944951 |
| 0.008279172 | 0.0220729 |
| 0.033587407 | 0.001600803 |
| -0.035945899 | -0.008717965 |
| -0.016667052 | 0.002878689 |
| 0.057158414 | 0.029382173 |
| -0.036955707 | -0.0227328 |
| 0.010532572 | -0.013624043 |
| -0.040385536 | -0.006697397 |
| 0.013245227 | 0.020641034 |
| -0.036544871 | 0.010953383 |
| 0.019656653 | 0.003617629 |
| 0.021661497 | 0.002976817 |
| -0.018018506 | -0.006741953 |
| 0.003629768 | -0.008507808 |
| 0.03908135 | 0.020302596 |
| 0.010398707 | -0.009605498 |
| -0.002301497 | 0.00405016 |
| 0.010315278 | 0.018220808 |
| -0.030094864 | 0.00373579 |
| 0.022081083 | 0.011367463 |
| -0.055537011 | -0.020505773 |
| 0.043976189 | 0.005731502 |
| -0.043976189 | -0.046174506 |
| -0.022113923 | -0.003969286 |
| -0.00498133 | 0.024806481 |
| 0.02100139 | 0.024823231 |
| 0.030104621 | 0.016078042 |
| -0.005948858 | -0.01807518 |
| 0.004761914 | 0.012635972 |
| 0.001186944 | -0.018609965 |
| 0.008269391 | -0.016767761 |
| 0.001175779 | -0.006684743 |
| 0.003519065 | 0.004405107 |
| 0.023149182 | -0.010237765 |
| 0.006841532 | -0.021776821 |
| -0.039402548 | -0.004592581 |
| 0.010582109 | -0.017066845 |
| 0.00233645 | 0.00515958 |
| 0.045617943 | 0.018265649 |
| 0.016584128 | 0.013736034 |
| -0.051755082 | -0.039706362 |
| 0.055039157 | 0.028493714 |
| -0.025457933 | -0.039484935 |
| -0.069633692 | -0.074876699 |
| -0.014528101 | 0.016236162 |
| -0.023443393 | -0.017089062 |
| -0.001249219 | 0.023634244 |
| 0.027128667 | 0.010162472 |
| -0.019656653 | -0.011425174 |
| 0.001239926 | -0.010858078 |
| 0.011090687 | -0.061167016 |
| -0.023559676 | 0.026645324 |
| -0.005031457 | 0.037769894 |
| -0.019096697 | 0.010205024 |
| 0.008957194 | -0.015262351 |
| 0.050911056 | 0.049779558 |
| -0.015863664 | -0.016724192 |
| -0.007407441 | 0.003590752 |
| 0.009864445 | -0.028207452 |
| -0.006153866 | -0.047231647 |
| 0.037557412 | 0.073458786 |
| -0.030177305 | -0.020021868 |
| 0.002447982 | -0.010475808 |
| -0.009828089 | -0.004530347 |
| -0.001235331 | -0.020447217 |
| -0.016199731 | 0.012712814 |
| 0.021131924 | 0.02104986 |
| 0.008573231 | 0.010361067 |
| -0.001220256 | 0.011444778 |
| 0.016949558 | -0.008712407 |
| 0.00836825 | -0.001388807 |
| -0.020445691 | -0.011704631 |
| 0.0084695 | 0.026087311 |
| 0.020274994 | -0.00785561 |
| -0.010682594 | -0.014401965 |
| 0.031711406 | 0.01512717 |
| -0.005797118 | -0.001357265 |
| 0.010410736 | 0.015060246 |
| 0.006880761 | -0.00355864 |
| 0 | 0.000809895 |
| 0.027059148 | 0.009942773 |
| -0.004459316 | -0.001031105 |
| 0.026462404 | 0.007764369 |
| -0.014246816 | -0.025551148 |
| -0.040546094 | -0.057291579 |
| -0.018562018 | -0.004284465 |
| -0.022499469 | 0.008575259 |
| -0.026700615 | -4.9215E-05 |
| 0.061998397 | -0.001576161 |
| -0.026949493 | -0.00224539 |
| 0.008279172 | 0.011396695 |
| -0.003539827 | 0.015317056 |
| 0.009411834 | -0.018350029 |
| -0.005872007 | 0.028234158 |
| -0.008279172 | 0.002544924 |
| 0.001186944 | 0.002775374 |
| 0.015303418 | 0.013131454 |
| 0.033317269 | 0.021463923 |
| 0.015695389 | -0.004839959 |
| -0.001112966 | -0.007593717 |
| 0.031783497 | 0.002244878 |
| -0.010846093 | 0.014732133 |
| 0.010846093 | 0.004159901 |
| -0.018508966 | -0.004843505 |
| 0.030305349 | 0.024186555 |
| 0.004255326 | -0.001737001 |
| 0.028259337 | 0.0186587 |
| -0.024022043 | -0.021828699 |
| 0.034289073 | -0.00275399 |
| 0.035126542 | 0.000425909 |
| -0.024963853 | -0.028460347 |
| 0.017043019 | 0.017417981 |
| 0.018710541 | 0.020855112 |
| -0.008819263 | 0.010112917 |
| -0.002957124 | 0.006852866 |
| 0.044408841 | 0.008797997 |
| 0.001886793 | 0.010263783 |
| 0.03609832 | 0.011176155 |
| 0.046189382 | -0.003031815 |
| 0.024014876 | 0.0130161 |
| -0.007656354 | 0.013324648 |
| 0.001706485 | 0.01760959 |
| -0.012007005 | 0.010149293 |
| 0.015411264 | 0.012513656 |
| -0.001700681 | -0.003143656 |
| 0.013525143 | 0.013459953 |
| 0.04434224 | 0.007306953 |
| -0.002412546 | -0.00062478 |
| -0.035235107 | -0.030317068 |
| 0.025526293 | -0.000161066 |
| 0.024097552 | -0.015236806 |
| 0.00554018 | 0.024655713 |
| -0.017516371 | -0.016409965 |
| 0.027724548 | 0.033025914 |
| 0.00778214 | 0.006257965 |
| 0.006952519 | 0.014822826 |
| 0.034799275 | -0.00487153 |
| -0.047192927 | -0.038827029 |
| 0.001557633 | -0.01148336 |
| -0.056014642 | -0.039097309 |
| 0.019560526 | 0.011354338 |
| -0.030317767 | -0.011122185 |
| 0.007459628 | 0.013373499 |
| 0.039665256 | 0.008108461 |
| 0.036622714 | 0.026938342 |
| -0.023220858 | -0.000361955 |
| -0.005496677 | 0.013960543 |
| 0.043149991 | 0.014726415 |
| 0 | -0.012111827 |
| 0.025317808 | 0.011544906 |
| 0.052983042 | 0.001855959 |
| 0.018653391 | 0.002261562 |
| 0.026343975 | 0.001945526 |
| 0.044335814 | 0.014395401 |
| -0.00319387 | 0.010880132 |
| 0.013977356 | 0.005744644 |
| -0.00315956 | -0.018849642 |
| -0.000633112 | 0.004387442 |
| 0.05902143 | 0.017171871 |
| 0.002385213 | 0.012103474 |
| 0.017124717 | 0.004593707 |
| -0.024297492 | -0.001923825 |
| 0.001798023 | 0.000185144 |
| -0.009022618 | -0.012256151 |
| 0.02092752 | -0.002984264 |
| -0.025773078 | -0.025510616 |
| -0.035221435 | -0.017035922 |
| 0.038252659 | 0.032192367 |
| 0.023333395 | 0.011124552 |
| 0.01350975 | 0.004871569 |
| 0.001748762 | -0.007071542 |
| 0.024735227 | -0.001224302 |
| -0.022408292 | -0.01232617 |
| -0.031280213 | -0.009759542 |
| -0.008428707 | -0.004538221 |
| 0.050688517 | 0.036077962 |
| -0.042259809 | 0.015266624 |
| 0.035339366 | -0.006252614 |
| 0.015504187 | 0.010582499 |
| -0.018982451 | -0.024631285 |
| -0.005240187 | 0.001631123 |
| -0.036865054 | 0.005380676 |
| 0.038614836 | 0.010361827 |
| -0.038009326 | 0.001068987 |
| -0.007290433 | 0.00470468 |
| 0.004259209 | 0.013982677 |
| -0.008536637 | -0.013267887 |
| -0.031728945 | 0.000494555 |
| -0.009526906 | 0.003327303 |
| 0.024583652 | 0.002515541 |
| 0.012376396 | -5.46184E-05 |
| -0.03123302 | -0.005202403 |
| -0.032240059 | -0.01083817 |
| -0.019186827 | 0.002660608 |
| 0.014589118 | 0.004712561 |
| 0.050700624 | 0.014567126 |
| -0.024067026 | -0.00693804 |
| -0.020726131 | 0.008149975 |
| 0.037255432 | 0.009320638 |
| 0.008788506 | -0.004865403 |
| -0.081345639 | -0.0220357 |
| 0.048951572 | 0.023851773 |
| 0.043581257 | 0.014109991 |
| -0.023765972 | -0.003495545 |
| -0.04134956 | -0.004846507 |
| -0.007947062 | -0.012147717 |
| -0.024227295 | -0.017876837 |
| -0.04957385 | -0.022277942 |
| -0.025372873 | 0.000902969 |
| -0.011816977 | -0.02472881 |
| 0.018403169 | 0.015946801 |
| 0.025919378 | 0.026302773 |
| 0.02803267 | 0.020917134 |
| -0.022362917 | 0.004062954 |
| 0.002822867 | -0.017231464 |
| -0.01205261 | -0.027886476 |
| 0.025353471 | 0.001638835 |
| -0.038275402 | 0.004188468 |
| -0.05495072 | -0.021924345 |
| -0.051695143 | 0.022542676 |
| 0.011191164 | 0.01041647 |
Appendix 5: Summary Output - Regression Analysis

Appendix 6: Calculation of Intrinsic Value of DDM

References:
Crown Resorts Limited Annual Report, (2010-2014).
http://www.crownresorts.com.au/investors-media/annual-reports
Echo-Yahoo Finance (2011 – 2014)
https://au.finance.yahoo.com/q?s=ECHO
James Packers, (2015). How James Packers Crown Resorts Raised 600m to Fund New Casino Projects
http://www.afr.com/business/banking-and-finance/financial-services/how-james-packers-crown-resorts-raised-600m-to-fund-new-casino-projects-20150327-1m8zab
PRASHANT MEHRA, (2015).UBS cuts Crown price target as Macau downturn bites.
http://www.theaustralian.com.au/business/companies/ubs-cuts-crown-price-target-as-macau-downturn-bites/story-fn91v9q3-1227304845281
CROWN RESORTS LIMITED, (2015). the australian business review.
http://markets.theaustralian.com.au/shares/CWN/crown-resorts-limited
MITCHELL NEEMS, (N.D). Crown increases notes offer to $600m.
http://www.businessspectator.com.au/news/2015/3/20/gaming-and-racing/crown-increases-notes-offer-600m
James Packers, (2015). Sydney Casino A Penthouse for Hugh Rollers
http://www.afr.com/real-estate/james-packers-sydney-casino-a-penthouse-for-high-rollers-20150324-1m6g7i
JP Morgan, (2015). Crown’s VIP strength ‘positive surprise.http://www.ggrasia.com/crowns-vip-strength-positive-surprise-jp-morgan/
Emily Stewart, (2015). James Packer's Melco Crown Macau joint venture faces structural decline: analysts.
http://www.abc.net.au/news/2015-04-20/james-packer-crown-hyper-casino-growth-over/6406030
Crown looks forward to Macau growth, (2013).
http://www.news.com.au/finance/business/crown-profit-down-22/story-e6frfkur-1226702659469
The Australian News, (2015).
http://www.theaustralian.com.au/business/companies/crown-resorts-bets-on-macau-for-growth/story-fn91v9q3-1226834213499?nk=ecd6c0dbf733e667e31ac90d1f3e44f7
Multi-stage Dividend Discount Models, (2015)
http://financetrain.com/multi-stage-dividend-discount-models-2/\
John Del Vecchio, (2000). Dividend Discount Model
http://pages.stern.nyu.edu/~adamodar/New_Home_Page/articles/ddm.htm


