presenting draft
Running Head: BUSINESS DESCRIPTION AND BOND VALUATION OF APLE INC. 0
Business Description and bond valuation of Apple INC
Student’s Name
Course Number
Date
Business Description and bond valuation of Apple INC Analysis
Part-1
Business Description: Apple INC
Apple Inc formerly known as Apple Computers Inc is basically an American based multinational corporation with its headquartering located in California, United States. The company develops designs and sells the consumer electronics, along with manufacturing & selling of computer software and personal computers. The best hardware that designs by the company is Mac line of computers, iPod smartphones, IPod music players and iPad tablet Computers.
The computer software in which the company is dealing is OS X and iOS operating systems and the iTune Media browser. The company was founded in the year 1976 with the name of Apple Computers. Steve Jobs is known as the God father for the company as he was the man who invented the smart phones in the company which revalorized the whole world tremendously. By revenue and size, Apple Inc is known as the second largest information technology based company after Samsung Electronics. Apart from this achievement, Apple Inc is the third largest mobile manufacturer of the world after Samsung and Nokia and Forbes named Apple Inc as the most admired country of the world for year (FY) 2011. The company has its active recognition in almost 14 countries of the world and has more than 408 retail stores in total. In terms of market capitalization, Apple Inc is known as the largest company of the world with a net worth of US$415 billion in total. The company earned net revenue of US$ 156.508 billion in the year 2012 with net income of US$ 41.733 billion in the same year.
Apple adopts market skimming strategies. The price is middle-high level. In order to gain maximize profits, they set their prices higher than general products, it’s good for early cash recovery and making a significant investment in its development (John Mullins, 2012). But the strategies limited customers group, because customers for Apple products is groups that have high income level. Maybe there are more and more competitors to enter the market. Because they see high profits being made.
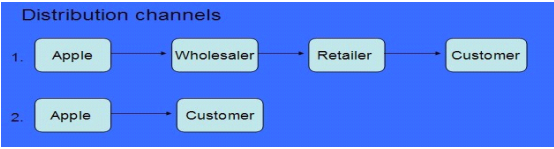
The distribution channel of the company comprises on two different steps, one is through the wholesalers, retailer and the second one is to directly approaching to the consumers. Both of the distribution channels are perfect for the company as a whole and both of the mediums are enhancing the products and financial portfolio of the company as a whole.
Market Coverage

The green area is the space which apple has entered. The main market of apple is located in the western countries. The main countries are including: United States, United Kingdom, France, Canada, Germany, Australia, Japan, Italy, China and Netherlands. Most of its markets are located in the developed countries, only have a small part of market shares are located in the developing countries.
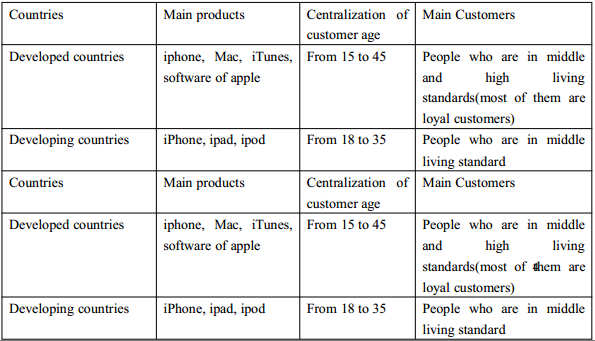
Table above shows the main apple products of developed countries and developing countries. Among these products, Iphone is very popular in both developed countries and developing countries. The main products which sold in developed countries are more expensive and have higher technology than the main products which sold in developing countries. Additionally, this table also shows that the main apple customers of developed countries and developing countries are both in the middle and high living standards. The centralizations of customer age are not very different between developed countries and developing countries (John Mullins, 2012). After analyzing this table, we found that apple’s target group is the 15 to 45 age people who are in the middle and high living standards. The main products iphone, ipod and ipad are in the middle level. Their prices are fit with the living level of developing countries. Additionally, developing countries have bigger population than developed countries, expanding the market in developing countries is good for increasing the sales.
| Criteria | Political | Environmental | Criteria |
|
|
|
|
| Criteria | Social | Technological | Criteria |
|
|
|
|
Part-2: Bond Valuation
| Maturity | 2 years | 5 years | 10 years | 20 years |
| Annual Coupon | £5 | £5 | £5 | £5 |
Clean Price Computation
The price of a coupon bond not including any accrued interest is known as Clean Price (David, 2007, pp.35). A clean price is the discounted future cash flows, not including any interest accruing on the next coupon payment date (David, 2007, pp.35). Immediately following each coupon payment, the clean price will equal the dirty price (David, 2007, pp.35).
£5 * 90 / 360
= 1.25 * 2 = 2.5 (Dirty Price)
= 100 – 2.5
= 97.5 (clean Price)
£5 * 90 / 360
= 1.25 * 5 = 6.25
= 100 – 6.25
= 93.75
£5 * 90 / 360
= 1.25*10 = 12.5
= 100 -12.5
= 87.5
£5 * 90 / 360
= 1.25 * 20 = 25
= 100 – 25
= 75
| Maturity | 2 years | 5 years | 10 years | 20 years |
| Clean Price | £97.5 | £93.75 | £87.5 | £75 |
Theta moves to 0.01 from 0, hence the new prices of annual yields and long term average yields would be computed again (David, 2007, pp.35). The results are mentioned below,
| UK Government Bond Yields | Theta | Theta | ||||
| Maturity (Years) | Annual Yields March 2013 | Long Term Average Yields | Annual Yields | Long Term | ||
| 1 | 0.20% | 2.90% | 0.10% | 2.800% | ||
| 2 | 0.23% | 3.10% | 0.13% | 3.000% | ||
| 3 | 0.44% | 3.29% | 0.34% | 3.190% | ||
| 4 | 0.64% | 3.46% | 0.54% | 3.360% | ||
| 5 | 0.85% | 3.61% | 0.75% | 3.510% | ||
| 8 | 1.58% | 3.75% | 1.48% | 3.650% | ||
| 9 | 1.80% | 3.87% | 1.70% | 3.770% | ||
| 10 | 2.03% | 3.99% | 1.93% | 3.890% | ||
| 18 | 3.10% | 4.11% | 3.00% | 4.010% | ||
| 19 | 3.14% | 4.14% | 3.04% | 4.040% | ||
| 20 | 3.19% | 4.17% | 3.09% | 4.070% | ||

This formula computes the net change in the value of a bond and it would applied here as well.
| UK Government Bond Yields | Change | Change | ||
| Maturity (Years) | Annual Yields March 2013 | Long Term Average Yields | Annual Yields | Long Term |
| 1 | 0.20% | 2.90% |
|
|
| 2 | 0.23% | 3.10% | 0.15 | 6.897% |
| 3 | 0.44% | 3.29% | 0.9130 | 6.129% |
| 4 | 0.64% | 3.46% | 0.4545 | 5.167% |
| 5 | 0.85% | 3.61% | 0.3281 | 4.335% |
| 8 | 1.58% | 3.75% | 0.8588 | 3.878% |
| 9 | 1.80% | 3.87% | 0.1392 | 3.200% |
| 10 | 2.03% | 3.99% | 0.1278 | 3.101% |
| 18 | 3.10% | 4.11% | 0.5271 | 3.008% |
| 19 | 3.14% | 4.14% | 0.0129 | 0.730% |
| 20 | 3.19% | 4.17% | 0.0159 | 0.725% |
|
| Mean |
| 0.3527 | 0.0372 |
The mean annual yield return is 0.35% while the mean return of Long term Bonds is 0.037%. Assume that the price of the bond is 100. The new average return after subtracting theta is 3.57%
| Maturity | 2 years | 5 years | 10 years | 20 years |
| Coupon | £3.57 | £3.57 | £3.57 | £3.57 |
Previous Coupon Rate table is mentioned below,
| Maturity | 2 years | 5 years | 10 years | 20 years |
| Annual Coupon | £5 | £5 | £5 | £5 |
Full Price = £ 100 + 5 = £ 105
Full Price = £ 100 + 3.57 = £ 103.57
Holding Period Return = (103.57 – 105 / 105) * 100
Holding Period Return = - 1.36%
This is showing that the return would be in negative.
Mitigating the risk relates to the investment is extremely important either for a company or an individual (Charles & Jones, 2008). In the investment theory, there are certain things which have been used for this purpose in total (David, 2007, pp.35).
The field of investment has been one of the fastest growing fields in the world merely because of varied reasons (David, 2007, pp.35). Handling of portfolio is one of the most important and widely used methods in mitigating the risk. According to the theory of investment management, portfolio always mitigates the expenses and increases the level of return accordingly (David, 2007, pp.35).
It is always recommend investing in a portfolio rather than a single security. Investors always like to have high figure of analysis and in pursuance of that they usually invest in a portfolio or stock, through which they can increase their earning potential (David, 2007, pp.35).
By considering the result in the above mentioned task, it would not be advised to excrete out from the government bonds and make a portfolio with Long term average yields, as it would not give a suitable and fruitful result for the investors as a whole (David, 2007, pp.35).
Now the theta would be 0.5%
Changes in yields would be like this,
| UK Government Bond Yields | Theta | Theta | ||||
| Maturity (Years) | Annual Yields March 2013 | Long Term Average Yields | Annual Yields | Long Term | ||
| 1 | 0.20% | 2.90% | 0.15% | 2.850% | ||
| 2 | 0.23% | 3.10% | 0.18% | 3.050% | ||
| 3 | 0.44% | 3.29% | 0.39% | 3.240% | ||
| 4 | 0.64% | 3.46% | 0.59% | 3.410% | ||
| 5 | 0.85% | 3.61% | 0.80% | 3.560% | ||
| 8 | 1.58% | 3.75% | 1.53% | 3.700% | ||
| 9 | 1.80% | 3.87% | 1.75% | 3.820% | ||
| 10 | 2.03% | 3.99% | 1.98% | 3.940% | ||
| 18 | 3.10% | 4.11% | 3.05% | 4.060% | ||
| 19 | 3.14% | 4.14% | 3.09% | 4.090% | ||
| 20 | 3.19% | 4.17% | 3.14% | 4.120% | ||
Changes in prices by considering this theta we have,
| Maturity | 2 years | 5 years | 10 years | 20 years |
| Coupon | £3.622 | £3.622 | £3.622 | £3.622 |
Previous Coupon Rate table is mentioned below,
| Maturity | 2 years | 5 years | 10 years | 20 years |
| Annual Coupon | £5 | £5 | £5 | £5 |
Full Price = £ 100 + 5 = £ 105
Full Price = £ 100 + 3.62 = £ 103.62
Holding Period Return = (103.62 – 105 / 105) * 100
Holding Period Return = - 1.31%
This is showing that the return would be in negative.
References
Charles, W & Jones, R (2007), Investment and Risk Management An Integrated Approach, Oxford University Publications pp. 65-85
Charles, W, Hill & Jones (2008), Investment and Risk Management: An Integrated Approach, John Wiley & Sons Professional Publications, pp. 75-95
Cinnamon, R & Larsen, B.H (2006), Investment and Risk Management, McGraw Hill Publications, pp. 65-75
Dag, L and Von, L (2007), Investment and Risk Management, John Wiley Sons Professional Publications
David, F (2007), Investment and Risk Management, McGraw Hill Publications, pp. 105-112
Derrick, M (1992), Investment and Risk Management, John Wiley and Sons Professional Publications, pp.11-68
Dess, G & Lumpkin, T (2007), Investment and Risk Management: Creative Strategies, McGraw Hill Publications, pp. 21-108
Drury, C (2007), Investment and Risk Management McGraw Hill Publications, pp. 65-75
Finlay, P (2000), Investment and Risk Management; An Introduction to Business, Prentice Hall Publications, pp. 65-145


