accounting analysis project
Comprehensive Analysis Project (CAP)
Overview of the Project a.k.a. CAP
The final project asks you to:
Answer general "theory" questions regarding these two companies.
Utilize the Internet as resources to understand how to generate useful indicators in the areas of Profitability, Asset Management, Financial Risk, Liquidity, and Market Strength.
Perform calculations and analyses on the financial statement data given.
Evaluate the results from your calculations and analyses and form conclusions regarding your understanding of the companies compared.
Discuss this project with others in the class or work in self-created groups (for both online and traditional classes) to discuss the project where you can learn from each other but ultimately prepare you own individual analysis. (The level of interaction between students is up to the individual student and while highly recommended, is not required.)
Learning Objectives
This case analysis has many important learning objectives which are:
to provide a review of important concepts covered in this course as well as integrating the knowledge you have gained during the semester so that you can see the "big picture".
to expose you to alternative formats for financial statements as well as terminology that may not be "just like" the textbook.
to practice your communication skills (i.e., effective reading, listening, writing, speaking).
to improve/reinforce your interpersonal skills by providing experience in working with other students as a cooperative learning team (see #5 above).
to provide a foundation in understanding and using corporate financial statements that will be useful in your future college courses and professional career, as well as from a potential investor standpoint.
(Adapted from Michael Booth’s Acct 1 Project).
Parts to the Project
The project is divided into two major sections. The first section is ratio analysis also called performance measurement. In this section, I give you a couple pages I scanned from a textbook of some of the underlying concepts of performance measurement. To provide you with details on what the ratios are and what they mean, I then included four hyperlinks to resources on the web. My suggestion is to give each link a quick overview to see which one fits your learning style. Some are “down and dirty” without much frills and others are more sophisticated and detailed. Remember that you have your own textbook chapters that you will have completed by the time you put the finishing touches on this project so you should have no shortage of resources.
Following these resources, I give you the actual textbook problem (problem 14.4) with the Income Statement and Balance Sheet. I decided to provide all of this information so that you have it all at your disposal and do not have to go “find” the information yourself. My thinking is that if I provide the information, you can spend your time on the learning aspect of this assignment. At the end of this first section is the requirements section itemizing what you need to do.
The second section which follows all of the above is a very short section where I want you to write up an analysis of a horizontal and vertical analysis problem where I give you the problem and the solution. I am looking for a write up of what the data means. My thinking on this one is that the computer will spit out the numbers and the calculation but you need to be able to interpret the results.
SECTION ONE
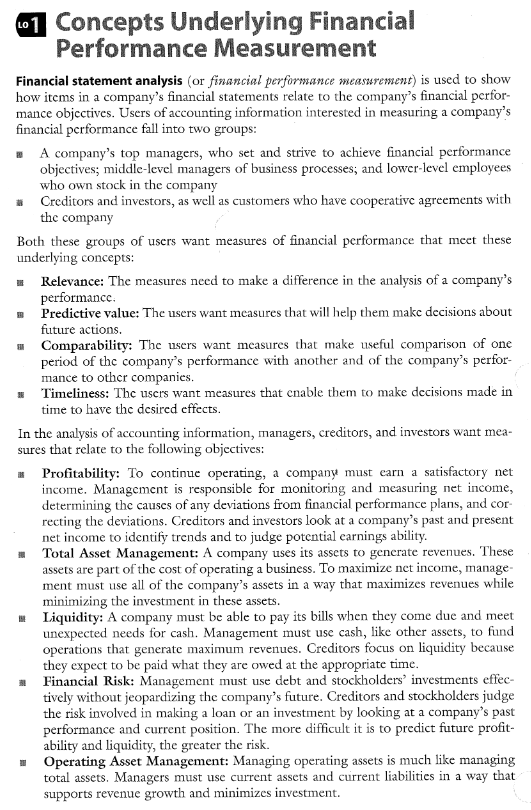
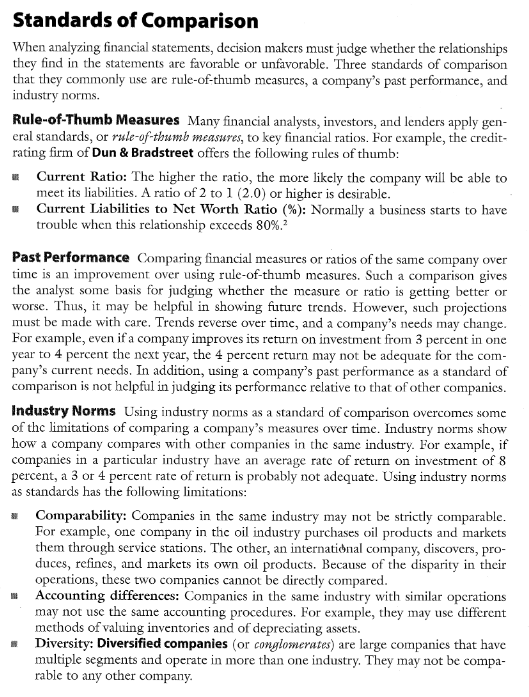
Here are 2 pages that I scanned from the Needles textbook that will give you a little background information. I hope the quality is good enough for you to read. See if they helps you understand the overall concepts of Financial Performance Measurement.
Ratios Defined – Course textbooks:
Just as a reminder: To see a list of the ratios and their formulae, see Chapter 14, page 654 in the Libby 8th edition Textbook or Chapter 23, pages 825-826 in the Price 13th editionTextbook. You will want to refer to these pages or from the Internet sites below to find the formulae needed in the requirements section below.
Financial Ratios from the Web
Here are a couple of websites that define the ratios and give you some background. Use this information to paraphrase your ratios as instructed in the requirements section below. I am looking for you being able to read the explanations from one of these websites, combine it with what you have read from your textbook and learned from doing your homework and then tell me in your own words (no direct quotes) what each ratio represents and why it is important. As you read from these websites, don’t try to understand everything that they are saying as the detail varies site by site. Focus in on 1) what the ratio is and how it is calculated; 2) what it means (needed for the paraphrase), and 3) why it is important (needed for the analysis write up). The calculations and the paraphrase is what is required for each of the first 5 requirements of section one. Your summary for section one will be the “why” part (which is requirement number 6 and is your analysis, also discussed more in the requirements section below). Here are the web links.
http://www.investopedia.com/university/ratios/. This one is great but when you first enter the site, it runs some advertisement. Just look to the top-right of the page to click the link that will skip the ads and go directly to the content. I thought this one would be the best for this project and most students so I put it first.
https://www.zionsbank.com/pdfs/biz_resources_book-6.pdf. This site is a pdf document that was created by Zion Bank, a financial institution operating in Idaho and Utah. It is my second choice of great ones to use but it is a bit long (23 pages).
http://educ.jmu.edu/~drakepp/principles/module2/fin_rat.pdf. This site is a handout from a professor at James Madison University in Virginia and contains 14 well written pages but is more like a textbook, which is good if you want the detail, but involves a bit more time and effort to get thru it.
http://www.demonstratingvalue.org/resources/financial-ratio-analysis. This site has some great information but not a lot of detail. It tells you the facts but not as knowledge friendly as other sites.
Problem 14.4 (from the Needles textbook)
FYI: I took this case study from a completely different textbook so that there is limited chance that anyone here would have the answer key to the questions asked. Here is the data you need, Problem 14.4.
P4 JD Campbell and Associates is considering an investment in the common stock of a chain of retail department stores. He has narrowed his choice to two retail companies, Heckle Corporation and Jeckle Corporation, whose income statements and balance sheets follow.


During the year, Heckle paid a total of $50,000 in dividends. The market price per share of its stock is currently $60. In comparison, Jeckle paid a total of $114,000 in dividends, and the current market price of its stock is $76 per share. Heckle had net cash flows from operations of $271,500 and net capital expenditures of $625,000. Jeckle had net cash flows from operations of $492,500 and net capital expenditures of $1,050,000. Information for prior years is not readily available. Assume that all notes payable are current liabilities and all bonds payable are long term liabilities and that there is no change in inventory.
Requirements Section One
Conduct a comprehensive ratio analysis of each company, using all available information. Compare the results. Round to one decimal place and consider changes of 0.1 or less to be indeterminate. For this section, you need to use the data given above. Show me the formula (you are welcome to copy and paste the formulae text from any source so that you can reduce the amount of typing), then show the calculation (the numbers from Problem 14.4). Next, paraphrase what the ratio means. Do this process for each of Requirements 1-5. I am looking for your understanding of the ratio and not what you can copy and paste. This format is how I will judge your understanding of the material. Expected length of the paraphrase is 2 paragraphs, not 2 sentences. If you treat this part of the project like a recipe, you should be able to efficiently complete this part of the project. The analysis in requirement #6 is the “Why” discussed above. Be sure to properly quote your paraphrase and anything that you may quote in your analysis (see the note about proper citation at the bottom of this document).
Prepare an Operating Asset Management Analysis by calculating for each company the :
a) current ratio b) quick ratio c) receivables turnover
d) day’s sales uncollected e) inventory turnover f) days’ inventory on hand
g) payables turnover h) days’ payable i) financing period
Prepare a Profitability And Total Asset Management Analysis by calculating for each company the:
profit margin b) asset turnover c) return on assets
Prepare a Financial Risk Analysis by calculating for each company the:
debt to equity ratio b) return on equity c) investing coverage ratio
Prepare a Liquidity Analysis by calculating for each company the cash flow yield
Cash flows to sales b) Cash flows to assets c) Free cash flows
Prepare An Analysis Of Market Strength by calculating for each company the:
price/earnings ratio
dividend yield
6) Once you have completed the first 5 steps, write a 1-2 page analysis of the Heckle and Jeckle corporations. Which one is better off and why? What are their similarities, differences, strengths, weaknesses, etc.? Which one should JD Campbell and Associates invest in and why? Note: This section is another opportunity where you can demonstrate your understanding of what you learned this semester so write as much as you can as long as it pertains to the project.
Some Additional Information
Suggestion: Go thru the chapters and add information that is relevant to this project. A quick scan of the chapters should create ideas that demonstrate what you have learned in this course.
When you find a formula from the Internet that is an image or difficult to copy and retain the proper format and if you have the Snipping Tool software on your computer, use it to get just the formula. I have demonstrated how to do this in the TerryTubeVideos discussed in the next section. I would suggest using Excel for all your numbers crunching, use the Paste Special (called OLE or object linking and embedding) to link your spreadsheets into Word with your analysis along with your Snipping Tool images. Again, how to do this can be found at TerryTubeVideos.
Citing your Paraphrases
Use this website to paraphrase all the ratios that you have calculated. In your analysis, be sure to properly cite your work. You can use the video I created to demonstrate how to cite in Word if you are unsure. The address for the videos is: http://www.cabrillo.edu/homepages/temullin/TerryTubeVideos.htm. I will make the screen capture videos over Spring Break ’14 so check back if you have read this before I have TerryTubeVideos completed.
SECTION TWO
To demonstrate your knowledge of Horizontal Analysis and Vertical Analysis, I am giving you a problem from the Price textbook, Problem 23-1B but not to worry, I am also giving you the solutions. My focus here is for you to do just the analysis. My thinking on this one is that the computer will spit out the calculation but you need to be able to interpret the results. Here is Price textbook Problem 23-1B (scanned) and the corresponding solution. Please realize that I am not asking you to do all the work shown below; it is already done for you thereby significantly reducing the amount of work you need to do for this section.


Requirements Section Two
The way I would attack this part of the Comprehensive Analysis Project is to first make sure you know where the percentages are coming from. Just review in your book the concepts of Horizontal and Vertical Analysis and then look at the numbers and decide based on your chapter readings and other work this semester what you would investigate if you were the CEO of the company. I am giving you this project in Word/PDF format so you can better see the numbers if you zoom in using the zoom tool in the lower right corner.
Although I could give you the original spreadsheet containing these numbers so that you can create graphs and charts to supplement your analysis, the publisher puts each character in individual columns so you cannot use it as actual numbers in Excel. You will have to do your own data entry for any graph and chart making. My expectations is to decide based on the student’s level of Excel experience to do what he/she feels is beneficial to the analysis. I will give extra credit to the latter groups for any graphs and charts that are included in the analysis.
Expected length of Section Two is a minimum of two exceptionally well written pages (three if using graphs and charts). Again, use the “what and why” format as explained in Section One. Tell me what the numbers say and why it is important. Answer questions such as what areas do the numbers show are of concern, what changes should the CEO make or look into, etc. As in any analysis, you can also discuss what is good and is therefore probably not a concern to the CEO. Use your textbook to help you develop your analysis so that it is meaningful.


