Assignment 3
Assume that the low-calorie frozen, microwavable food company from Assignments 1 and 2 wants to expand and has to make some long-term capital budgeting decisions. The company is currently facing increases in the costs of major ingredients.
Write a six to eight (6-8) page paper in which you:
Outline a plan that managers in the low-calorie, frozen microwaveable food company could follow in anticipation of raising prices when selecting pricing strategies for making their products response to a change in price less elastic. Provide a rationale for your response.
Examine the major effects that government policies have on production and employment. Predict the potential effects that government policies could have on your company.
Determine whether or not government regulation to ensure fairness in the low-calorie, frozen microwavable food industry is needed. Cite the major reasons for government involvement in a market economy. Provide two (2) examples of government involvement in a similar market economy to support your response.
Examine the major complexities that would arise under expansion via capital projects. Propose key actions that the company could take in order to prevent or address these complexities.
Suggest the substantive manner in which the company could create a convergence between the interests of stockholders and managers. Indicate the most likely impact to profitability of such a convergence. Provide two (2) examples of instances that support your response.
Use at least five (5) quality academic resources in this assignment. Note: Wikipedia does not qualify as an academic resource.
Your assignment must follow these formatting requirements:
Be typed, double spaced, using Times New Roman font (size 12), with one-inch margins on all sides; citations and references must follow APA or school-specific format. Check with your professor for any additional instructions.
Include a cover page containing the title of the assignment, the student’s name, the professor’s name, the course title, and the date. The cover page and the reference page are not included in the required assignment page length.
The specific course learning outcomes associated with this assignment are:
Propose how differences in demand and elasticity lead managers to develop various pricing strategies.
Analyze the economic impact of contracting, governance and organizational form within organizations.
Use technology and information resources to research issues in managerial economics and globalization.
Write clearly and concisely about managerial economics and globalization using proper writing mechanics.
Below is information from the 1st 2 papers
Paper Assignment 1
Compute the elasticities for each independent varianble
Considering that the quantity demand (QD) in the regression equation is the dependent variable, its value is a function of the independent variables in the equation. As such, the following is the value of QD in this case;
QD = - 5200 - 42P + 20PX + 5.2I + 0.20A + 0.25M
But,
P= 500, C=600, I=5,500, A=10,000, and M=5000
QD= - 5200 – 42(500) + 20(600) + 5.2(5500) + 0.20(10000) + 0.25(5000) = 17,650
The co-efficient values of the independent variables represent their respective ratios of the percentage change in QD to the percentage changes in the variables i.e. (∆Q/∆ respective independent variables). Elasticity in of the various independent variables is computed using the following formula;
According to Argy (2013), Independent variable elasticity = (independent variable/QD) * (∆Q/∆ respective independent variable)
| Independent Variable | Initials | Elasticity |
| Price | Price Elasticity of Demand = (P/Q) (∆Q/∆P) | |
| Leading competitor’s price | PX | Cross Elasticity of Demand i.e. Competitor’s price (PX) Elasticity of Demand = (PX/Q) * (∆Q/∆PX) |
| Monthly advertising costs | Advertising Elasticity of Demand (EA) = (A/Q) * (∆Q/∆A) | |
| No. Of microwave units sold in the SMSA supermarkets | Microwave units (M) Elasticity of Demand = (M/Q) * (∆Q/∆M) | |
| Per capita income | Per capita income (I) Elasticity of Demand (E) = (I/Q) * (∆Q/∆I) |
Determine the implications for each of the computed elasticities for the business in terms of short-term and long-term pricing strategies.
Elasticity indicates the impact that changes in factors affecting demand would have on the quantity demanded (Mankiw, 2014). A negative value of elasticity indicates an opposite relationship between demand and the particular factor affecting demand. A positive value, on the other hand, indicates a direct relationship. -1.19 price elasticity indicates that a 1% increase in the price of the product will reduce the quantity demanded by 1.19%, therefore, there is an opposite relationship between the product price and its demand. To maximize the volume of the product sales, the pricing strategies both in the short run and in long term should be considered by attempts to lower the price of the product as this will result to increase in its demand.
The cross elasticity is 0.68 an indication that a 1% increase in the leading competitor’s price for then service will result to 0.68% increase in the quantity of the product sold by the organization in focus in this case. Therefore, both in the short run and in the long run the organization should adjust the price of the product accordingly depending on the movement of price by the competitor.
The elasticity of demand for the monthly advertising costs is 0.11 a sign that a 1% increase in the advertising costs will result to 0.11% increase in the quantity of the product demand. As a result, advertising is having a positive impact on the demand for the product and not surviving other relevant factors it would be reasonable to increase the marketing budget. However, the increased marketing costs should not be shifted to the customers in form of price increase as it has been shown that there is an converse relationship between product price and its quantity demanded. The per capita income elasticity of demand is 1.62. It is an indication that a 1% increase in per capita income would trigger 1.62 % increase in quantity demanded. In the long run the organization should adjust the price of the product accordingly with changes in the per capita income of the target customers. A decrease in per capita income should see the organization adjust its price downwards and vice versa. Lastly, the organization should adjust its price appropriately with the changes in the number of microwave units sold in the SMSA supermarkets.
Recommend whether you believe that this firm should or should not cut its price to increase its market share.
It can be noted that, of the five factors affecting demand reviewed in this case two have the highest impact on the quantity demanded. Per capita income and product price are the two factors whose impact on the quantity of the product demanded is significant. However, it is worth noting that the scope of control of the per capita income is beyond the company and to influence demand the organization can only adjust its price with the changes in per capita income. The organization can, however, adjust prices to influence demand. It has been revealed that there is a more than proportionate increase in demand with a decrease in product price and it is advised that the organization cuts its price to influence demand positively. It is important that the organization takes into account other relevant factors such as the need to breakeven prior to causing the price reduction strategy (Weygandt, 2015).
Assume that all the factors affecting demand in this model remain the same, but that the price has changed.
A).
QD = - 5200 - 42P + 20PX + 5.2I + 0.20A + 0.25M
P= 500, C=600, I=5,500, A=10,000, and M=5000
QD= - 5200 – 42(P) + 20(600) + 5.2(5500) + 0.20(10000) + 0.25(5000)
QD= - 5200 – 42(P) + 43850
The following table shows how QD will change with changes in price:
| Price | QD |
| 100 | 34450 |
| 200 | 30250 |
| 300 | 26050 |
| 400 | 21850 |
| 500 | 17650 |
| 600 | 13450 |
The chart shows the demand curve:

B).
Given that MC/supply function is Q = -7909.89 + 79.1P, the supply function obtained through integration is S= 7909.89P+158.2P2-5200
The following table shows the values of supply:
| Price (p) | 7909.89p | P2 | 158.2p2 | Constant ( C) | Supply (S) |
| 100 | 790989 | 10000 | 1582000 | -5200 | 2367789 |
| 200 | 1581978 | 40000 | 6328000 | -5200 | 7904778 |
| 300 | 2372967 | 90000 | 14238000 | -5200 | 16605767 |
| 400 | 3163956 | 160000 | 25312000 | -5200 | 28470756 |
| 500 | 3954945 | 250000 | 39550000 | -5200 | 43499745 |
| 600 | 4745934 | 360000 | 56952000 | -5200 | 61692734 |
The table has been obtained by filling in the values of the unknowns in the equation. The following chart shows a corresponding supply curve on the same graph with the demand curve:

C).
The point of equilibrium is that point at which demand and supply are equal. In the above graph, it is the point at which the supply and demand curves intersect. It be approximated to be around 448.
D).
Crucial factors that would cause a rightward shift in the demand curve are factors related to increase in price and reduction in demand. On the other hand, factors that would trigger a leftward shift in demand are factors that would cause an increase in demand. The crucial factors of movement in the demand curve can be drawn from the elasticities of the independent variables in the regression equation. For instance, with price elasticity being -1.19, an increase in price would cause a rightward shift in the demand curve since it would result to reduction in the quantity of the product demanded.
The per capita income elasticity is positive. As a result, an increase in per capita income would trigger a leftward shift in the demand curve since it would cause an increase in demand. It is, however, worth noting that for the leftward shift to occur the price must reduce. For all the independent variables in the regression equation, it is only price whose changes would trigger an automatic shift of the demand curve. For the rest of variables to trigger shifts in the demand curve price must change accordingly.
Paper Assignment 2
Easy Living Foods
In this particular assignment, I will use the regression results and the other computations from the previous assignment in order to determine the market structure in which a low-calorie frozen, microwave Food Company operates. Easy Living Foods is the leading competitors in the industry and it will be very important to note their pricing strategies, profitability and their relationships. The market structure has been found to be perfectly competitive QD=QS. It is therefore very important to set an ideal price using this particular scenario. We come up with the regression equation which is derived as QD = 20,000 - 10P + 1500A + 5PX + 10 I (Buteux, 1963).
This model is able to explain the demand in which the R2 is considered to be very high and the possible calculation of the advertisement elasticity brings out the 0.73 figure. When we look at this equation, we realize that demand is purely dependent on advertisement of products and services. We realize that there cannot be a perfectly competitive market since there is no role an advert can play in this market (Buteux, 1963). It therefore suggests that there is even no likelihood of a monopolistic competition since it does not lay off a budget for advertisement of their products.
When looking at the price of other products, what creates a demand function also depends on the price of a given product and when looking at this equation, we find that there can never be a monopolistic market structure in this situation. With all this possibilities in mind, we come to a conclusion that the two possible markets are oligopolistic and monopolistically competitive markets. Therefore, in a monopolistically competitive market, making an advert is very much vital for product development as opposed to an oligopolistic structure (Massel, 1962). There also seems to be a lot of product differentiation in a monopolistically competitive market and in this situation, we realize that many firms are producing the low-calorie microwavable foods though all of them practice this significant feature. The main reason for competition will be product differentiation as they promote their own brand to increase the market share. We therefore realize that this firm was solely a monopolistically competitive market.
The major short run and long run costs have to be outlined so as to determine whether frozen microwaveable food company is able to make major decisions in the industry. There can be a possibility of this company to earn supernatural profits and even incur losses as well as operate at break even when a monopolistic competitive firm operates in the short run. Other firms will be highly attracted when it earns such economic profits. This will prompt many firms to enter the industry and be able to make products that will suit the needs of their consumers thereby creating customer satisfaction. It will then be realized that the proportionate demand curve will shift to the left. However, it can shift to the right if the firm can make losses. There will be continuity of this process until a given firm will realize that the total costs and total revenue are the same. It will be noted that after some good period of time, each firm in the industry will be able to earn a normal profit (Scherer & Ross, 1990).
The equilibrium in the long run will be as follows; 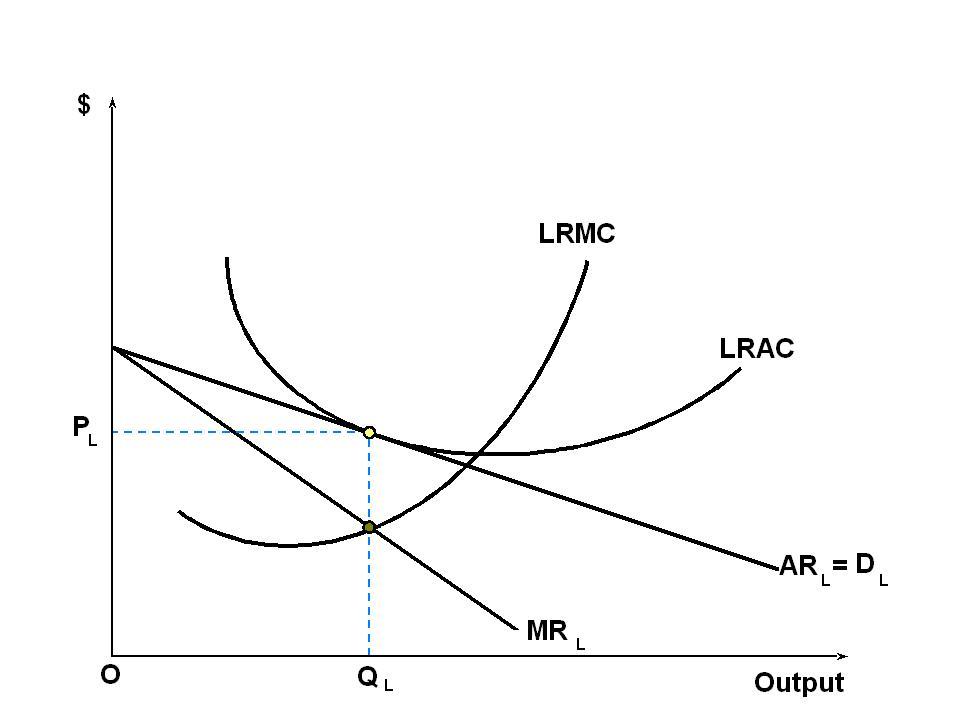
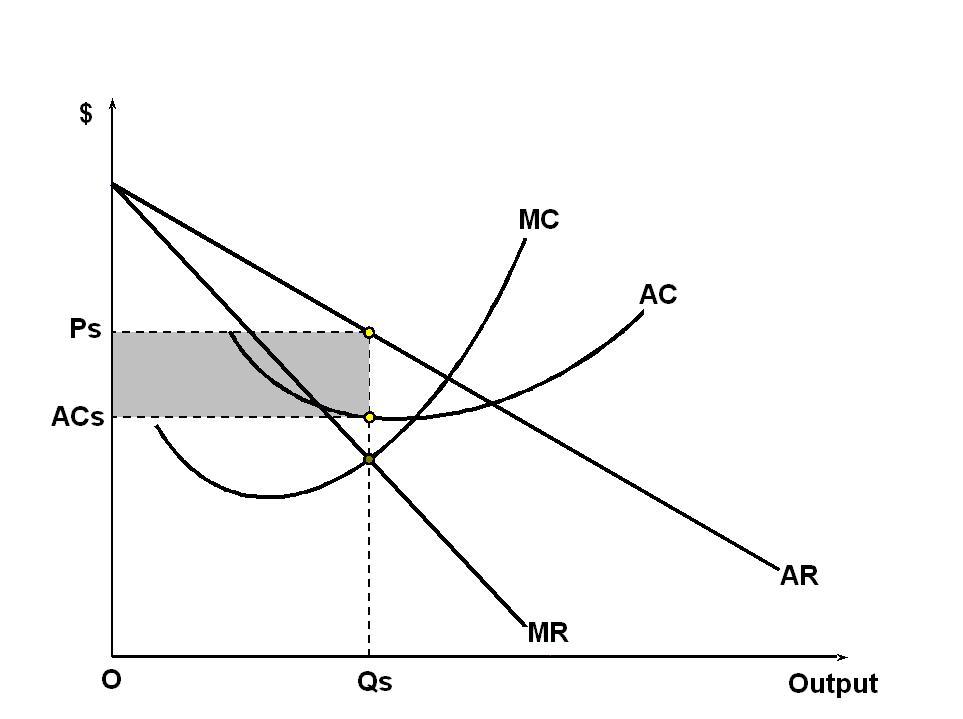
The equilibrium in the short run will also be as in the diagram below;
The main characteristics of this market are the use of ads which will look into it that more customers have to be attracted by it. This will in turn increase the budget for the expenses therefore the market share of this organization will be severely increased which is very important for its profitability and production. Having a great market power therefore makes a monopolistic competitive firm to charge tremendously higher prices for products than the marginal costs which is mainly due to its authority in the market. Market power is determined according to Lerner’s index which can be denoted as
Lerner’s index (L) = 
= -  [Where, e = own price elasticity] (Panzar & Rosse, 1987).
We find that the price elasticity of demand is inversely related to Lerner’s index and that the power of the market can only be determined by the greatness in the degree of product differentiation. This organization is therefore recommended to use a strong product differentiation strategy so as to be successful in the industry as well as maximize on production and profits (Scherer & Ross, 1990).
According to (Scherer & Ross, 1990), earning supernatural profits can be very much helpful for a given firm since when all things remain constant. It might be making twice as much as other firms. However, the demands for low-calorie microwaveable foods are increasing due to the lifestyles people lead. Therefore, Easy Living Food Company was mainly founded in order to provide the world with foods without having to spend a lot of time in cooking.
The demand has increased much which has made other firms in the industry to focus on producing products of the same value. Varieties of products have been produced making product differentiation very difficult. Many companies cannot enjoy in the comfort zones since some other great challenges are coming up to counter. Products have become similar and using Lerner’s value, we will find that if falls to lesser value. With much competition, the influence of the market is drastically reduced and no firm can actually dominate the market with their own prices. It is then noted that a perfectly competitive market structure is formed (Scherer & Ross, 1990).
In this study, the initial demand is at 160000 while the price elasticity of demand is at a value of (0.60) and we know that the determination of market prices and quantities is where demand and supply meet in the equilibrium (Beattie, Taylor & Watts, 1985). Affecting a market price under this market structure is not possible and all firms will have to comply with the set price and also have to sell their goods and services according to what the price really dictates. Consumers will shift their preferences if a certain firm decides to set its own market price and it will surely experience low demand for its products and services.
Discontinuing operations will happen under some various circumstances. A firm can actually incur great losses when the prices of its products fall below the marginal cost and production level goes down instantly. A firm can then close completely when the costs and revenues level up and still the prices of its products fall again. This will mean that the company reaches breakeven point. In the short run, the firm will obviously incur a fixed cost. This means that the outputs cannot be changed by any activity but the production can still continue until the firm management becomes satisfied that all the fixed costs have been recovered (Scherer & Ross, 1990).
Fixed costs are absent in the long run and breakeven point by design becomes the minimum point in the average cost curve. Finding output involves equating MC with ATC since in the curve MC cuts at the ATC at the lowest point. We are then able to note when price falls beyond this minimum point from the deduction in the curve which will make a firm to stop all the production processes. Reducing the cost of production is important since a company will come up with a cost-effective method to be much productive than other firms in the industry by enjoying an advantage of cost (Beattie, Taylor & Watts, 1985).
One pricing policy that will enable low-calorie, frozen microwaveable food company to be able to maximize profits is the use of MR=MC. A company can maximize profits by equating the MR=MC where profit maximization can be expressed as follows;
Profit (π) = Total Revenue (TR) – Total Cost (TC)
= P×Q – TC
According to the FOC of profit maximization, we get
 =
=  -
-  [Here P is not fixed]
= MR – MC = 0
Therefore MR = MC (Panzar & Rosse, 1987).
This expression will help to equate the marginal revenue with the marginal costs to determine profits and also be able to determine if a firm can enjoy supernatural profits. Maintaining profits and monopoly in business involves incurring some major costs so that they can restrict entry into this industry. Many firms will therefore be attracted to this industry in the short run and therefore, there will be a rise in market output. We can also be able to notice the fall in market price and when the whole process is completed, and then things can go back to normal. This will cause every firm to handle the equity in cost and revenues and monopoly sustainability will never be an easy task in this situation (Panzar & Rosse, 1987).
However, in the long run when many firms join the market, it will then turn to be a monopolistically competitive market whereby Fast Foods will be able to indulge in product differentiation as well as campaigns through adverts in order to remain relevant in the market and continue having a good customer base. The market share of this firm will go up if a good number of customers are attracted to their products and this will lead to profit growth and customer satisfaction which is very crucial for the firm. In the short run, a firm is only liable to change the input that is variable so as to make changes to the profits and outputs. Reducing the cost of production is therefore important for this firm by coming up with important cost effective methods that will be able to reduce the costs (Dixit & Stiglitz, 1977).
In conclusion, we have used the regression results to determine how Easy Living Foods operates by taking note of the pricing strategies and even monitoring their relationships in the industry. We realize that in the monopolistically competitive market, the determination of the effectiveness of this market structure for the operations of the company are very much important as well as looking analysis of the long and short run cost functions that determine its survive in the market. The possibilities under which this company cans top operations are also determined and also looked into one policy that will enable it to maximize profits (Beattie, Taylor & Watts, 1985).


