Additional documents - For A-Plus only
Decisions Made for Period 2023
2017 T1 - BUS303 Business Project - Multi-Player World 5 - GR Bike Tech - Period 2023
------------------------------------------------------------
DEBT DECISIONS
------------------------------------------------------------
Debt
| Long Term Debt Raised |
| $0 |
| Long Term Debt Repaid | $3,000,000 |
------------------------------------------------------------
EQUITY DECISIONS
------------------------------------------------------------
Equity
| Equity Raised |
| $0 |
| Equity Repurchased | $0 | |
| Dividend Per Share | $5.07 |
------------------------------------------------------------
PRODUCT MARKETING DECISIONS
------------------------------------------------------------
| Product |
| Adv5 |
| Blazing GR |
| GR Youth |
| adv7 |
| State | Normal | Normal | Normal | Normal | ||||
| Design Project Name | Adv5Proj | LiquidLightning_2020 | Coolio_2021 | DirtTracker_2022 | ||||
| Retail Price | $655 | $1,900 | $350 | $655 | ||||
| Advertising Expenditure | $225,000 | $150,000 | $440,000 | $650,000 | ||||
| PR Expenditure | $45,000 | $375,000 | $65,000 | $0 | ||||
| ForecastSales (Units) | 13,000 | 4,100 | 21,000 | 13,100 | ||||
| PlannedProduction (Units) | 8,000 | 11,300 |
------------------------------------------------------------
PRODUCT MARKETING - MEDIA DECISIONS
------------------------------------------------------------
| Product |
| Adv5 |
| Adv5 |
| Adv5 |
| Blazing GR |
| Blazing GR |
| Blazing GR |
| GR Youth |
| GR Youth |
| GR Youth |
| adv7 |
| adv7 |
| adv7 |
| Media | TV | Internet | Magazines | TV | Internet | Magazines | TV | Internet | Magazines | TV | Internet | Magazines | ||||||||||||
| Product Advertising | $50,000 | $25,000 | $150,000 | $20,000 | $52,000 | $78,000 | $350,000 | $35,000 | $55,000 | $150,000 | $100,000 | $400,000 | ||||||||||||
| Product PR | $10,000 | $10,000 | $25,000 | $75,000 | $100,000 | $200,000 | $30,000 | $20,000 | $15,000 | $0 | $0 | $0 |
------------------------------------------------------------
PRODUCT MARKETING - PRODUCT DEVELOPMENT DECISIONS
------------------------------------------------------------
| Project Name |
| Style |
| Technical Specs |
| Variable Prodn Cost |
| Expenditure |
------------------------------------------------------------
FIRM MARKETING DECISIONS
------------------------------------------------------------
| Brand Advertising |
| $200,000 |
|
|
------------------------------------------------------------
FIRM MARKETING - DISTRIBUTION DECISIONS
------------------------------------------------------------
|
|
| Bike Shops |
| Sports Stores |
| Discount Stores |
| Extra Support | $0 | $0 | $0 | |||
| Retail Margin | 25% | 25% | 25% |
------------------------------------------------------------
CAPACITY PLANNER DECISIONS
------------------------------------------------------------
| Capacity Increase |
| 0 SCU |
| Capacity Decrease | 22000 SCU | |
|
| ||
| Efficiency Improvement | $1,000,000 | |
| Quality Improvement | $0 |
------------------------------------------------------------
PRODUCTION PLANNING DECISIONS
------------------------------------------------------------
| Product |
| Adv5 |
| Blazing GR |
| GR Youth |
| adv7 |
| Design Project Name | Adv5Proj | LiquidLightning_2020 | Coolio_2021 | DirtTracker_2022 | ||||
| ForecastSales (Units) | 13,000 | 4,100 | 21,000 | 13,100 | ||||
| PlannedProduction (Units) | 8,000 | 11,300 |
------------------------------------------------------------
------------------------------------------------------------
Market Summary (All Product Details)
2017 T1 - BUS303 Business Project - Multi-Player World 5 - Period 2023
This report shows various information for all products on the market.
Most values are reported as a rating between 0.00 and 1.00, where 1.00 is the highest possible rating.
Every segment has different preferences, and 1.00 is rarely the optimal value to aim for.
Road Segment
| Product Name |
| Firm |
| Sales |
| Lost Sales* |
| Market Share* |
| Retail Price |
| Awareness |
| PR |
| Distribution |
| Quality |
| Prev Delivery* |
| Current Delivery* |
| Product Specs |
| Fist | Ironfist Bikes | 7,395 | 21.5% | $2,050 | 0.31 | 0.54 | 0.73 | 0.91 | 1.00 | 1.00 | 0.75 | |||||||||||||
| Blazing GR | GR Bike Tech | 3,705 | 0 | 10.8% | $1,900 | 0.22 | 0.24 | 0.53 | 0.87 | 1.00 | 1.00 | 0.60 | ||||||||||||
| Bullet | Mt.Everest | 7,344 | 21.3% | $1,980 | 0.29 | 0.49 | 0.69 | 0.93 | 1.00 | 1.00 | 0.75 | |||||||||||||
| Pioneer | GHN Bikes | 4,337 | 12.6% | $2,120 | 0.32 | 0.34 | 0.49 | 0.93 | 1.00 | 1.00 | 0.60 | |||||||||||||
| roadx | Bridge Bike Inc | 4,291 | 12.5% | $2,200 | 0.25 | 0.45 | 0.35 | 0.90 | 1.00 | 1.00 | 0.60 | |||||||||||||
| SAS RC | SAS BIKES | 7,333 | 21.3% | $1,950 | 0.29 | 0.49 | 0.68 | 0.92 | 1.00 | 1.00 | 0.75 | |||||||||||||
| Average (Weighted) |
| 34,405 | 100.0% | $2,025 | 0.28 | 0.45 | 0.61 | 0.91 | 1.00 | 0.70 |
Mountain Segment
| Product Name |
| Firm |
| Sales |
| Lost Sales* |
| Market Share* |
| Retail Price |
| Awareness |
| PR |
| Distribution |
| Quality |
| Prev Delivery* |
| Current Delivery* |
| Product Specs |
| Adv1 | Mt.Everest | 35,924 | 21.3% | $710 | 0.55 | 0.29 | 0.68 | 0.93 | 1.00 | 1.00 | 0.82 | |||||||||||||
| Adv2 | GHN Bikes | 22,286 | 13.2% | $719 | 0.39 | 0.07 | 0.48 | 0.93 | 1.00 | 1.00 | 0.82 | |||||||||||||
| Adv3 | Ironfist Bikes | 35,978 | 21.3% | $721 | 0.57 | 0.32 | 0.70 | 0.91 | 1.00 | 1.00 | 0.82 | |||||||||||||
| Adv4 | Bridge Bike Inc | 15,018 | 8.9% | $725 | 0.40 | 0.02 | 0.31 | 0.90 | 1.00 | 1.00 | 0.60 | |||||||||||||
| Adv5 | GR Bike Tech | 11,562 | 0 | 6.9% | $655 | 0.20 | 0.02 | 0.53 | 0.87 | 1.00 | 1.00 | 0.60 | ||||||||||||
| Adv6 | SAS BIKES | 35,510 | 21.1% | $715 | 0.56 | 0.30 | 0.68 | 0.92 | 1.00 | 1.00 | 0.82 | |||||||||||||
| adv7 | GR Bike Tech | 12,396 | 0 | 7.3% | $655 | 0.22 | 0.03 | 0.53 | 0.87 | 1.00 | 1.00 | 0.60 | ||||||||||||
| Average (Weighted) |
| 168,674 | 100.0% | $708 | 0.47 | 0.21 | 0.60 | 0.91 | 1.00 | 0.77 |
Youth Segment
| Product Name |
| Firm |
| Sales |
| Lost Sales* |
| Market Share* |
| Retail Price |
| Awareness |
| PR |
| Distribution |
| Quality |
| Prev Delivery* |
| Current Delivery* |
| Product Specs |
| Baby stone | Mt.Everest | 45,788 | 25.4% | $352 | 0.57 | 0.42 | 0.72 | 0.93 | 1.00 | 1.00 | 0.75 | |||||||||||||
| Wolverine | GHN Bikes | 27,292 | 15.2% | $370 | 0.50 | 0.05 | 0.54 | 0.93 | 1.00 | 1.00 | 0.60 | |||||||||||||
| SAS YC | SAS BIKES | 45,096 | 25.1% | $355 | 0.57 | 0.46 | 0.71 | 0.92 | 1.00 | 1.00 | 0.75 | |||||||||||||
| F1 | Ironfist Bikes | 43,948 | 24.4% | $353 | 0.55 | 0.37 | 0.71 | 0.91 | 1.00 | 1.00 | 0.75 | |||||||||||||
| GR Youth | GR Bike Tech | 17,868 | 0 | 9.9% | $350 | 0.25 | 0.01 | 0.50 | 0.87 | 1.00 | 1.00 | 0.60 | ||||||||||||
| Average (Weighted) |
| 179,992 | 100.0% | $356 | 0.52 | 0.32 | 0.67 | 0.92 | 1.00 | 0.71 |
Notes:
1. 'Prev Delivery' refers to the Delivery rating for this product in the previous period.
It is shown because the simulation used this figure when calculating product demand for the current period.
Your customers' future Delivery expectations are based on your past Delivery performance,
not your current Delivery performance.
2. 'Current Delivery' refers to the Delivery rating for this product in the current period.
This value will be used in the demand calculations for the next rollover.
3. 'Lost Sales' tells you how many more units each product would have sold if
the Firm had manufactured enough to satisfy demand. If Lost Sales is zero
for a given product, then all the demand for that product was satisfied this period.
4. 'Market Share' is share of Total Market Demand (in units) for all products. This includes any Lost Sales.
Industry Benchmark Report
2017 T1 - BUS303 Business Project - Multi-Player World 5 - Period 2023
|
|
| Mt.Everest |
| GHN Bikes |
| Ironfist Bikes |
| Bridge Bike Inc |
| GR Bike Tech |
| SAS BIKES |
| Financial Results |
|
|
|
| ||||||||
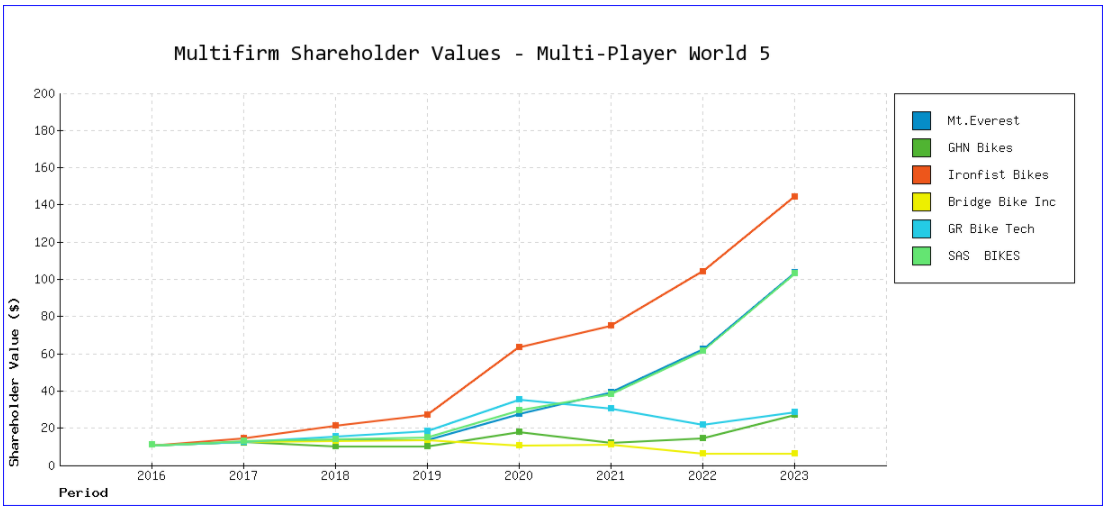
| Shareholder Value (SHV) | $103.80 | $27.45 | $144.78 | $6.58 | $28.99 | $103.27 | ||||||
| Cumulative Change in SHV | 832% | 146% | 1200% | (41%) | 160% | 827% | ||||||
|
|
|
|
|
| ||||||||
| Share Price | $89.06 | $21.68 | $116.03 | $6.48 | $23.01 | $88.51 | ||||||
| Dividend Per Share | $7.59 | $0.00 | $12.60 | $0.10 | $5.07 | $7.67 | ||||||
|
|
|
|
|
| ||||||||
| Number of Shares | 800,000 | 1,000,000 | 800,000 | 919,893 | 1,245,733 | 800,000 | ||||||
| Market Capitalization | $71,250,821 | $21,680,127 | $92,822,655 | $5,960,880 | $28,667,352 | $70,810,932 | ||||||
| Total Shareholder Value | $83,042,821 | $27,451,827 | $115,945,593 | $6,052,869 | $35,890,719 | $82,614,132 | ||||||
|
|
|
|
|
| ||||||||
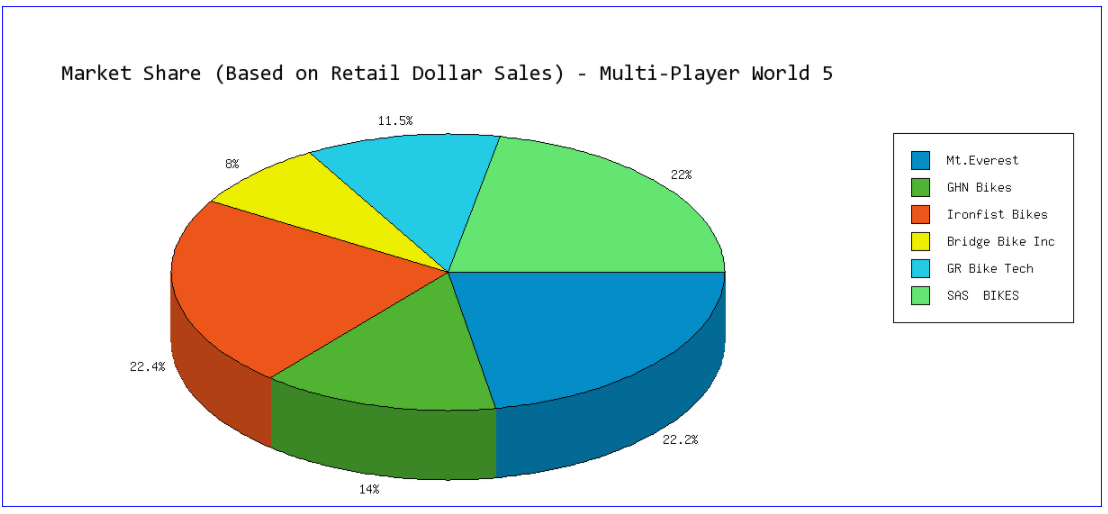
| Retail Sales | $56,164,536 | $35,316,114 | $56,613,532 | $20,328,250 | $28,985,790 | $55,698,080 | ||||||
| Wholesale Sales | $42,123,402 | $26,133,924 | $42,460,149 | $14,339,766 | $21,739,342 | $41,773,560 | ||||||
| Gross Margin | $29,993,824 | $14,973,805 | $30,541,513 | $8,170,424 | $10,361,724 | $30,085,844 | ||||||
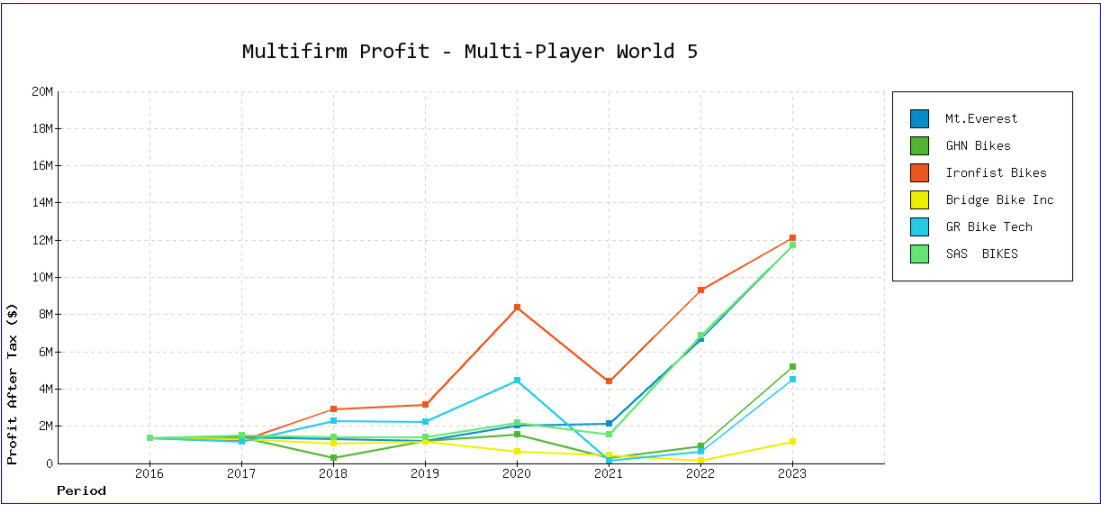
| Profit After Tax | $11,744,710 | $5,214,698 | $12,141,753 | $1,204,423 | $4,535,565 | $11,742,205 | ||||||
|
|
|
|
|
| ||||||||
| Number of Shares | 800,000 | 1,000,000 | 800,000 | 919,893 | 1,245,733 | 800,000 | ||||||
| Earnings per Share | $14.681 | $5.215 | $15.177 | $1.309 | $3.641 | $14.678 | ||||||
|
|
|
|
|
| ||||||||
| Cash | $14,468,756 | $9,283,019 | $12,832,438 | $8,337,652 | $15,835,132 | $14,395,264 | ||||||
| Net Assets | $14,140,760 | $9,860,738 | $13,365,917 | $8,804,204 | $18,859,310 | $13,922,672 | ||||||
| D/E Ratio (book equity) | 0.00 | 0.00 | 0.00 | 0.00 | 0.00 | 0.00 | ||||||
|
|
|
|
|
| ||||||||
| Customer Satisfaction |
|
|
|
| ||||||||
| Wholesale Sales | $42,123,402 | $26,133,924 | $42,460,149 | $14,339,766 | $21,739,342 | $41,773,560 | ||||||
| Brand Advertising | $1,150,000 | $1,000,000 | $1,130,000 | $900,000 | $200,000 | $1,185,000 | ||||||
| Brand Awareness Index | 58% | 59% | 59% | 51% | 29% | 58% | ||||||
| Total Product Advertising | $6,150,000 | $3,090,000 | $6,200,000 | $2,215,000 | $1,465,000 | $6,250,000 | ||||||
| Total Product PR | $5,200,000 | $2,670,000 | $5,045,000 | $2,830,000 | $485,000 | $5,180,000 | ||||||
| Average Retailer Margin | 25% | 26% | 25% | 29% | 25% | 25% | ||||||
| Distribution Channel Support | $353,201 | $303,906 | $365,992 | $299,373 | $256,040 | $348,095 | ||||||
|
|
|
|
|
| ||||||||
| Internal Results |
|
|
|
| ||||||||
| Capacity (SCU) | 43,000 | 21,000 | 50,000 | 13,500 | 18,000 | 42,100 | ||||||
| Wastage | 7% | 3% | 9% | 24% | 3% | 8% | ||||||
| Idle Time | 7% | 5% | 21% | 0% | 58% | 5% | ||||||
| Efficiency Index | 0.92 | 0.97 | 0.89 | 0.76 | 0.93 | 0.91 | ||||||
| Quality Index | 0.93 | 0.93 | 0.91 | 0.90 | 0.87 | 0.92 | ||||||
| No. of Products | ||||||||||||
|
|
|
|
|
| ||||||||
| Innovation and Learning |
|
|
|
| ||||||||
| Process (Quality / Efficiency) | $700,000 | $2,000,000 | $300,000 | $315,000 | $1,000,000 | $400,000 | ||||||
| No. of Product Devpts (2023) | ||||||||||||
| No. of Product Devpts (Total) | ||||||||||||
| Demand Forecast Accuracy | 96% | 96% | 90% | 93% | 88% | 98% |