Help! Catch up a missed assignment
William Shirley
Robert Bacchus
Financial Management
August 14, y
Verizon Communication (VZ)
A look at the financial ratios that make them tick:
After reviewing the information in my reading regarding the 5 types of ratios that are best for determining the financial health of an organization when examining the fundamentals of the organization. I decided to implement a table to make the information outlined easier to digest. In this paper I will also answer the question; “what do my findings tell me?”.Furthermore I will examine the overall health of the organization as well as how it is performing in comparison to the other 17 competitors within the company’s industry.
There are five specific ratios that I calculated when compiling my research they are : Current Ratio, Fixed Asset Turnover Ratio, The Debt Ratio, The Basic Earning Power Ratio, & Return on Assets. The current ratio is a measure of how well a company is utilizing its assets and high current ratio relative to your competitors isn't something that you want to aim for. A High current ratio tells the investor or analyst looking at the financials that the company may have cashflow tied up in non-productive assets, or perhaps there is an inventory issue where the company has more inventory stockpiled that they aren't turning over as quickly as they should. Below you will find that in the graph, the current ratio is depicted as the red line, it seems to be pretty much straight, however there was a dip in this ratio in 2015 this is nothing to be alarmed about with this company. Verizon had a major push for growing their subscriber base and it is due to this reason that we see the small dip. (VZ) still operates within the average range for their prospective industry.
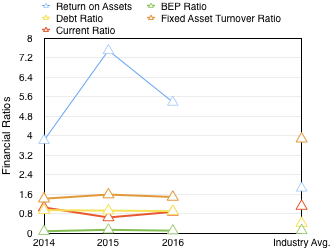 The fixed asset turnover ratio is the next ratio I will discuss. This ratio is a measure of how efficiently the company is using its plants and equipment and any other fixed assets that it owns, it is a ratio of sales to net fixed assets. It is important to know with this ratio that companies that have excessive growth in their assets faster than they can generate sales will show a decline in their asset turnover. Ultimately you want a low ratio with this but still steadily inclining, this would be a sign of financial strength for the organization. This ratio is denoted as the brown data set.
The debt to income ratio or as it is better known as, the debt ratio, measures the percentage of funds that are provided by current liabilities and long-term debt. In other words, what percentage of assets are financed through debt. The company watches this number to ensure that there isn't too much debt on the books. As denoted in yellow on the graph, this ratio stays pretty much the same over the years and isn't affected by external forces often enough that it cannot be controlled and monitored.
Finally return on assets, this ratio is usually shown as a percentage and is a direct reflection as to how effective the management has been is utilizing the companies many assets to generate a profit. The better the return (ROA), than the more efficient management is in using its entire asset base where it is needed. As denoted on the graph you can see there is a huge spike in 2015, mainly due to the sale that Verizon posted to Frontier communications and effectively unloading their entire landline division, this was compounded with subscriber base increases in the first two quarters of 2016.
Works Cited
Brigham, Eugene F. (2009). Financial Managment: Theory and Practice, 13e (13th ed.). Mason, OH: South-Western Cengage Learning.
Moneycontrol.com. (2017). Retrieved May 13, 2017, from http://www.moneycontrol.com/financials/mobiletelecommunication/ratios/MT9.
Gurufocus.com. (2017). Retrieved May 13, 2017, from https://www.gurufocus.com/term/Total+Current+Liabilities/VZ/Total-Current-Liabilities/Verizon-Communications-Inc.


