Based on pages 776-785 in your textbook, calculate one ratio from each of the following groups (three ratios total) for 2018 for Smart Touch Learning:
6-1 Discussion: Financial Statement Analysis
Based on pages 776-785 in your textbook, calculate one ratio from each of the following groups (three ratios total) for 2018 for Smart Touch Learning:
Ability to Pay Current Liabilities
Current Ratio
Cash Ratio
Ability to Pay Long-Term Debt
Debt Ratio
Debt-to-Equity Ratio
Profitability
Profit Margin Ratio
Rate of Return on Total Assets
What do these results tell you? How will you use this information in planning and decision making?
Refer to these comparative financial statements to help you work through this discussion. 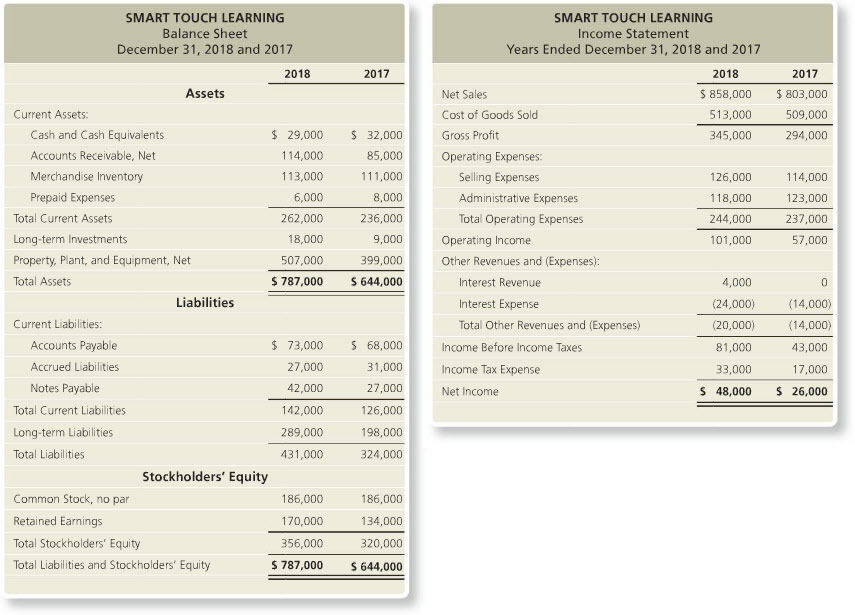
Ability to Pay Current Liabilities:
Current ratio = total current assets / total current liabilities
= 262,000 /142,000
= 1.85
The current ratio is related with the ability to pay current liabilities and helps investors/ creditors understand the liquidity of a company and how easily that company will be able to pay off its current liabilities (Miller-Nobles, 2016). This ratio expresses a firm's current debt in terms of current assets and as above, the current ratio of 1.85 means that Smart Touch has 1.85 times more current assets than current liabilities. A higher current ratio is always more favorable than a lower current ratio because it shows the company can more easily make current debt payments. This is an important measure of liquidity because short-term liabilities are due within the next year. In addition, GAAP requires that companies separate current and long-term assets and liabilities on the balance sheet. This split allows investors and creditors to calculate important ratios like the current ratio.
Ability to Pay Long-Term Debt:
Debt ratio = Total Liabilities / Total Assets
= 431,000 / 787,000
= 54.8% (0.548)
On the other hand, the debt ratio basically shows how many assets the company must sell in order to pay off all of its liabilities (Miller-Nobles, 2016). This is important as it gives lenders a way to measure your ability to manage payments and repay monies you have borrowed. A ratio of 1 means that total liabilities equals total assets; thereby meaning the company would have to sell all their assets to pay off their liabilities. A lower debt ratio can mean a more stable business because a company with lower ratio has lower overall debt. So, in terms of financial sustainability of a business lower ratios are more favorable. Smart Touch is in the acceptable range.
Profitability:
Profit Margin Ratio = Net Income / Net Sales
= 48,000 / 858,000
= 5.6% (0.056)
May I add, the profit margin ratio shows what percentage of sales are left over after all expenses are paid by the business. This is a measure of business efficiency and overall business health (Miller-Nobles, 2016). A company wants higher ratios as creditors and investors use this ratio to measure how effectively a company can convert sales into net income. Investors want to make sure profits are high enough to distribute dividends while creditors want to make sure the company has enough profits to pay back its loans. Smart Touch can strive to generate more revenues while keeping expenses constant or keep revenues constant and lower expenses thereby increasing their profit margin ratio.
Truth be told, planning is one of the most important aspects in business management. Ratios can be used in decision making by highlighting areas that are working well and identify areas that need action. Ratios also provide actuals that can be compared with standards. A business needs to make decisions based on concrete and tangible information, and ratios can help draw conclusions to help improve business profitability and performance (Zage, n.d).
References
Miller-Nobles, T. L., Mattison, B., & Matsumura, E. (2016). Chapter 15: Financial Statement Analysis. In Herngren's Financial and Managerial Accounting (pgs. 776-785). Retrieved from https://view.ebookplus.pearsoncmg.com
Zage, K., & Zager, L. (n.d.). The Role of Financial Information in Decision Making Process. Retrieved from https://businessperspectives.org/journals_free/im/2006/im_en_2006_03_Zager.pdf


