Reflection Paper (stages 3 of the project)
Financial Research Project 21
Financial Research Project
Student’s Name
Institutional Affiliation
Background and Industry
Campbell Soup Company is also known as Campbell’s. The company is based in the United States. It is involved in the canning of soup and other related products. The company deals with provision of soups, snacks and beverages. Most of its income however comes from the sale of soup. The company has currently managed to sell its products in over 120 countries. The company is in the food processing industry. The company has been operations since 1869.
Common Size Analysis
| Campbell Soup | ||||||
| Income Statement (Values in Millions) | ||||||
| Period Ending: | 7/31/2016 | 8/2/2015 | 8/3/2014 | |||
| Total Revenue | $7,961,000 | 100% | $8,082,000 | 100% | $8,268,000 | 100% |
| Cost of Revenue | $5,181,000 | 65% | $5,300,000 | 66% | $5,297,000 | 64% |
| Gross Profit | $2,780,000 | 35% | $2,782,000 | 34% | $2,971,000 | 36% |
| Operating Expenses | ||||||
| Research and Development | $124,000 | 2% | $117,000 | 1% | $122,000 | 1% |
| Sales, General and Admin. | $1,665,000 | 21% | $1,509,000 | 19% | $1,527,000 | 18% |
| Non-Recurring Items | $31,000 | 0% | $102,000 | 1% | $55,000 | 1% |
| Other Operating Items | $0 | 0% | $0 | 0% | $0 | 0% |
| Operating Income | $960,000 | 12% | $1,054,000 | 13% | $1,267,000 | 15% |
| Add'l income/expense items | $4,000 | 0% | $3,000 | 0% | $3,000 | 0% |
| Earnings Before Interest and Tax | $964,000 | 12% | $1,057,000 | 13% | $1,270,000 | 15% |
| Interest Expense | $115,000 | 1% | $108,000 | 1% | $122,000 | 1% |
| Earnings Before Tax | $849,000 | 11% | $949,000 | 12% | $1,148,000 | 14% |
| Income Tax | $286,000 | 4% | $283,000 | 4% | $374,000 | 5% |
| Minority Interest | $0 | 0% | $0 | 0% | $11,000 | 0% |
| Equity Earnings/Loss Unconsolidated Subsidiary | $0 | 0% | $0 | 0% | $0 | 0% |
| Net Income-Cont. Operations | $563,000 | 7% | $666,000 | 8% | $774,000 | 9% |
| Net Income | $563,000 | 7% | $666,000 | 8% | $866,000 | 10% |
| Campbell Soup | ||||||
| Balance Sheet (Values in 000's) | ||||||
| Period Ending: | 7/31/2016 | 8/2/2015 | 8/3/2014 | |||
| Current Assets | ||||||
| Cash and Cash Equivalents | $296,000 | 4% | $253,000 | 3% | $232,000 | 3% |
| Short-Term Investments | $0 | 0% | $0 | 0% | $0 | 0% |
| Net Receivables | $626,000 | 8% | $647,000 | 8% | $670,000 | 8% |
| Inventory | $940,000 | 12% | $995,000 | 12% | $1,016,000 | 13% |
| Other Current Assets | $46,000 | 1% | $198,000 | 2% | $182,000 | 2% |
| Total Current Assets | $1,908,000 | 24% | $2,093,000 | 26% | $2,100,000 | 26% |
| Long-Term Assets | ||||||
| Long-Term Investments | $0 | 0% | $0 | 0% | $0 | 0% |
| Fixed Assets | $2,407,000 | 31% | $2,347,000 | 29% | $2,318,000 | 29% |
| Goodwill | $2,263,000 | 29% | $2,344,000 | 29% | $2,433,000 | 30% |
| Intangible Assets | $1,152,000 | 15% | $1,205,000 | 15% | $1,175,000 | 14% |
| Other Assets | $107,000 | 1% | $88,000 | 1% | $87,000 | 1% |
| Deferred Asset Charges | $0 | 0% | $0 | 0% | $0 | 0% |
| Total Assets | $7,837,000 | 100% | $8,077,000 | 100% | $8,113,000 | 100% |
| Current Liabilities | ||||||
| Accounts Payable | $1,336,000 | 17% | $1,263,000 | 16% | $1,218,000 | 15% |
| Short-Term Debt / Current Portion of Long-Term Debt | $1,219,000 | 16% | $1,543,000 | 19% | $1,771,000 | 22% |
| Other Current Liabilities | $0 | 0% | $0 | 0% | $0 | 0% |
| Total Current Liabilities | $2,555,000 | 33% | $2,806,000 | 35% | $2,989,000 | 37% |
| Long-Term Debt | $2,314,000 | 30% | $2,539,000 | 31% | $2,244,000 | 28% |
| Other Liabilities | $1,039,000 | 13% | $850,000 | 11% | $729,000 | 9% |
| Deferred Liability Charges | $396,000 | 5% | $505,000 | 6% | $548,000 | 7% |
| Misc. Stocks | $0 | 0% | $0 | 0% | $0 | 0% |
| Minority Interest | $8,000 | 0% | ($4,000) | 0% | ($12,000) | 0% |
| Total Liabilities | $6,312,000 | 81% | $6,696,000 | 83% | $6,498,000 | 80% |
| Stock Holders’ Equity | ||||||
| Common Stocks | $12,000 | 0% | $12,000 | 0% | $12,000 | 0% |
| Capital Surplus | $354,000 | 5% | $339,000 | 4% | $330,000 | 4% |
| Retained Earnings | $1,927,000 | 25% | $1,754,000 | 22% | $2,198,000 | 27% |
| Treasury Stock | ($664,000) | -8% | ($556,000) | -7% | ($356,000) | -4% |
| Other Equity | ($104,000) | -1% | ($168,000) | -2% | ($569,000) | -7% |
| Total Equity | $1,525,000 | 19% | $1,381,000 | 17% | $1,615,000 | 20% |
| Total Liabilities & Equity | $7,837,000 | 100% | $8,077,000 | 100% | $8,113,000 | 100% |
The company has been going through some tough times. This is evidence by the fact that the percentage of the net income since 2014 has been declining. The company had a net income percentage of 10% in 2014, 8% in 2015 and 7% in 2016. The company’s costs of goods sold does not have the same percentage changes as the net income. The company’s operating costs have been increasing over the last three years. This evident from the constant decrease of the earnings before interest and tax. It is therefore clear that the company needs to control its costs especially the operating costs in order to maintain its profitability.
The balance sheet does not show any issues that raises any concern. The company has maintained small changes in all its accounts. The changes in the percentage value of the accounts changes with a slight one percent change. There are no large changes that can cause concern. The major change in comparison to the rest is the decrease of the retained earnings of the company in 2015 and an increase in 2016 which is a good sign. There percentage of the total liabilities on the three-year period is high. The company has around 80% of its assets being financed by liability (White, Braentner & Towery, 1993).
The income statement mainly raises concern on the decrease in the company’s profitability. The company is also being financed too much by debt which can be risky. From the interest expense however, it is clear that the company can comfortably be able to pay off its debt. The company is stable enough and can be able to pay of its debt. The company needs to make its profitability to be stable in positive and not negative growth.
Percentage Change Analysis
| Campbell Soup | |||||
| Income Statement (Values in Millions) | |||||
| Period Ending: | 7/31/2016 | Percent Increase (Decrease) | 8/2/2015 | Percent Increase (Decrease) | 8/3/2014 |
| Total Revenue | $7,961,000 | -4% | $8,082,000 | -2% | $8,268,000 |
| Cost of Revenue | $5,181,000 | -2% | $5,300,000 | 0% | $5,297,000 |
| Gross Profit | $2,780,000 | -6% | $2,782,000 | -6% | $2,971,000 |
| Operating Expenses | |||||
| Research and Development | $124,000 | 2% | $117,000 | -4% | $122,000 |
| Sales, General and Admin. | $1,665,000 | 9% | $1,509,000 | -1% | $1,527,000 |
| Non-Recurring Items | $31,000 | -44% | $102,000 | 85% | $55,000 |
| Other Operating Items | $0 | $0 | $0 | ||
| Operating Income | $960,000 | -24% | $1,054,000 | -17% | $1,267,000 |
| Add'l income/expense items | $4,000 | 33% | $3,000 | 0% | $3,000 |
| Earnings Before Interest and Tax | $964,000 | -24% | $1,057,000 | -17% | $1,270,000 |
| Interest Expense | $115,000 | -6% | $108,000 | -11% | $122,000 |
| Earnings Before Tax | $849,000 | -26% | $949,000 | -17% | $1,148,000 |
| Income Tax | $286,000 | -24% | $283,000 | -24% | $374,000 |
| Minority Interest | $0 | -100% | $0 | -100% | $11,000 |
| Equity Earnings/Loss Unconsolidated Subsidiary | $0 | $0 | $0 | ||
| Net Income-Cont. Operations | $563,000 | -27% | $666,000 | -14% | $774,000 |
| Net Income | $563,000 | -35% | $666,000 | -23% | $866,000 |
| Campbell Soup | |||||
| Balance Sheet (Values in 000's) | |||||
| Period Ending: | 7/31/2016 | Percent Increase (Decrease) | 8/2/2015 | Percent Increase (Decrease) | 8/3/2014 |
| Current Assets | |||||
| Cash and Cash Equivalents | $296,000 | 28% | $253,000 | 9% | $232,000 |
| Short-Term Investments | $0 | $0 | $0 | ||
| Net Receivables | $626,000 | -7% | $647,000 | -3% | $670,000 |
| Inventory | $940,000 | -7% | $995,000 | -2% | $1,016,000 |
| Other Current Assets | $46,000 | -75% | $198,000 | 9% | $182,000 |
| Total Current Assets | $1,908,000 | -9% | $2,093,000 | 0% | $2,100,000 |
| Long-Term Assets | |||||
| Long-Term Investments | $0 | $0 | $0 | ||
| Fixed Assets | $2,407,000 | 4% | $2,347,000 | 1% | $2,318,000 |
| Goodwill | $2,263,000 | -7% | $2,344,000 | -4% | $2,433,000 |
| Intangible Assets | $1,152,000 | -2% | $1,205,000 | 3% | $1,175,000 |
| Other Assets | $107,000 | 23% | $88,000 | 1% | $87,000 |
| Deferred Asset Charges | $0 | $0 | $0 | ||
| Total Assets | $7,837,000 | -3% | $8,077,000 | 0% | $8,113,000 |
| Current Liabilities | |||||
| Accounts Payable | $1,336,000 | 10% | $1,263,000 | 4% | $1,218,000 |
| Short-Term Debt / Current Portion of Long-Term Debt | $1,219,000 | -31% | $1,543,000 | -13% | $1,771,000 |
| Other Current Liabilities | $0 | $0 | $0 | ||
| Total Current Liabilities | $2,555,000 | -15% | $2,806,000 | -6% | $2,989,000 |
| Long-Term Debt | $2,314,000 | 3% | $2,539,000 | 13% | $2,244,000 |
| Other Liabilities | $1,039,000 | 43% | $850,000 | 17% | $729,000 |
| Deferred Liability Charges | $396,000 | -28% | $505,000 | -8% | $548,000 |
| Misc. Stocks | $0 | $0 | $0 | ||
| Minority Interest | $8,000 | -167% | ($4,000) | -67% | ($12,000) |
| Total Liabilities | $6,312,000 | -3% | $6,696,000 | 3% | $6,498,000 |
| Stock Holders’ Equity | |||||
| Common Stocks | $12,000 | 0% | $12,000 | 0% | $12,000 |
| Capital Surplus | $354,000 | 7% | $339,000 | 3% | $330,000 |
| Retained Earnings | $1,927,000 | -12% | $1,754,000 | -20% | $2,198,000 |
| Treasury Stock | ($664,000) | 87% | ($556,000) | 56% | ($356,000) |
| Other Equity | ($104,000) | -82% | ($168,000) | -70% | ($569,000) |
| Total Equity | $1,525,000 | -6% | $1,381,000 | -14% | $1,615,000 |
| Total Liabilities & Equity | $7,837,000 | -3% | $8,077,000 | 0% | $8,113,000 |
As 2014 as the base year, the trend that can be seen from the analysis above is a poor one. The company’s sales have reduced over the last two years. In 2015 the decrease was 2% and in 2016 the decrease was 4%. This raises concern that the company’s market share has been reducing over the years. The company need to carry out marketing activities that are meant to increase its revenues.
The company has increased some of its expenses and reduced others. The company in 2016 increased its expenditure in research and development. The company increased its expenditure on sales, general and administration. The percentage increase is 9% which is worrying. Despite the company reducing its revenues, it accrued a lot of operating expenses and thus there was huge decrease in the company’s operating income in 2016 in comparison to 2014 (White, Braentner & Towery, 1993).
The company’s current assets reduced considerably in 2016 in comparison to 2014. The company decreased the amount of short-term debt that it took in 2016 and 2015. The company’s total liabilities however slightly reduced by 3% in 2016 while in 2015 it had increased with the same percentage. The company tried to reduce its debt financing. Equity financing also reduced its more in 2015 and less in 2016. The company’s value of its total assets and the equity and liabilities amount reduced by 3%.
Financial Ratio Analysis
| Financial Ratio Analysis | |||
| Ratio | 2016 | 2015 | 2014 |
| Current Ratio | 75% | 75% | 70% |
| Quick Ratio | 38% | 39% | 36% |
| Days Inventory | 68.09 | 69.48 | 65.97 |
| Receivables Turnover | 13.45 | 13.17 | 12.67 |
| Gross Profit Margin | 35% | 34% | 36% |
| Net Profit Margin | 7% | 8% | 10% |
| ROA | 7.07% | 8.53% | 9.95% |
| ROE | 37% | 48% | 54% |
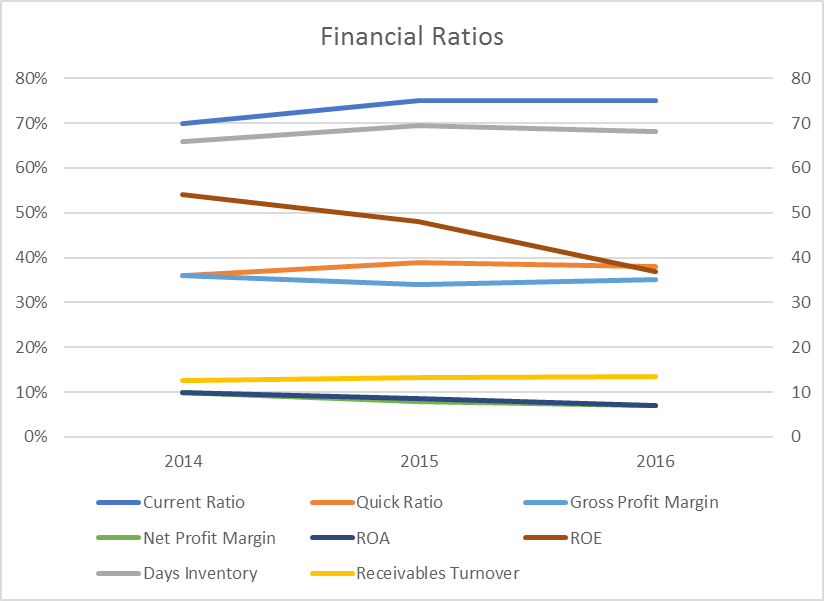
In the above ratio analysis, two ratios are used to determine the liquidity of the company. These are the current ratio and quick ratio. The current ratio is the ratio of a company’s current assets to its current liabilities. The quick ratio is the ratio of a company’s most liquid asset which include current assets less inventory to its current liabilities. the ratios are used to show the ability of a company to meets its short-term liabilities using its current assets. The company has low liquidity. This is a problem as the company will have difficulty when paying for its obligations. The company needs to increase the money that it takes from operations and increase its accounts receivable. The company has been able to maintain its liquidity over the last year with small differences between the years. Its quick ratio increased slightly in 2015 but decreased slightly in 2016.
The profitability ratio that were used in this scenario were the gross margin ratio and net margin. The gross profit margin ratio is a ratio of gross profit to revenues. The net margin ratio is a ratio of net income to total revenues. The company’s gross margin decreased slightly in 2015 and increased in 2016. The company’s net margin ratio has however been decreasing since 2014. The difference between the ratios is a clear sign that the company accrues too much operating costs and its operating costs have been increasing over the last 3 years. The company’s profitability has reduced which is a sign that the company should reduce its expenses and increase its revenues for it to increase its growth (Bodie, 2013).
The days inventory turnover shows the period of time it takes for the company’s inventory to be sold. The company takes around 60 days to sell its inventory. This is a long time which the company has to maintain its inventory. this leaves chances of loss of inventory due to storage. The receivables turnover ratio is used to determine the ability of a company in managing its account receivables. The company receives its account receivable about 13 times per year. This means that the company collects accounts receivable in less than a month. The company however needs to improve in order to improve its liquidity.
Return on Assets (ROA), is a ratio of net income to total assets. Return on Equity (ROE), is the ratio of net income to total equity. The returns on investment has been reducing over the last three years. The company needs to improve on its net earnings through increasing its revenues and reducing its expenses. An increase in its net earnings will in turn increase the return on the investment made by the company. the company needs to generate more earnings from the assets that it as (Bodie, 2013).
In order to improve the company’s Cash Conversion Cycle (CCC), the company needs to convince their suppliers to increase the period of time within which the company is expected to meet its obligations. These would increase the time that accounts payable are settled. The management would also need to reduce the period of time that the customers takes to pay the company. this can be done by giving the customers incentive such as discounts for them to pay within a shorter period of time. The company would also need to send invoices to the customers within a short period of time (Lewis, 2017).
The company would also need to improve its efficiency. The company should improve its efficiency in the billing and invoicing process. These will contribute to faster time for the company to receive the cash that is owed to it. The company also needs to manage its inventory. The company should manage its inventory such as it does not keep too much inventory. inventory ties up capital for a long period of time.
Return on Equity
ROE = Net profit margin x Total assets turnover x Equity multiplier
2016
Net profit Margin = 7%
Total Asset Turnover = 1.02
Equity Multiplier = 5.14
= 7% * 1.02 * 5.14
=36.70%
2015
Net profit Margin = 8%
Total Asset Turnover = 1.00
Equity Multiplier = 5.85
= 8% * 1.00 * 5.85
= 46.8%
2014
Net profit Margin = 10%
Total Asset Turnover = 1.02
Equity Multiplier = 5.02
= 10% * 1.02 * 5.02
= 51.20%
DuPont Analysis is of the view that the return on equity is affected by three aspects. The first is the net margin, the second is the asset turnover ratio which in this we use the total asset turnover and the third is the equity multiplier.
The company’s return on assets has been deteriorating over the three years. The company’s net margin can be seen to be the most troubled aspect of the company. In 2014, the net margin was 10% and yet by 2016 the company had a net margin ratio of 7%. The company’s operations need to improve. The company’s net margin has been decreasing over the last three years. The company needs to work on its operations (Wahlen, Baginski & Bradshaw, 2014).
The company can work on its operations by increasing its revenues through carrying out more marketing in order for the product to reach more of their customers. The company also needs to reduce its expenses. In this case, the company should try to increase its operating activities. By reducing the expenses and increasing the revenues, the company will achieve better net margin ratio.
References
Bodie, Z. (2013). Investments. McGraw-Hill.
Lewis, J., (2017). How Can a Company Shorten Its Cash Cycle? Hearst Newspapers, LLC.
Wahlen, J., Baginski, S., & Bradshaw, M. (2014). Financial reporting, financial statement analysis and valuation. Nelson Education.
White, B., Braentner, L., & Towery, E. (1993). Financial Statement Analysis. New York: Wiley.


