BUS 599 Discuss question
NON-ALCOHOLOIC BEVERAGE COMPANY PORTFOLIO
Table of ContentsNote #1 (Company Parameters) 4
Note #3 (Personnel, Business Expenses, & Financial Matters) 9
Note # 4 (Websites - Data & Statistics) 11
Note # 5 (Market Research) 12
A guide to the non-alcoholic beverage industry 12
Industry overview 12
Dominant carbonates category 12
Major companies 12
Understanding consumer craving for soft drinks 13
What’s a soft drink made of? 13
Stimulants in soft drinks 13
Ingredient facts 14
Understanding the value chain of the soft drink industry 14
Industry Partners 14
Bottling and distribution network 15
Distribution: Third-party products 15
Pricing power 15
Key indicators of the non-alcoholic beverage industry 16
Factors influencing sector growth 16
Consumption expenditure 16
Disposable income and consumer confidence 17
Understanding the soft drink industry’s key markets 17
Income bracket 17
Hispanics 18
Millennials 18
Teens 18
The role of branding and advertising in the soft drink industry 19
The importance of advertising 19
Global brands 19
Strong individual brand portfolios 19
Investing in brands 20
Why the soft drink industry is dominated by Coke and Pepsi 21
A rivalry for the ages 21
Threat from new entrants 22
Significant investments 22
Why growth is sluggish in the non-alcoholic beverage industry 22
Falling demand 22
Key indicator—per capita consumption 23
Health concerns 23
The soda tax 23
In challenging times, soft drinks makers optimize and thrive 24
Productivity measures 24
Cost-cutting initiatives 24
Soft drink industry now looking to still beverages to boost sales 25
Social pressures forcing change 25
Ready-to-drink beverages 26
International growth opportunities for the soft drink industry 27
Beyond borders 27
Growth prospects 28
Positive trends 28
Competition outside the domestic market 28
Strategic deals in the soft drink industry 29
Industry alliances 29
Recent Pepsi and Coca-Cola deals 29
Other deal-making in the sector 30
Investing in soft drink companies with ETFs 30
Packaged investing 30
Consumer staple ETFs 31
Note # 6 (History & Industry Data/Forecasting & Technology) 32
Cognitive health appeals to all demographics 32
Omega-3s popular ingredient for brain health 33
Mental energy 33
Focus on claims 35
2016 New Product Development Outlook for beverages 36
Organic named top trend for new beverages in new year 36
Buzzing about flavors 37
Creating success 39
Natural influence 40
Sharing the work 41
2016 expectations 42
Beverage Industry launches new app 44
Introductory video shows how to use Bev Industry Mobile 44
(The NAB Company Portfolio will have lists of things that the BUS599 students would be able to sort through to conduct a SWOT Analysis and to apply to appropriate sections of the NAB Business Plan.)
Note #1 (Company Parameters)This is the compilation of Data, Notes, and Information that have been put together to create a Business Plan, along with Pro-forma Financial Statements, for a start-up company in the non-alcoholic beverage industry.
The goal of my business plan is twofold:
To help identify and outline all the issues I will need to address in starting this company.
To present to funders to help raise money to finance this company.
NAB Background:
Melinda Cates has been selling her NAB at County Fairs for the past 7 years for $2 a bottle. She sells an average of 10 Cardboard cartons each weekend a County Fair is open. From her calculations, it takes $.56 to make a bottle of NAB when she calculates all the NAB ingredients and the cost of the bottle and cap. Her rich uncle, Bill, just died and left her a small monetary inheritance. However, since he so enjoyed her homemade NAB, he also left her equipment to start a small NAB business. Additionally, her uncle left her a facility that will allow growth to start the business. It has the potential for expansion in order to meet larger sales goals for the future.
Melinda and I have been close, trusted friends for years. She knew I attended Strayer University and earned my MBA; so I agreed to assist her get the business up and running. I have agreed to put together a NAB Business Plan, and I have agreed to be the CEO/President of the company for at least the next five years.
NAB Today:
Parameters for New Company
Here are the parameters in which I must work.
The business is a start-up: We are not yet in operation. We already have a “recipe” for a beverage, but we are not yet making sales at any significant level.
Product: the only barrier is that it must be a non-alcoholic beverage (NAB). It is up to me to decide upon what type of non-alcoholic beverage I intend to make and market. It can be sold in individual sizes or wholesale.
Market size. I will start marketing and selling the NAB in my geographical area within a 100-mile radius from my home address.
Business size. I can grow the NAB business to any size in excess of one million dollars in revenue by year two. In other words, this cannot be intended to be a one- or two-person micro-business.
I intend to raise money. I will be looking for funding, and I have already started with friends and family money. However, at some point, I will need funds from outside investors, either angels or venture capitalists, depending on how much I project, I need to raise or receive from a group of individual investors on Kickstarter.
I intend to have employees and develop my own organizational hierarchy.
I do not need to raise money for my personal financial support for the first six months. In other words, I do not need to draw a salary for myself for the first six months of projections. Annual salary will be $55,002 1st year; adjusted to $110,004 2nd year; finally adjusted to $165,008 for all remaining years in position.
Note #2 (Equipment & Inventory)
The NAB Financial Worksheets will need to have the value of this equipment and inventory included.
Some of the items we currently own:
Owned Equipment:
Two (2) NAB Mixer Beverage Filling Machines (mixes up to 200 gallons each) – $28,500 each (value in current $)
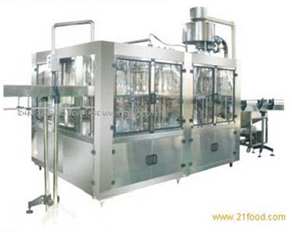
The Mixer Beverage Filling machine is a rinsing, filling, and capping (3-in-1) Monobloc machine, imported from Italy. Because it is equipped with constant temperature controlling system, it can be applied to fill hot or cold fruit juice, tea and other beverage into 16 oz. bottles. It is suitable for normal temperature filling or hot filling 16 oz. bottles. It is one of the most advanced filling machine at present.
Two (2) Accutek AccuSnap Capper Bottling machines (for capping bottles) - $9,600 each (value in current $) See Auto AccuSnap Capper, below.
Four (4) Vehicles (used panel vans) – $10,000 each (value in current $)
Three (3) Computers (Apple Macintosh) - $1,200 each (value in current t $)
Graphic Software -$$750 (value in current $)
Leased Equipment:
Labeling machinery - $450/month (in current $)
Printers - $550/month (in current $)
Current Inventory:
Glass Bottles (16 oz.), 24,000 - $33,000 (value in current $)
Labels, 24,000 - $840 (value in current $)
Metal caps, 24,000 - $300 (value in current $)
Cardboard Cartons (holds 48 bottles), 500 - $500 (value in current $)
NAB-ingredients, enough to make 24,000 bottles - $600 (value in current $)
NOTES on EQUIPMEENT 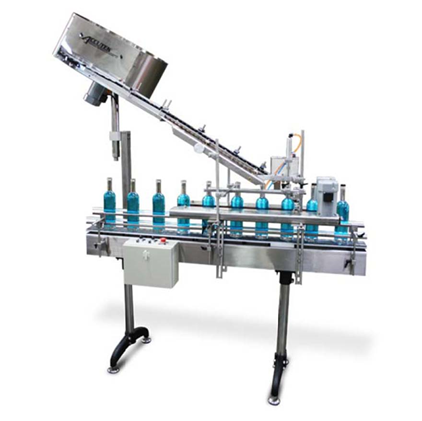
Accutek AccuSnap Capper - are continuous motion machines that replace the tedious work of manually pressing and/or placing snap caps. Accutek AccuSnap Cappers prevent costly spills by removing human error from this process. This machine can also help prevent repetitious motion injuries and strains to your workforce that can result when manually placing snap caps. Accutek AccuSnap Cappers systems are available in three different styles, Belt, Roller, and Plunger in order to offer solutions to a variety of snap cap types. Milk jugs, dropper inserts, lip balm caps, over caps, “top hat” seals, twist cap with ratcheted rip seal, bar top caps, and a variety of other cap applications are all within the capabilities of Accutek AccuSnap Capper. Each machine is designed to accommodate a wide variety of container types. A variety of gripper belt options is available to stabilize different types of containers.
The Accutek AccuSnap Capper features an Accutek centrifugal bowl or cap elevator orientated arm. With an automated delivery device, the Accutek AccuSnap Capper can reach speeds up to 120 CPM.
SnapCap007
Dimensions -
Height: 94” (238 cm)
Width: 24” (61 cm)
Length: 32” (91.4 cm)
Weight -
800 lbs. (363 kg)
Speed -
Up to 120 CPM
Cap Size -
Min: 10mm / Max: 660mm
Electrical -
110V AC 20 Amp (220 available)
Air Requirements -
120 PSI @ 2 CFM
Note #3 (Personnel, Business Expenses, & Financial Matters)Personnel Requirements and Family Financial Investment
Personnel
Current Personnel:
Myself (Student Name Here): Fulltime CEO/President; no salary for the first six months
Stephen Job: Part Time (20 hrs/week) Computer Expert/Assistant: $10/hr
Melinda Cates: NAB Creator & Master Mixer (owns the patent on the NAB): has $40,000 inheritance
(Volunteer) Ian Glass: Retired PepsiCo plant production line foreman. Ian recently retired with 35 years of loyal PepsiCo service in every position from janitor to production line foreman, and he and his wife moved into your neighborhood. He is tickled that you have asked him to help develop a plan to get the NAB Company’s production line going. He said he could help organize and sit on the planning committee as a non-paid member until the NAB Company can hire its own Production Line Foreman. He hinted that he retired from PepsiCo with an annual salary of $55,000, but he says that is just the starting salary that large companies pay their foremen who are in an apprenticeship program. He does not think the NAB Company will have to pay top dollar for someone who has the willingness to join the NAB Company as a start up!
(Paid Consultant) Mary Cates, JD: Melinda’s sister who was a senior executive with the Federal Trade Commission from 2001-2012. She left the FTC after a significant 30 year career with the federal government in which she lead the research and support of numerous federal court findings against companies that violated consumer deception and unfair practices laws. She would enjoy serving on the initial company-planning group to make sure her sister’s recipe is successfully shared within the state!
Future Personnel:
Production Line Foreman (Note: in order to meet goals of creating a $1 M revenue company by year two; you will need more than one shift of employees.)
Projection Line Workforce - (see note above)
Maintenance Workforce (see note above)
Business Expenses:
- Marketing
- Paid services (professional in nature)
- Telephone/fax
- Business Insurance
- Office Supplies
- Mailings and postage
- Printing services
- Inventory purchases
Capital Expenditures:
- Additional equipment purchases to meet production goals
- Additional computer equipment
Facilities:
Need monthly estimates for the following areas:
- Building maintenance costs
- Utilities:
- Water/Sewer
- Gas
- Electricity
- Trash removal
Financial Matters:
Family Financial Investment:
Collected $20,000 from friends and relatives who would like to either have their seed money returned by the end of this calendar year at no interest or by the end of the second year of operation with 5% interest.
(If you chose, the early payoff you must adjusted your BPF on worksheet 8 to read 12 months and 0% interest, so that you are not paying loan payments automatically. If you chose to pay back over 24 months than the original instructions on the BPF Worksheet Guidance.)
Financial Decisions:
- Employee raises
- Owner draw
- Taxes
- Investors
- Sales (local, regional, national, or global)
Here are some websites for your continued used in reviewing statistics and data on the beverage (non-alcoholic) industry:
http://marketrealist.com/2014/11/strategic-deals-soft-drink-industry/
http://www.statista.com/topics/1662/non-alcoholic-beverages-and-soft-drinks-in-the-us/
http://libdatab.strayer.edu/login?url=http://search.ebscohost.com/login.aspx?direct=true&db=bth&AN=102826573&site=eds-live&scope=site
http://www.bevindustry.com/articles/88194-nielsen-identifies-consumer-health-concerns
http://www.bevindustry.com/articles/88184-bai-brands-disrupts-cpg-space-with-low-calorie-allnatural-solutions
http://wwww.bevindusstry.com/artiicles/86916-zzico-to-sendd-fan-to-sochhi-2014-wintter-olympic-games
http://www.bevindustry.com/videos?bctid=946203236001
http://www.ameribev.org/minisites/products/
http://beverageindustries.com/
Note # 5 (Market Research)A guide to the non-alcoholic beverage industry
By Sharon Bailey • Nov 20, 2014 12:08 pm EST
Industry overview
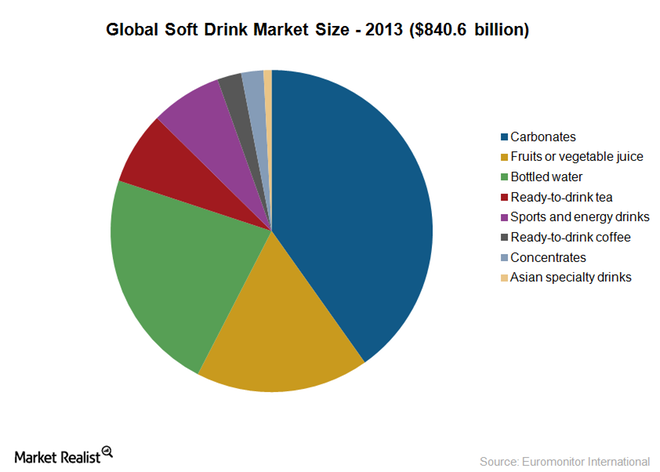
The non-alcoholic beverage industry broadly includes soft drinks and hot drinks. Soft drinks contain carbonated or non-carbonated water, a sweetener, and a flavor, and hot drinks include coffee and tea. The soft drink category dominates the industry and includes carbonates, juice, bottled water, ready-to-drink tea and coffee, and sports and energy drinks. Soft drinks are sometimes referred to as liquid refreshment beverages (or LRBs). In the US, LRBs lead food and beverage retail sales. In this series, we’ll focus on the soft drink or LRB market.
Dominant carbonates category
The global soft drink market is led by carbonated soft drinks (or CSDs), which had a market size of $337.8 billion in 2013. In the same year, CSDs were followed by bottled water, with a market size of $189.1 billion, and juice, with a market size of $146.2 billion. In a later part of this series, we’ll discuss why CSDs have been losing popularity, and why sales of other beverages, including juices and ready-to-drink tea, are increasing.
Major companies
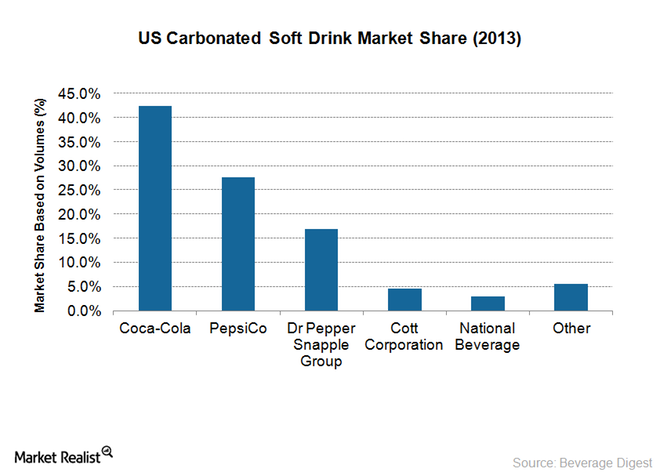
The non-alcoholic beverage market is a highly competitive industry that includes two behemoths —The Coca-Cola Company (KO) and PepsiCo, Inc. (PEP). Collectively, these companies hold about 70% of the US CSD market. Dr Pepper Snapple Group, Inc. (DPS), Monster Beverage Corporation (MNST), and Cott Corporation (COT) are some other key players in the CSD market.
Many international markets are also dominated by Coca-Cola and PepsiCo, but include other companies such as Groupe Danone, Nestle SA, and Suntory Holdings Limited.
Non-alcoholic beverage manufacturers, like Coca-Cola and PepsiCo, are part of the consumer staple sector. You can invest in these companies through the Consumer Staples Select Sector SPDR ETF (XLP).
Understanding consumer craving for soft drinks
By Sharon Bailey • Nov 20, 2014 12:08 pm EST
What’s a soft drink made of?
Soft drinks contain water, nutritive or non-nutritive sweeteners, and syrups. The primary nutritive sweetener used in the US is high-fructose corn syrup (or HFCS), a form of sugar. Internationally, sucrose is the main nutritive sweetener used in soft drinks. Soft drink makers also use non-nutritive or artificial sweeteners such as aspartame, acesulfame potassium, saccharin, cyclamate, and sucralose. So what drives a person to consume a soft drink?
Stimulants in soft drinks
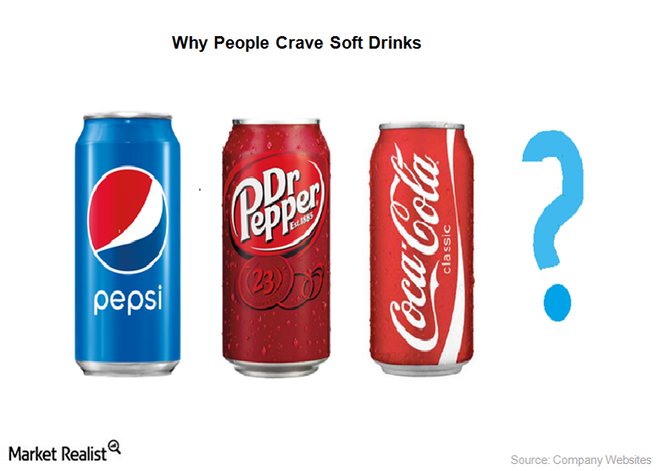
People crave soft drinks because they contain two stimulants—sugar and caffeine. Also, the water in soft drinks hydrates. Soft drinks contain considerable amounts of sugar, which is a form of carbohydrate. Consumption of excess sugar releases a hormone called dopamine, which induces pleasure in the brain.
Caffeine, another key ingredient, stimulates the nervous system, and helps you to stay awake or restores alertness. With its slightly bitter taste, caffeine’s also used to enhance the flavor of carbonated soft drinks.
Ingredient facts
The Coca-Cola Company (KO) and PepsiCo, Inc. (PEP) are the leading soft drink manufacturers. A 12-fluid ounce can of Coca-Cola contains 39 grams of sugar and around 34 milligrams of caffeine. A 12-fluid ounce can of Pepsi contains 41 grams of sugar and 38 milligrams of caffeine. A 12-fluid ounce can of Dr Pepper, made by Dr Pepper Snapple Group (DPS), contains 40 grams of sugar and 41 milligrams of caffeine. Energy drinks made by leading companies such as Monster Beverage Corporation (MNST) contain higher amounts of caffeine.
Despite the considerable demand for soft drinks across the globe, these drinks are facing severe criticism for the ill-effects of high sugar content.
Beverages come under the consumer staple sector. The Consumer Staples Select Sector SPDR ETF (XLP) is one way to invest in soft drinks companies.
Understanding the value chain of the soft drink industry
By Sharon Bailey • Nov 20, 2014 12:08 pm EST
Industry Partners
Soft drinks constitute a major part of the US food and beverage industry. Syrup or concentrate producers and bottlers play a vital role in the value chain of the soft drink industry.
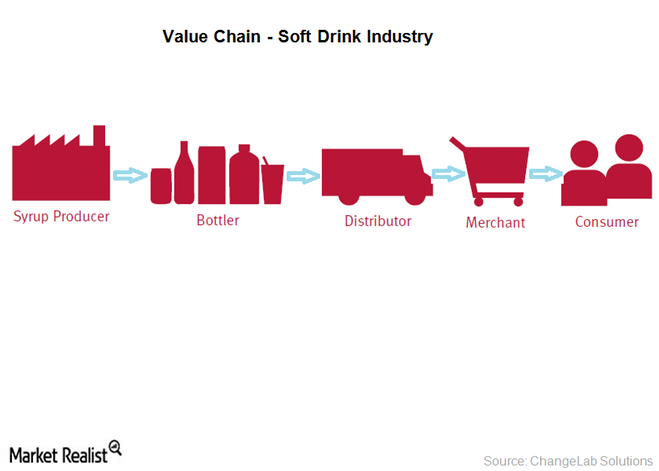
Bottling and distribution network
Companies in the soft drink industry reach the end market in two ways. One way is by selling finished products, made at company-owned bottling facilities, to distributors and retailers.
Another, is by selling beverage concentrates and syrups to authorized bottling partners, who then make the final product by combining the concentrates with still or carbonated water, sweeteners, and other ingredients. The bottlers then package the product in containers and sell these beverages to distributors or directly to retailers.
Also, both bottling partners and companies manufacture fountain syrups and sell them to fountain retailers. Fountain retailers include restaurants and convenience stores, which produce beverages for immediate consumption.
Distribution: Third-party products
The extensive reach of The Coca-Cola Company (KO) and PepsiCo, Inc. (PEP) allows them to produce or distribute third-party brands. For instance, Coca-Cola is licensed to produce and distribute certain brands of Dr Pepper Snapple Group, Inc. (DPS) and Monster Beverage Corporation (MNST). PepsiCo sells Lipton and Starbucks brands under partnerships with Unilever and Starbucks, respectively.
Pricing power
Coca-Cola and PepsiCo’s wide distribution network gives them significant pricing power. Carbonated soft drinks have similar prices due to the intense competition in the industry. Often, soft drink companies extend lower prices under promotional offers. In recent times, such promotional offers have been used to boost volumes of the carbonated soft drinks. That’s because they’re under pressure due to rising health concerns and competition from healthy substitutes such as tea, energy drinks, and water.
The non-alcoholic beverage industry is part of the consumer staples sector. You can invest in this sector through the Consumer Staples Select Sector SPDR ETF (XLP), which has notable holdings in Coca-Cola and PepsiCo.
Key indicators of the non-alcoholic beverage industry
By Sharon Bailey • Nov 20, 2014 12:09 pm EST
Factors influencing sector growth
The non-alcoholic beverage industry falls under the consumer staples category (XLP), which is non-cyclical in nature compared to the consumer discretionary sector. In this part of the series, we’ll look at the factors that impact the growth of the non-alcoholic beverage industry.
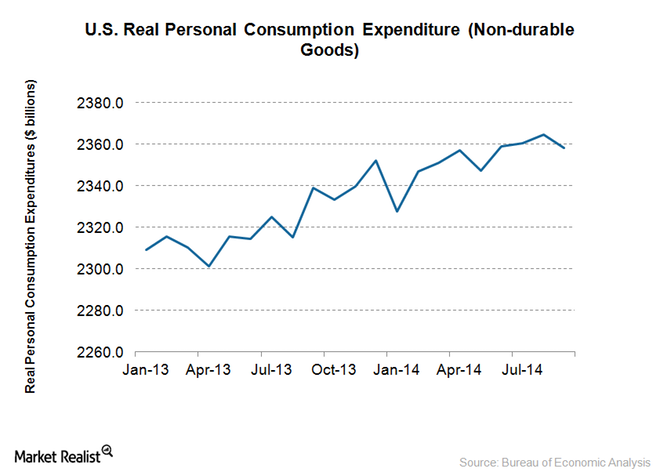
Consumption expenditure
The Bureau of Economic Analysis (or BEA) releases the personal income and outlays monthly reports that indicate changes in individuals’ personal incomes, savings, and expenditures.
US consumption spending accounts for over two-thirds of the country’s gross domestic product (or GDP). The US real personal consumption expenditure for non-durable goods measures consumer spending on non-durable goods, such as food and beverages, on an inflation-adjusted basis.
Disposable income and consumer confidence
Consumption expenditure depends on disposable income, which is measured as personal income less personal current taxes. People tend to spend more with a rise in their disposable income. Increase in consumer confidence also increases consumption expenditure. In the US, the Conference Board and the University of Michigan each provide monthly reports on the consumer confidence index, which indicates the degree of optimism about the state of the economy as reflected in consumer spending and saving activities.
According to market-intelligence firm Euromonitor International, consumer-expenditure growth in emerging markets has surpassed that in developed markets every year since 2000, and is expected to continue doing so.
A favorable trend in consumer spending on non-durable goods is a positive indicator for the non-alcoholic beverage industry. It’s also good for the performance of exchange-traded funds (or ETFs) that invest in the consumer staple sector. The Consumer Staples Select Sector SPDR ETF (XLP) has holdings in the major soft drink companies like The Coca-Cola Company (KO), PepsiCo, Inc. (PEP), Dr. Pepper Snapple Group, Inc. (DPS), and Monster Beverage Corporation (MNST).
Understanding the soft drink industry’s key markets
By Sharon Bailey • Nov 20, 2014 12:09 pm EST
Income bracket
The growing population and rise of the middle class, particularly in emerging markets, are key growth drivers for non-alcoholic beverage companies. Market intelligence firm Euromonitor International estimates the middle class around the world will include 1.5 billion households by 2020, a 25% rise over 2012.
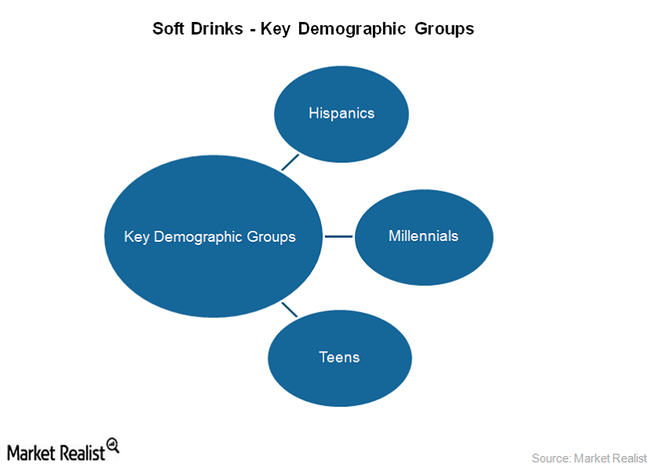
Hispanics
Many companies are innovating products and investing in marketing campaigns that target fast-growing population segments, such as the Hispanic community in the US. Hispanics include people of Cuban, Mexican, Puerto Rican, Southern or Central American descent. People of other Spanish cultures or origins, regardless of race, are also considered Hispanic. Nielsen estimates that by 2015, Hispanics will have $1.5 trillion in buying power, reflecting a significant 50% rise from 2010.
Millennials
“Millennial” refers to the generation of people who were born between 1981 and 1996. According to Nielson, there are 77 million Millennials in the US, representing 24% of the US population. Millennials make extensive use of social media and mobile devices, and have more product awareness.
Major companies in the soft drink industry, including The Coca-Cola Company (KO), PepsiCo, Inc. (PEP), Dr Pepper Snapple Group (DPS), and Monster Beverage Corporation (MNST), are focusing their marketing strategies on this influential demographic group.
Teens
The teen population is a core demographic for the soft drink industry. At the 2014 Consumer Analyst Group of Europe conference, Coca-Cola reflected on the importance of the 3.5 billion people who are in their teens and early 20s.
Soft drink companies are part of the consumer staples sector. Investors can access this sector through the Consumer Staples Select Sector SPDR ETF (XLP).
The role of branding and advertising in the soft drink industry
By Sharon Bailey • Nov 20, 2014 12:09 pm EST
The importance of advertising
The soft drink industry is marked by severe competition and declining demand for carbonates. Major companies in the industry sustain positions in this adverse scenario on the strength of company and product branding and advertising strategies.
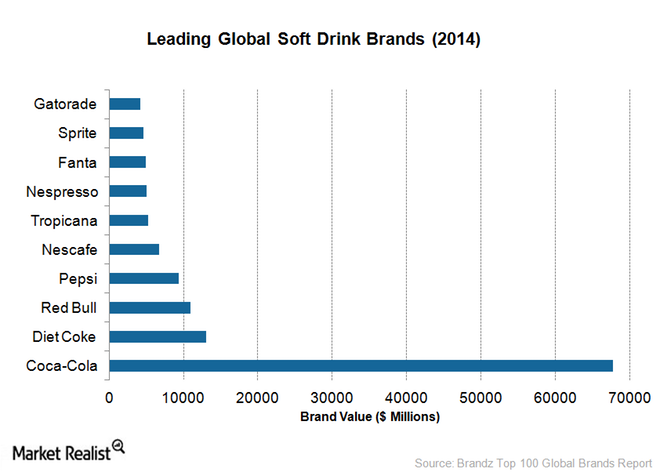
Global brands
The industry includes companies that enjoy huge popularity all over the globe. Brand consultancy Interbrand ranked The Coca-Cola Company (KO) as the world’s third-most valuable brand, with a value of $81.6 billion. Coca-Cola’s closest competitor PepsiCo, Inc. (PEP) ranked 24th, with a brand value of $19.1 billion.
Strong individual brand portfolios
Coca-Cola and PepsiCo own impressive brands that generate more than a billion dollars each in revenues.
Coca-Cola: The company owns more than 500 brands, and features 17 brands that generate more than one billion dollars each in revenues, including Coca-Cola, Diet Coke, Powerade, Aquarius, Bonqua, Dasani, Fanta, Schweppes, and Minute Maid.
PepsiCo: The company’s massive brand portfolio includes 22 brands generating revenues of more than one billion dollars each. Some of its better-known labels are Pepsi, Mountain Dew, Gatorade, Mirinda, Aquafina, and Lipton.
Investing in brands
Soft drink makers continually invest in branding. In 2013, Coca-Cola and PepsiCo spent $3.3 billion and $3.9 billion, respectively, on advertising and marketing activities.
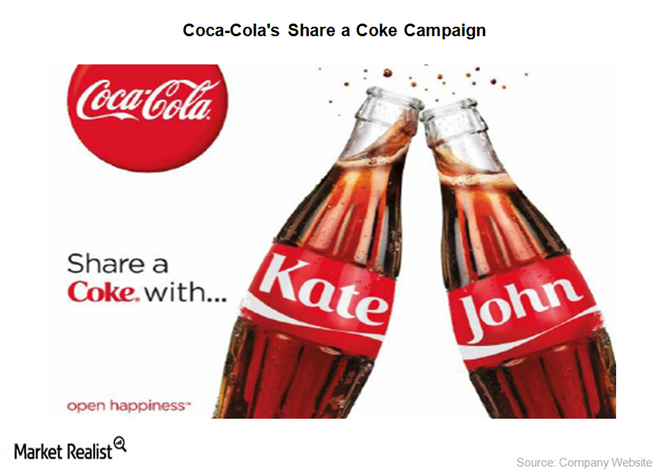
The success of Coca-Cola’s Share a Coke campaign is a perfect example of the importance attached to marketing in this industry. The Share a Coke campaign was first rolled out in Australia in 2011 and then extended to more than 50 countries. The campaign allowed fans to put their names or those of their family and friends right on the front of Coca-Cola bottles or cans, effectively personalizing the product.
The campaign increased the volume of the Coca‑Cola brand’s sales. In 2013, it generated 5% and 1% full-year volume growth in Germany and the Northwest Europe and Nordics region, respectively.
Peers in the industry such as Dr Pepper Snapple Group, Inc. (DPS) and Monster Beverage Corporation (MNST) also focus intently on marketing. Dr Pepper Snapple, the third-largest company in the US soft drink market, spent $486 million on advertising in 2013. Monster, a leading player in energy drinks, incurred $181.8 million in advertising expenses.
Soft drinks come under the consumer staple sector. You can access this sector through the Consumer Staples Select Sector SPDR ETF (XLP).
Why the soft drink industry is dominated by Coke and Pepsi
By Sharon Bailey • Nov 20, 2014 12:09 pm EST
A rivalry for the ages
The Coca-Cola Company (KO) and PepsiCo, Inc. (PEP) have dominated the non-alcoholic beverage industry for ages. Coca-Cola is the world’s largest non-alcoholic beverage company with more than 500 brands, including 17 brands that generate more than a billion dollars each in revenue. PepsiCo owns leading brands across its snack foods and beverage portfolio, including 22 brands that generate more than a billion dollars each in revenue. According to Beverage Digest, the companies have a combined share of about 70% of the US carbonated soft drink (or CSD) market.
Both companies have a wide geographic presence in more than 200 countries. The rivalry between these two companies, popularly called the cola wars, is legendary. Both have spent huge sums of money on mutually targeted advertisements over decades.
Threat from new entrants
The industry does not face any major threats from new entrants because Coca-Cola and PepsiCo each have an extensive bottling and distribution network and huge economies of scale. For example, Coca-Cola has about 250 bottling partners and 900 plants worldwide. It would be difficult for a new entity to make the substantial capital investments required to compete with these firms. Dr. Pepper Snapple Group, Inc. (DPS) has seen impressive growth in the US CSD market, yet it lacks the international presence of these giants.
Significant investments
Coca-Cola and PepsiCo spend enormous amounts of money on innovation, advertising and marketing, and on strengthening their distribution network. Since 2010, Coca-Cola and its bottling partners have invested more than $50 billion in new facilities, distribution infrastructure, equipment, and retail customer activations. PepsiCo spent 5.9% of 2013 net revenue on advertising and marketing.
Other companies in the non-alcoholic beverage industry include Cott Corporation (COT) and Mondelez International Inc. (MDLZ). You can also invest in the non-alcoholic beverage sector through the Consumer Staples Select Sector SPDR ETF (XLP) that has notable holdings in Coca-Cola and PepsiCo.
In the next part of this series, we’ll look at the reasons for disappointing growth in the non-alcoholic beverage industry.
Why growth is sluggish in the non-alcoholic beverage industry
By Sharon Bailey • Nov 20, 2014 12:09 pm EST
Falling demand
The non-alcoholic beverage industry is facing challenges. Carbonated beverage volumes are falling, primarily in developed markets. Beverage Digest indicates a 3% fall in 2013 overall carbonated soft drink (or CSD) volumes in the US, making it the ninth straight year in which demand has declined. Previously, US CSD volumes declined by 1.2% and 1% in 2012 and 2011, respectively.
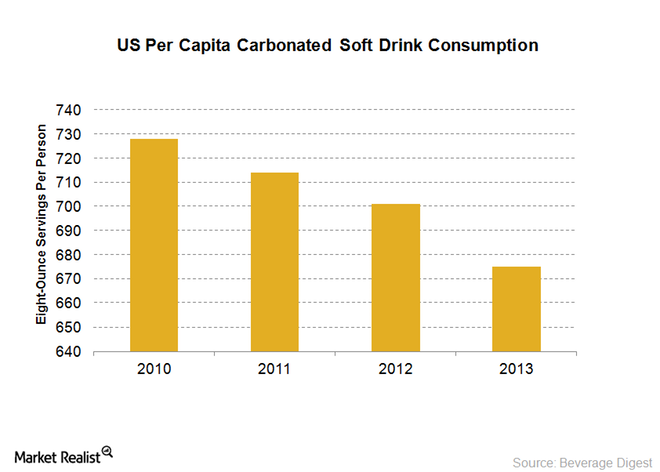
Key indicator—per capita consumption
The per capita CSD consumption in the US fell to about 675 8-ounce servings per person in 2013, from 701 8-ounce servings in 2012. Reduced consumption reflects the declining volumes and a slower rate of US population growth.
One of the reasons for the continued decline in soft drink volumes over the past few years is weak consumer spending, caused by adverse macroeconomic conditions, especially in the US and Europe.
Health concerns
Another major reason is the shift in consumer preferences toward healthier products. Carbonated soft drink makers have faced severe criticism from health officials, governments, and communities alike for the ill-effects of high sugar content, artificial sweeteners, and other harmful ingredients in their products, including those in diet soda variants. Consumers are also more conscious of the health risks associated with soft drinks such as obesity and nutritional deficiencies, especially in youth. As a result, they’re opting for other beverages that are non-carbonated and have fewer calories.
The World Health Organization suggests that sugar should account for only 5% of total energy intake per day. That’s around 25 grams of sugar per day for an adult of normal body mass index. Health officials feel that this percentage should be even lower for a better quality of life. A single soda can contains around 40 grams of sugar.
The soda tax
Mexico, which has the highest rates of obesity in the world, has imposed a 10% tax on sugary beverages to discourage the consumption of these drinks. There is a strong possibility that many other countries will introduce a soda tax to reduce sugar consumption through carbonated drinks.
In the next part of this series, we’ll discuss how soft drink makers including The Coca-Cola Company (KO), PepsiCo, Inc. (PEP), Dr Pepper Snapple Group, Inc. (DPS), and Monster Beverage Corporation (MNST) are sustaining business under such challenging conditions. Coca-Cola and PepsiCo are part of the Consumer Staples Select Sector SPDR ETF (XLP).
In challenging times, soft drinks makers optimize and thrive
By Sharon Bailey • Nov 20, 2014 12:09 pm EST
Productivity measures
Companies in the soft drink industry are taking several initiatives to streamline operations and cut costs. These measures are needed to offset declining volumes in the carbonated drinks category and the challenging business conditions apparent in Europe, North America, and other key markets.
Cost-cutting initiatives
Significant optimization measures allow soft drink companies to make it through challenging times. The Coca-Cola Company (KO) is streamlining its operations and restructuring its global supply chain. In North America, the company’s optimizing its manufacturing footprint. It recently announced plans to expand its productivity program, through which it aims to save $1 billion by 2016, $2 billion by 2017, and $3 billion by 2019. The company intends to reinvest these savings in brand-building initiatives, mainly media spending.
PepsiCo, Inc. (PEP) is on track to achieve $1 billion in savings globally in 2014. It’s cutting costs across procurement, research and development, and other functions. The company recently extended its $1 billion annual productivity savings target through 2019. PepsiCo is focusing on enhancing its operations through automation, including automated packaging, case picking, and forklift transportation.
Another major US soft drink maker, Dr Pepper Snapple Group, Inc. (DPS), commenced its rapid continuous improvement program in 2011 and achieved $169 million in cash productivity over the 2011 to 2013 period.
These measures are helping companies protect margins in adverse market conditions. The soft drink industry also includes Monster Beverage Corporation (MNST) and Mondelez International, Inc. (MDLZ). You can also invest in this industry through the Consumer Staples Select Sector SPDR ETF (XLP).
Soft drink industry now looking to still beverages to boost sales
By Sharon Bailey • Nov 20, 2014 12:09 pm EST
Social pressures forcing change
The carbonated soft drinks (or CSD) category of the soft drink industry has witnessed declining volumes in the past few years. Mainly, this is due to challenging conditions in developed markets and increased health awareness among consumers about the side-effects of sugar and other ingredients present in carbonated drinks.
Soft drink makers are facing severe pressure from civil society groups and governments to reduce the calories in soft drinks. In the September 2014 Clinton Global Initiative, the three largest US soda companies—The Coca-Cola Company (KO), PepsiCo, Inc. (PEP), and the Dr Pepper Snapple Group, Inc. (DPS)—pledged to reduce the number of sugary drink calories that Americans consume by 20% over the next decade. To achieve this target, the three big players plan to expand low-calorie product portfolios, introduce smaller portion containers, and educate consumers about healthier alternatives.
The change in consumer preferences has provided a new opportunity for CSD manufacturers to grow into the still beverages, or the non-carbonated category of the ready-to-drink market.
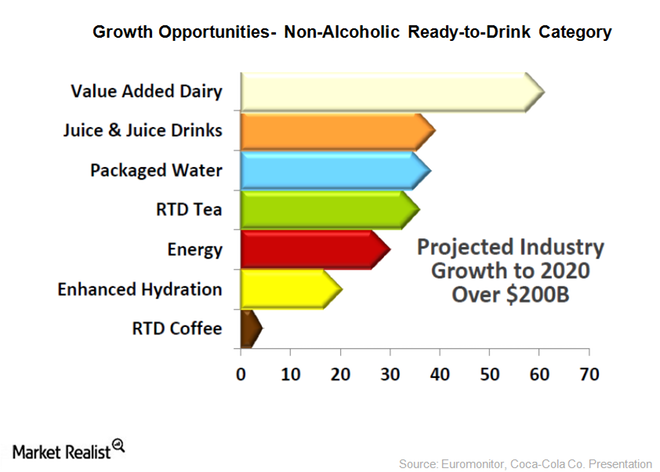
Ready-to-drink beverages
The non-alcoholic, ready-to-drink (or NARTD) market is projected to grow at a compounded annual growth rate of 5% between 2014 and 2017. A large proportion of this growth will come from emerging economies. Since 2010, NARTD retail value has increased by $135 billion and Euromonitor International estimates this category will grow by more than $200 billion by 2020.
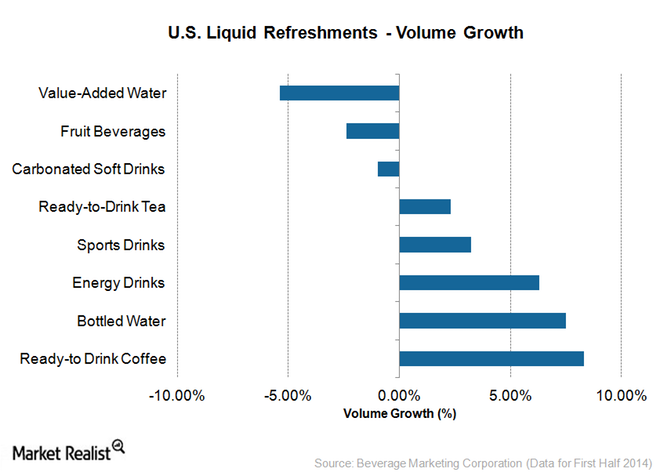
In the first half of 2014, ready-to-drink tea and coffee, sports and energy drinks, and bottled water recorded strong growth. Coca-Cola and PepsiCo have a strong presence across these categories and are investing heavily for further portfolio expansion. Other companies including Dr Pepper Snapple and Monster Beverage Corporation (MNST) are also investing in product development in these categories in an attempt to cater to changing consumer tastes.
This new focus on healthier and nutritious products based on changing consumer preferences and increasing health consciousness will be a key growth driver for the non-alcoholic beverage industry.
The Consumer Staples Select Sector SPDR ETF (XLP) provides an attractive avenue to invest in soft drink companies.
International growth opportunities for the soft drink industry
By Sharon Bailey • Nov 20, 2014 12:09 pm EST
Beyond borders
The soft drink industry is looking for growth beyond developed markets like the US, where the reach of carbonated soft drinks has reached a saturation point. The Coca-Cola Company (KO) derived 58% of its 2013 revenues internationally. PepsiCo, Inc. (PEP), which is a leading food and beverage company, generated 49% of its revenues outside the US.
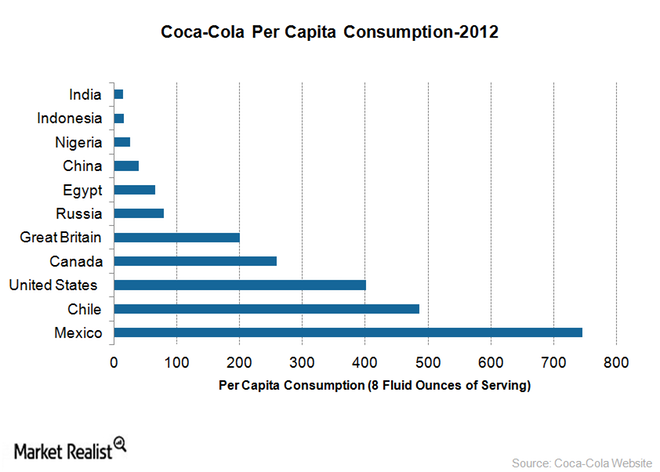
Growth prospects
The per capita consumption in a region measures the average number of 8-ounce servings consumed each year. For Coca-Cola, per capita consumption in 2012 was 745 in Mexico and 401 in the US, as the chart above shows. But per capita consumption was comparatively low in countries such as China and India, indicating that in many countries, soft drinks are not consumed as widely as in the domestic market.
Companies including PepsiCo and Coca-Cola are focusing on these growth regions to increase per capita consumption by investing in manufacturing and distribution networks, as well as advertising.
Positive trends
Growing populations and better standards of living in emerging markets will drive demand for beverages. Rising health awareness among consumers across the globe is moving them toward better options including ready-to-drink tea, bottled water, and low-calorie products.
The long-term prospects for growth in emerging economies are promising. In the short-term, however, there might be certain impediments such as lower-than-expected consumer spending growth in countries such as China.
Competition outside the domestic market
Coca-Cola and PepsiCo compete with local niche players and private labels in developing markets. For instance, in China, Hangzhou Wahaha Group Co., Ltd., Hebei Yangyuan Zhihui Beverage Co., Ltd., and Guangdong Jiaduobao Beverage & Food Co., Ltd. are some of the key players in the soft drink market.
Other soft drink manufacturers such as Monster Beverage Corporation (MNST) and Mondelez International, Inc. (MDLZ) are also looking for international growth opportunities.
An alternative way to invest in the soft drink industry is through the Consumer Staples Select Sector SPDR ETF (XLP).
Strategic deals in the soft drink industry
By Sharon Bailey • Nov 20, 2014 12:10 pm EST
Industry alliances
Major companies in the soft drink industry are looking for strategic deals to expand product portfolios or to strengthen distribution networks. These alliances will help companies offset declining demand for carbonated soft drinks.
Recent Pepsi and Coca-Cola deals
In 2014, The Coca-Cola Company (KO) announced a long-term partnership with Keurig Green Mountain, Inc. (GMCR). The deal will allow people to enjoy ice-cold Coca‑Cola beverages at home with the soon-to-be-released Keurig Cold machine.
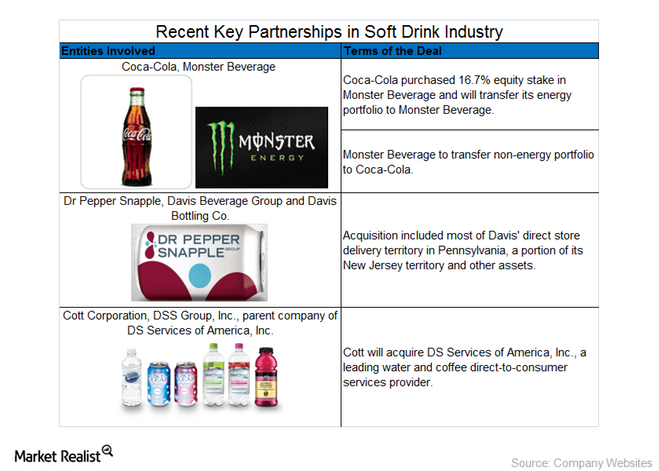
In August 2014, Coca-Cola announced the purchase of a 16.7% stake in Monster Beverage Corporation (MNST). The $2.15 billion deal will help both companies leverage their respective strengths—Coca-Cola’s bottling system and Monster Beverage’s position as a global energy player.
Under the terms of the partnership, Coca-Cola will transfer ownership of its energy business, including drinks such as Full Throttle, Burn, and Relentless, to Monster Beverage. Monster Beverage will transfer its non-energy business, including drinks such as Hansen’s Natural Sodas, Peace Tea, Hubert’s Lemonade, and Hansen’s Juice Products, to Coca-Cola.
In October 2014, PepsiCo, Inc. (PEP) and home carbonation maker Sodastream International entered into a short-term agreement to test a limited number of PepsiCo flavors for SodaStream machines.
Other deal-making in the sector
In 2014, Dr Pepper Snapple Group, Inc. (DPS) acquired Davis Beverage Group and Davis Bottling Co. to enhance its distribution network.
In November 2014, Cott Corporation (COT) announced the $1.5 billion acquisition of DSS Group, Inc., parent company of DS Services of America, Inc., a leading water and coffee direct-to-consumer services provider in the US. With this acquisition, Cott, a leading producer of private-label soft drinks, juices, sparkling water, and energy drinks, will expand into growing markets. Examples of growing markets include water and coffee home-and-office delivery services, water filtration services, and retail services.
The soft drink industry is part of the consumer staples sector. You can invest in the soft drink industry with the Consumer Staples Select Sector SPDR ETF (XLP), which has notable holdings in Coca-Cola and PepsiCo.
Investing in soft drink companies with ETFs
By Sharon Bailey • Nov 20, 2014 12:10 pm EST
Packaged investing
Exchange-traded funds (or ETFs) are capital market instruments that are designed to track an index, a commodity, or a basket of assets. Soft drink companies come under the consumer staples sector. There are many consumer staples sector ETFs that help investors access stocks in the soft drink industry.
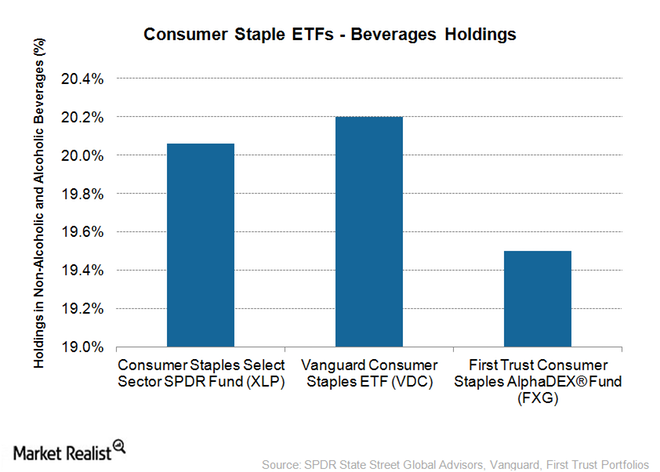
Consumer staple ETFs
Consumer staple ETFs provide exposure to companies that produce essentials, including food, beverages, tobacco, and household items. The above chart shows the exposure of some of the consumer staples ETFs to beverage companies, both alcoholic and non-alcoholic.
The Consumer Staples Select Sector SPDR Fund (XLP) tracks the S&P Consumer Staples Select Sector Index. The Vanguard Consumer Staples ETF (VDC) tracks the MSCI US Investable Market Consumer Staples 25/50 Index. Assets under management of the XLP and the VDC are $9.64 billion and $2.35 billion, respectively, as of November 17, 2014. The expense ratios for the XLP and the VDC are 0.16% and 0.14%, respectively.
Both the XLP and the VDC have The Coca-Cola Company (KO) and PepsiCo, Inc. (PEP) in their top ten holdings. Coca-Cola and PepsiCo are the dominant companies in the soft drink industry and together, hold 70% of the US carbonated soft drink market share.
The First Trust Consumer Staples AlphaDEX Fund (FXG), using the StrataQuant Consumer Staples Index as its benchmark, selects stocks from the Russell 1000 Index. The FXG has $2.11 billion in assets under management and has an expense ratio of 0.70%. Monster Beverage Corporation (MNST), a leading energy drinks maker, features in the top ten holdings of the FXG.
Dr Pepper Snapple Group, Inc. (DPS), the third-largest soft drink company in the US, is also a part of the XLP, the VDC, and the FXG ETFs.
ETFs are an efficient way to gain diversified exposure to various sectors and broad markets. To learn more, you can read Market Realists Macro ETF analysis (http://marketrealist.com/analysis/etf-analysis/) page.
Note # 6 (History & Industry Data/Forecasting & Technology)
The non-alcoholic beverage industry plays an important role in the U.S. economy. Our industry has a direct economic impact of more than $169 billion, provides nearly 240,000 jobs and helps to support hundreds of thousands more that depend, in part, on beverage sales for their livelihoods. Beverage companies and their employees, and the firms and employees indirectly employed by the industry, provide significant tax revenues - $13.6 billion at the state level and $22.9 billion at the federal level. In addition, the beverage companies that produce and distribute non-alcoholic beverages in the U.S. and those they directly employ contribute nearly $1.6 billion to charitable causes in communities across the nation.
The American Beverage Association (ABA) is the trade association that represents America's non-alcoholic beverage industry. ABA was founded in 1919 as the American Bottlers of Carbonated Beverages, and renamed the National Soft Drink Association in 1966. Today the ABA represents hundreds of beverage producers, distributors, franchise companies and support industries. Together, they bring to market hundreds of brands, flavors and packages, including regular and diet soft drinks, bottled water and water beverages, 100 percent juice and juice drinks, sports drinks, energy drinks and ready-to-drink teas.
ABA provides a neutral forum in which members convene to discuss common issues while maintaining their tradition of spirited competition in the American marketplace. The Association also serves as liaison between the industry, government and the public, and provides a unified voice in legislative and regulatory matters. As the national voice for the non-alcoholic refreshment beverage industry, the American Beverage Association staff of legislative, scientific, technical, regulatory, legal and communications experts effectively represent members' interests.
Cognitive health appeals to all demographics
Omega-3s popular ingredient for brain health
By Jamie Popp (Feb 2015)
An estimated 5.2 million Americans suffer from Alzheimer’s disease, and although the majority are older than 65, younger-onset Alzheimer’s impacted 200,000 people last year, according to the Alzheimer’s Association, Chicago. Furthermore, total payments in 2014 for all individuals with Alzheimer’s disease and other dementias were estimated at $214 billion, the association adds.
Increasingly, attention is being put on brain health and preventative measures such as diet and exercise in line with consumers, particularly baby boomers, expressing concerns about memory loss and dementia. However, ingredients that help consumers maintain their cognitive abilities are emerging to help all age groups to support brain development, focus and more.
“Cognitive health applies to all ages, as newborns and children develop cognition early, [middle-aged people] count on it for their careers, and the older generation strives for maintenance for as long as possible,” says Volker Berl, founder and chief executive officer at Oceans Omega, Montvale, N.J. “Consumers are naturally interested in maximizing intake of the right ingredients to maintain cognition for a lifetime, supporting memory, alertness, attention, mood and focus.”
Many ingredients are associated with cognitive health, but omega-3 DHA has the strongest body of scientific support, according to Berl. But vitamin D; coenzyme Q10; phosphatidylserine; magnesium; resveratrol; pycnogenol; vitamin E; and botanicals such as ashwagandha, ginkgo biloba, vinpocetine, ginseng and curcumin also are considerations, he adds.
Oceans Omega offers a range of stable omega-3 ingredients that are water soluble and clear because of its stabilization technology and sustainable sources of omega-3s from ingredient partners such as DSM Nutritional Products, Kaiseraugst, Switzerland, and Nutegrity, Irvine, Calif. OTEC 300LDHA delivers life’sDHA from DSM, a fish free, vegetarian and sustainable source of DHA from algae, the company says. OTEC 250CL-K delivers OmegaActiv from Nutegrity, a pure, sustainable, vertically integrated source of omega-3s from menhaden that contains a balanced level of omega-3s DHA, EPA and DPA, according to the company.
Used in clear beverages and liquid nutritionals, OTEC ingredients increase shelf life for finished products at ambient temperatures, the company says. They also are compatible with most beverage processing conditions such as hot fill, cold fill, carbonation and pasteurization, according to the company.
Mental energy
Nutegrity closely follows the advent of brain health and the focus of today’s consumers on products that provide a memory boost or afternoon edge.
“The [brain health] category is interesting to us because of aging baby boomers and challenges from cognitive function, but millennials and their brains are hardwired to go fast, and they are looking for some type of edge,” says Matt Phillips, chief commercial officer at Nutegrity.
The focus is not only on memory and improved cognitive function, but also on general brain health as well as antioxidants and anti-inflammation specific to brain inflammation in relation to diseases, he says.
Nutegrity, a division of Omega Protein Corp., Houston, focuses its primary business in fishing and omega-3s, Phillips says. From a beverage standpoint, milk companies can use omega-3s in their formulations, but the company also produces dairy protein as well as a line of nutraceuticals.
“Most of the work we’re doing is focused on antioxidants and higher concentrations of omega-3s,” Phillips says. ”At one time, most companies were doing product development and spending time on ingredients, and now they are looking to ingredient suppliers to … come to the table with a turnkey solution.”
Focus formulas and energy drinks openly tout the cognitive benefits of the ingredients to appeal to a wide audience, but the claims have to be backed by scientific evidence or beverages risk being pulled from store shelves. As a result, many companies dedicate considerable time substantiating new and existing claims and discovering ways to use their ingredients based on findings in clinical trials.
Oceans Omega closely follows studies related to adolescents and brain health. For example, to determine the effects of algal DHA supplementation on reading and behavior in healthy school-aged children, researchers conducted the Docosahexaenoic Acid Oxford Learning and Behavior (DOLAB) Trial and reported that supplementation with 600 mg each day with algal DHA for 16 weeks improved reading and behavior in healthy school-aged children, aged 7 to 9 years old, with low reading scores.
“We work on educating the end producer,” says Karen Todd, director of global brand marketing at New York City-based Kyowa Hakko U.S.A. Inc. The company’s Cognizin product features citicoline, which increases cellular synthesis and energy, she says. Ingredients such as Cognizin are associated with boosting brain energy, supporting mitochondrial health, and boosting levels of ATP, according to the company’s research. This ingredient also is associated with increased focus and concentration as well as memory storage and recall.
“We do clinical studies on raw materials [with healthy subjects], and results of that help us identify what levels are appropriate to make claims,” Todd says. “The producer and finished product company do their pre-market test, but they’re looking at the science behind it to support their claims from the start.”
Kyowa Hakko is replicating clinical trials done with millennials, pre-menopausal women and baby boomers with more targeted groups including adolescents and athletes.
Futureceuticals, Momence, Ill., also sees the value of clinical trials and is in the midst of several that involve its ingredients including CoffeeBerry coffee fruit, a line of powders and concentrates of the fruit of the coffee plant, including the bean.
“We consider demographics when we’re choosing outcomes to focus on for our claims,” says Brad Evers, vice president of business development. “In the case of CoffeeBerry coffee fruit extract, we discovered that it has a unique capacity to increase serum levels of brain-derived neurotropic factor (BDNF), which is a key neuro-protein involved in cognition, mood and other key neuro-processes. We chose to focus on cognition and mood, given the enormous public interest in cognitive and mental health at all age levels. Baby boomers frequently cite cognitive health as their No. 1 concern, and younger people are motivated to take action now to help ensure a higher quality of life as they age.”
Major research facilities around the globe are focusing on BDNF, and Futureceuticals has two studies that indicate that coffee fruit stimulates the body to produce BDNF, which is something brewed coffee does not do, according to the company.
“Our research on our coffee fruit products is at the forefront of new discoveries for cognitive health,” Evers says. “CoffeeBerry meets the demand for functional beverage ingredients that are natural and offer a value proposition.”
Focus on claims
Regulations as well as the flavor of the ingredients in their natural state can have an impact on beverages designed to improve memory and focus or reduce the impact of aging on the brain.
“The biggest trend with cognitive ingredients is really attention given to caffeine and energy drinks by the Food and Drug Administration (FDA) and [the decision to] crack down on amounts,” Kyowa Hakko’s Todd says. “Cognizin is a non-stimulant without negative side effects. Energy drinks use Cognizin [as a replacement for caffeine], and many companies are looking to reformulate and include it at the efficacious dose.”
But special treatment is required for cognitive ingredients to be beverage compatible, shelf stable, soluble and taste free. “Antioxidant beverages, focus beverages, and general brain-health and protein beverage ingredients are bitter, and [beverage-makers] have to figure out a way to mask [them],” Nutegrity’s Phillips says. “Another big challenge is solubility, and we’re finding ways through agglomeration or other techniques to make them suspend in a liquid.”
Oceans Omega is able to counteract the instability and protect them from oxidizing with new technologies, but aftertaste still is a challenge.
“Polyunsaturated fatty acids have the propensity to oxidize quickly and develop very repugnant odor and taste offnotes,” Berl says. “Many [omega-3] products still have a fishy or marine aftertaste, and their manufacturing requires an increased complexity in processing and handling these sensitive ingredients in the production processes.”
Certain nutrients also just don’t mix well, according to Russ Hazen, North American premix innovation manager for Fortitech Inc., Schenectady, N.Y.
“Certain iron compounds can have unfavorable effects on product quality and consumer acceptance by increasing the oxidation of polyunsaturated fatty acids,” Hazen says. “On the other hand, inclusion of suitable amounts of antioxidants, like vitamin E, is important to protect polyunsaturated fatty acids from oxidation. In liquid beverages, adverse interactions between calcium and phosphorus can be tricky and can result in unsightly mineral precipitation products under certain conditions”
When bitterness is a factor, masking agents can address this issue as well, according to Kyowa Hakko’s Todd. Futureceuticals, however, will provide its bitter CoffeeBerry products and extracts as-is because the more natural state is preferred by its customers, Evers says.
2016 New Product Development Outlook for beverages
Organic named top trend for new beverages in new year
By Jessica Jacobsen (Jan 2016)
This past year, Americans finally got a chance to see whether any the 2015 references in “Back to the Future Part II” would come true. Although the Chicago Cubs attempted to make the World Series prediction a reality, they fell short. However, in business, prognostication is less about fantasizing about the future and more about anticipating how your products and services can benefit, or even shape, the future. In Beverage Industry’s New Product Development Outlook 2015 Study, respondents helped to shed light on what they think will be the latest product attribute trends, flavors and much more in 2016.
According to survey-takers, “organic” will be the latest trend in the new year. With only 10 percent of respondents listing it as a low need/interest, the remaining 90 percent indicated its prevalence. The trend led all other product attribute interests with 38 percent of survey-takers listing it as a latest trend. This is vast change from last year’s study where it came in at No. 8 and only 18 percent listed it as a latest trend.
Maintaining its No. 2 status, “natural” had only 4 percent of respondents list the product attribute interest as a low need/interest while 34 percent named it as a latest trend.
“High protein,” last year’s No. 1 product attribute interest, fell to No. 18 with only 6 percent indicating it as a latest trend. Also falling down
the list was “convenience.” Last year’s No. 4 product attribute interest, which fell to No. 9 in this year’s survey, “convenience” only had 4 percent name it as a low need/interest; however, 66 percent listed convenience as a high need/interest. Only 12 percent named it as a latest trend.
In addition to “high protein,” “vitamin, mineral fortified” (No. 10 last year) and “probiotic/prebiotic” (No. 6 last year) fell out of the Top 10 this year. Replacing these product attribute interests were “country of origin labeling” (No. 6), “ethnic” (No. 8) and “cognitive health” (No. 10).
Buzzing about flavors
When developing new products, many note that taste is king. With flavor playing such a vital role, this attribute can garner a lot of attention.
Different from previous years, this year’s survey asked respondents whether they used berry flavors in 2015, which flavors and how many. The same question framework was asked for non-fruit flavors and fruit flavors. Last year, survey-takers only were asked which flavors they used in their new products.
For berry flavors used in 2015, three-quarters of respondents indicated that these flavors were part of their new product releases. On average, 3.3 berry flavors were used by each company. The most popular berry flavor was raspberry with nearly three-quarters of survey-takers listing it. Strawberry came in second with 55 percent naming the berry flavor, and half of respondents used cranberry in their formulations in 2015.
Additional berry flavors listed were blueberry (42 percent), blackberry (39 percent), berry (37 percent) and acai (21 percent). No respondents named maqui berry, while 11 percent selected “other” for berry flavor options.
For non-fruit flavors, three-quarters of survey-takers stated that their companies utilized these flavor options in 2015 with an average of 4.2 non-fruit flavors used by each company.
Fifty percent of responding companies selected chocolate and vanilla as top selections. Cinnamon and mint also were popular non-fruit flavors in 2015 as each was used by 45 percent of survey-takers. Rounding out the Top 5 was coffee with 42 percent.
Tea flavors also were notable choices with green tea (39 percent), tea – other (39 percent) and black tea (29 percent) listed by survey-takers. Also receiving double-digit responses were hibiscus (21 percent), root beer (21 percent) and cola (16 percent). Aloe, the only single-digit response, garnered a 3 percent response. Sixteen percent of respondents selected “other” for their non-fruit flavors used in 2015.
For fruit flavors used in 2015, 86 percent of respondents noted these were part of their formulations. An average of eight fruit flavors were used by each company. With more than half of respondents indicating use, lemon (56 percent), mango (56 percent) and cherry (53 percent) were the top selections. Apple and orange rounded out the Top 5 with each having 57 percent naming the fruit flavor.
Pineapple also was a popular choice in 2015, with 44 percent of survey-takers listing the flavor. Lime, peach and pomegranate each were named by 42 percent of respondents while 40 percent indicated they used coconut in 2015.
Not utilized as frequently in 2015 were dragon fruit (7 percent), papaya (7 percent) and apricot (2 percent).
When it comes to the top sellers in 2015, it looks as though fruit and berry flavors were the most popular in 2015. According to respondents, 20 percent indicated that raspberry was a top-selling flavor in 2015 followed by cherry and orange, each with 16 percent. Apple and blueberry rounded out the Top 5 with 14 percent each.
In comparison to last year’s survey, chocolate was the No. 1 top-seller for 2014 with 29 percent followed by vanilla (24 percent), mango (22 percent), green tea (13 percent) and raspberry (13 percent). This year, chocolate just cracked the Top 20 with 9 percent of respondents naming it a top-seller in 2015. This was a six-way tie with black tea, coffee, ginger, lime and root beer, which each were named by 9 percent of survey-takers.
Green tea took the biggest fall as only 7 percent of respondents named it as a top-seller in 2015.
On the upward trend was cherry. The No. 2 top-selling flavor used in 2015, the fruit flavor barely cracked the Top 20 last year. Tea – other flavors also were more successful in 2015 vs. 2014. With 14 percent of respondents naming it a top-seller, tea – other made the Top 10 in 2015. However, only 4 percent of survey-takers listed it as a top-selling flavor in 2014.
Transitioning into the new year, fruit flavors are topping the list of the anticipated top-selling flavors for 2016. Raspberry once again leads all with 30 percent of respondents expecting this will be a top seller next year. Lemon and pomegranate tied for No. 2 with each having 20 percent of survey-takers naming these fruit flavors.
In contrast to last year’s survey, in which the Top 3 anticipated top-selling flavors all were non-fruit flavors: chocolate (29 percent), coffee (22 percent) and vanilla (20 percent). This year, the first non-fruit flavor listed was tea – other, which was in a three-way tie with strawberry and mango for No. 4 as each had 18 percent of survey-takers name them.
Chocolate remained in the Top 10, but only 16 percent of respondents named it as an anticipated top-seller. Vanilla dropped six percentage points with only 14 percent of survey-takers expecting it to be a top-seller in 2016. Coffee, however, had larger drop as only 6 percent listed it in this year’s survey.
Both making large gains this year are blueberry and cherry. Each was named by 7 percent last year as an anticipated top-seller for 2015; however, that increased to 16 percent for 2016.
Creating success
Strategizing for the new calendar year, respondents to Beverage Industry’s survey suggest that new alcohol releases will be common for new product development in 2016.
More than half of survey-takers (56 percent) stated that their respective companies most likely will develop new wine, beer and spirit products. Water, juice was the next area listed with 40 percent of respondents naming these categories.
This is nearly double from last year’s survey in which wine, beer and spirits tied for No. 4 with water, juice with each having only 24 percent of respondents naming them.
Last year, dairy-based drinks/alternatives were listed as the most likely area of new beverage development with 42 percent of survey-takers naming this area. This year, it came in last with only 15 percent indicating possible product development for the category. Sports/energy drinks and coffee, tea also experienced drops
in comparison with the 2014 survey. This year, 19 percent of respondents named sports/energy drinks as an area of new beverage development (36 percent in 2014), while 17 percent of survey-takers listed coffee, tea (33 percent in 2014).
New product idea generation also experienced an opposite response compared with last year’s survey. Three-quarters of respondents indicated that customer demand was a source for new products while 68 percent listed consumer trends. In contrast, more than three-quarters of respondents named consumer trends followed by customer demand in the 2014 survey.
However, one of the larger changes was in research and development (R&D) departments. Last year, this idea source was No. 3 with 62 percent of respondents listing it. For this year’s respondents, it was less influential as only 42 percent named it.
Other sources that topped the R&D department were in-house through teams and meetings
(56 percent), marketing and sales (54 percent), chief executive officer/upper management (46 percent) and consumer research/testing (44 percent).
Natural influence
As consumer preferences continue to evolve, beverage-makers are tasked with meeting their needs and demands.
When it comes to flavors for 2016, an average of 83 percent of respondents note they will be using natural flavors in their formulations while a mean of 17 percent will use artificial flavors. Among those who are planning to use natural flavors, half of survey-takers note that this is an increase from the previous year. Some of the top reasons for the increase were consumer demand, health reasons and market research.
These numbers are a slight shift from last year’s survey in which an average of 70 percent of respondents indicated they would use natural-flavor in 2015 with a mean of 30 percent planning to use artificial flavors. The increase among natural flavor users last year, however, was similar to this year as 47 percent noted it was an increase. The reasons for the increase were slightly different with cleaner label, consumer demand, better quality and taste, and industry trends listed by respondents.
Natural colors also continue as a popular attribute for new product development. An average of 80 percent of respondents plan to use natural colors in their new beverages for 2016 with a mean of 20 percent using artificial colors in their new formulations. This is up from last year’s results as an average of 70 percent planned to use natural colors in 2015 with a mean of 30 percent using artificial colors.
In this year’s survey, 38 percent of those who indicated that they will use natural colors in their new products noted that this is an increase. Among the top reasons listed for the increase were consumer demand, trend in market and health reasons.
In comparison with the 2014 survey, 43 percent of respondents who indicated that they planned to use natural colors stated that this was an increase. Top reasons remained similar with consumer demand, clean label and industry trends as the reasons named.
Sharing the work
Company size among survey-takers seems to continue to represent entrepreneurial operations.
The mean and median of the number of employees for this year’s survey are 501 and 23 employees, respectively. This is slightly different from last year when survey-takers reported a mean of 201 employees and a median of 63 employees. Going back even further, this year’s employee mean and median still is significantly smaller than results from the 2013 survey in which the numbers were 1,278 and 180 employees for the mean and median, respectively.
Similar to last year’s survey, the smaller operations resulted in a more intimate setting for R&D teams. Nearly three-quarters of respondents indicated that they have fewer than 10 employees involved in the new-product-development process with a median of four employees involved. Last year, 82 percent of respondents noted having fewer than 10 employees working on new product development; however, the median of four employees being involved was consistent.
Although beverage manufacturers have dedicated teams for their new product development, they still outsource a portion of the process. One-third of respondents indicated that they outsource a portion of the work (up from 29 percent last year).
Among those who outsource part of the process, market research is outsourced by more than half (53 percent) followed by prototype development (47 percent) and concept/product testing (41 percent).
This is a notable shift from last year’s responses in which prototype development was the No. 1 outsourced process with 62 percent naming it. It was followed by concept and product testing (46 percent) and market research (38 percent).
Although team approach still is noted by a majority of respondents (82 percent), it is down from last year’s survey in which 93 percent noted this development approach.
Among those who indicated using a team approach in this year’s survey, sales/marketing (80 percent) and upper management (78 percent) were the departments involved. Other areas noted by respondents were production (56 percent), R&D (49 percent) and customers (44 percent).
Although sales/marketing was ranked No. 1 by last year’s survey-takers, R&D was No. 2 with 79 percent listing it. Upper management was No. 3 at 62 percent.
Among respondents who noted upper management involvement, 100 percent stated that the chief executive officer was included in that process compared with 88 percent in 2014. When noting the roles of chief executive officers, 41 percent said leader/decision-maker followed by oversees/advisory/guidance, which was listed by a quarter of survey-takers. Last year, slightly more than a quarter noted oversees/advisory/guidance as the chief executive officer’s role. Slightly more than a quarter of 2014 survey-takers also listed team member.
Beverage-makers also continue to get input from their supplier partners. Slightly less than half of respondents indicated that they involve their suppliers in the new product development process. This is down from last year in which 58 percent noted supplier involvement.
Among those who work with their suppliers, three-quarters of survey-takers note involvement with samples followed by provide raw materials/ingredients (71 percent) and technical support/expertise (67 percent).
Inception/idea stage through completion and beginning stage through completion were the two most-noted stages in which suppliers were involved at 38 and 46 percent, respectively. Only 17 percent indicated involving suppliers after formulation through completion, while no respondents added supplier input in the final stages.
However, the length of time to develop a new product seems to be moving at a faster pace as 8.2 months was the average product development timeframe, with a quarter of respondents noting this was faster than previous years. Last year, mean product development timeframe from inception to launch was 11 months with less than one-third indicating that was faster than in the past.
All of these processes might keep beverage-makers busy, but that is not holding them back. On average, 21 new products were developed in 2015 with approximately 12 being released in market, an average of 55 percent of developed products were released. Of those released, an average of nearly two were considered successful in 2015, which equates to a 7 percent average of successful products developed and a 13 percent average of successful products of those released.
In comparison, a mean of 24 products were developed in 2014 with an average of nine that were released, a 38 percent average of products released of those developed. Among those, a mean of five products were considered successful in 2014. This equated to a 21 percent average of successful products of those developed and a 56 percent average of successful products of those released.
2016 expectations
As beverage-makers usher in the new year, new product development is on many minds.
Half of respondents indicated that they plan to launch more products into the marketplace in 2016 compared with 2015. Among those who expect to see an increase of new product launches, the average percentage increase of product launches is 57 percent.
Last year’s respondents had slightly more than half note intentions to launch more products in 2015 than 2014; however, the average percentage increase only was 38 percent.
Planning remains split as half of survey-takers have a definitive new-product-development plan; however, assessment has a slightly higher uptick with 60 percent of respondents who have post-launch assessments. In comparison, 60 percent had definitive plans and 76 percent had post-launch assessments in the 2014 survey.
One area that continues to show strong variances among survey-takers is total cost to develop new products. With a recorded minimum of $100 and maximum of $2 million, 41 percent of new products fall in the $1,000-$19,000 range. The median total cost came to $17,500. This is strong contrast to last year’s survey in which the recorded minimum was $50 with the maximum at $1.5 million, with the median total cost at $37,500.
When it came to R&D budgets, respondents this year also stipulated a lower price tag as only 32 percent planned to increase their budget compared with 44 percent last year. BI
Beverage Industry’s New Product Development survey was conducted by BNP Media’s Market Research Division. The online survey was conducted between Oct. 22 and Nov. 6, 2015, and included a systematic random sample of the domestic circulation of Beverage Industry.
Of the respondents, 34 percent process beer, 28 percent process coffee and tea, 26 percent process juice and juice-type drinks, 22 percent process water, 22 percent process wine, 20 percent process spirits, 16 percent process energy drinks, 12 percent process dairy-based drinks, 12 percent process carbonated soft drinks and 8 percent process sports drinks.
Seventy percent of respondents were from companies with less than $10 million in annual revenue. Another 8 percent of respondents also were from companies with revenue between $10 million and $50 million. A total of 2 percent were from companies in the mid-size range of $50 million to less than $100 million. Ten percent were from companies with revenue between $100 million to less than $500 million. In the $500 million to less than $1 billion range were 2 percent of respondents. Representing the large-size range of more than $1 billion in company revenue were 8 percent of respondents.
Males accounted for 72 percent of the respondents, and the average age equated to 44. For industry experience, 2 percent had less than one year; 14 percent indicated one to three years; 36 percent reported four to 10 years; 22 percent said 11-20 years; 20 percent listed 21-30 years; and 6 percent had 31-40 years of experience.
Regionally, 32 percent said they currently live in the South, 24 percent indicated the Midwest, 20 percent listed the Northeast, 20 percent reported living in the Western portion of the United States and 4 percent stated they reside in U.S. territories.
Beverage Industry launches new app
Introductory video shows how to use Bev Industry Mobile

By Jessica Jacobson (March 14, 2014)
According to statistics portal Statista Inc., an estimated 140 million Americans are smartphone users, up from 121.4 million in 2012. The research firm anticipates this number will continue to grow and eclipse the 200 million mark by 2017.
Although the popularity of smartphones is not breaking news, it always leads to interesting conversations. One area that seems to be standard with smartphone owners is the use of mobile applications (apps). Even if you don’t have a smartphone, the app world might be impacting you without you knowing it. Last year, for instance, I attended a wedding in which the bride and groom met through a dating app.
Mobilestatistics.com reports that the total app downloads for Android devices lead all devices with 50 billion, followed closely by Apple devices with 48 billion and Blackberry devices at 3 billion. Windows Marketplace download statistics are not available yet, it reports.
With those kinds of statistics, it’s no surprise that beverage brands are developing their own apps in order to reach consumers. This past fall, Seagram’s Gin, a brand of Pernod Ricard USA, launched its new Ginsider mobile app, which allows consumers to scan Seagram’s Peach and Pineapple Twisted Gin bottles to reveal exclusive videos and share them with friends through social media. And recently, as part of its “There’s Power in Every Game” campaign centered around the 2014 FIFA World Cup, The Coca-Cola Co.’s Powerade brand teamed up with fitness app Endomondo to invite consumers to participate in a series of challenges for the chance to win prizes, including tickets to the FIFA World Cup tournament in Brazil.
And now, Beverage Industry is following suit. I’m pleased to announce that Beverage Industry has launched Bev Industry Mobile for iOS and Android-based phones and tablets. Now, all the content and news that you enjoy in Beverage Industry and at bevindustry.com can be viewed on your mobile devices through Bev Industry Mobile.
You can log on to bevindustry.com/apps to download the app for iPhone, iPad or Android devices. For Apple users, the app is compatible with iOS 5.1 and later, and Android owners require version 4.0 or later. If your device has neither of these, don’t worry; we have developed mobile.bevindustry.com, a mobile website. This page can be saved on your device as an HTML5 app.
In order to help you navigate all of the features, Managing Editor Stephanie Cernivec also filmed a how-to video, which can be viewed on our BevIndustry TV portal or on our YouTube Channel, youtube.com/beverageindustry.
And if you have more questions, visit bevindustry.com/mobilehelp, which contains a list of frequently asked questions as well as a mobile support contact icon that is located on the right-hand side of the page.
I hope you enjoy Bev Industry Mobile, and please feel free to share your feedback by sending me an email at [email protected].
Happy mobile apping!
Updated 2/26/2016 45


