very imp please make it very very effectively and no plagiarism all in APA format with min 800 word
Running Head: GOOGLE MERCHANDISE store ANALYTICS kpi’s 0
Google Merchandise Store Analytics KPI’s
Student XXXXXX
XXXXX University
Executive Summary 3
Google Merchandise Store Analytics KPI’s Framework 3
Selected Analytics KPI’s 4
KPI’s Definitions and Drivers. 4
Stakeholder’s Responsibilities 5
Expected Business Outcomes. 6
References 7
Appendices: 8
Appendix 0: Selected Business Questions 9
Appendix 1: Acquisition Insights 10
Appendix 2: Behavior Insights 13
Appendix 3: Conversion Insights 16
Appendix 4: KPI’s Definitions, Dimensions, Segments and Goals 18
Appendix 5: Expectations on Key Stakeholders Behavior 19
Appendix 6: Expected Business Outcomes 20
Executive Summary
Google Merchandise Store sales figures, in the first quarter of 2017, are suggesting a weak tone of the business to attract more customers and increase conversions and revenue. This business problem was articulated around 5 business questions (see appendix 0), that drive the analytics effort, whose next step is the definition of relevant and actionable KPI’s.
This paper summarizes the KPI selection process. Based on data discovery focused on each one of the targeted business questions, critical insights were gained regarding the main issues impacting the three marketing areas of Google Merchandise Store. (Acquisition, Behavior and Conversion).
Based on these insights, a set of 8 KPI’s were selected and specific goals were assigned considering industry benchmarks and store data (2017 Q1 data). Expectations regarding stakeholder’s actions and behaviors to be driven by these KPI’s are described, including a summary of the expected business outcomes to be achieved.
Google Merchandise Store Analytics KPI’s FrameworkThe following insights were acquired (see appendices 1-3 for more details):
Channels with the best conversion rates are the most effective bringing returning visitors and multisession visitors.
Website underperforming in terms of ecommerce conversion rates. Low mobile and tablet traffic.
Low add to cart rate (Desktop, Mobile & Tablet) combined with high cart abandonment rates in mobile and tablet.
Users with more than 3 sessions have triple ecommerce conversion rates, than users with 3 or less sessions. Segment of users under 25 underpenetrated.
Per session value – Average revenue per session. This KPI will measure the value of earned, owned and paid media bringing quality traffic. It will increase linked to the ability to attract returning visitors and multisession visitors.
Assisted/last click ratio –This KPI will measure the value of channels functioning in an assisting role. The more this KPI exceeds 1, the more value in terms of assisted conversions.
Landing Pages value –This KPI will measure the effectiveness of landing pages supporting conversions. It increases with the number of transactions and average revenue per transaction.
% Exit –This KPI will measure revenue leakages on our website pages. It increases with the volume of exits experienced in a page or set of pages.
Add to cart rate - This KPI will increase the more users add product to the cart. It complements cart abandonment rates, measuring leakages in the ecommerce funnel.
Cart Abandonment rate and Check-out abandonment rates measure revenue leakages in the ecommerce funnel. They increase the more users abandon carts, whether it is before or during the check-out process.
Ecommerce conversion rate –Based on data analysis, users with more than 3 sessions have ecommerce conversion rates that are 2.5 higher than users with 3 or less sessions. Segment of age under 25 represents a significant opportunity. They are mainly “browsers” than can be activated as buyers with the right marketing campaigns. See appendix 5 for a complete list of KPI’s definitions, dimensions and goals.
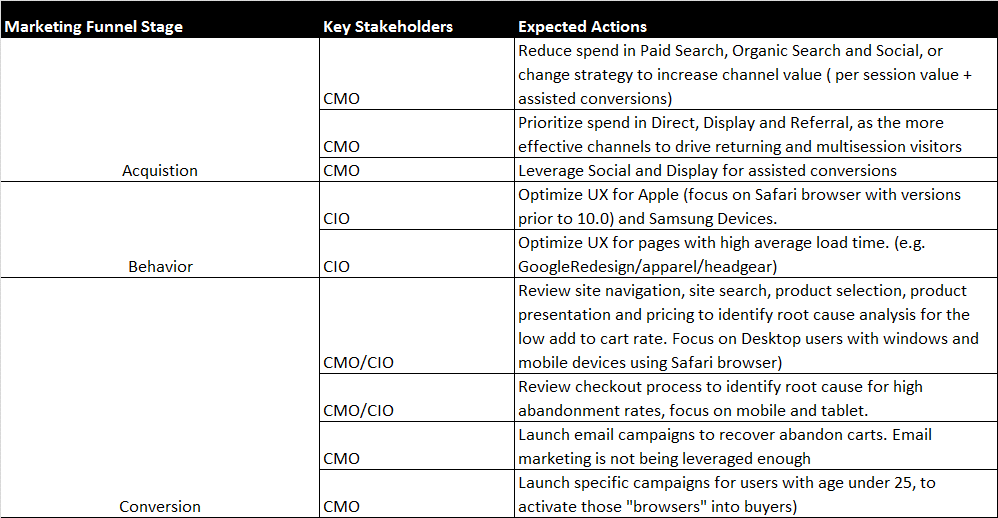
Stakeholder’s ResponsibilitiesAcquisition – per session value and assisted/last click ratio will support CMO in prioritizing efforts and spend in earned, owned and paid media. A low per session value and an assisted/last click ratio close to zero would signal channels that need immediate action such us Paid and Organic Search and Social. (See appendix 4).
Behavior – Page value and % exit will assist to identify mobile devices/browsers that need enhancements, such as Apple and Samsung Devices, and Safari browser. (See appendix 4)
Conversions – Add to cart rate and abandonment rates will assist to identify devices that are underperforming. The CMO should focus on strategies to improve add to cart rate in general, and abandonment rates for mobile and tablet. The use of email marketing and retargeting is recommended. Launch of a special campaign for users under 21 years. (See appendix 4)
Expected Business Outcomes.The first benefit would be for this organization to realize that its online store is underperforming in terms of ecommerce conversion rates, considering US benchmarks.
Acquisition – Spend and effort will be directed to the most effective channels bringing quality traffic to the website. This will increase ROMI and minimize low performing sources.
Behavior – Sales will increase by taking advantage of the opportunities from users with Apple and Samsung Devices.
Conversion – Sales will increase by improving add to cart rates and reducing abandonment rates. By leveraging email marketing for retargeting users with abandoned carts, a significant revenue uplift can be accomplished. Campaign targeting under 25 age, will also create additional revenue. Just buy converging to US industry conversion standards, revenue would increase 20%. (See appendix 6).
References
Dave Chaffey (2017) – Ecommerce conversion rates
www.smartinsights.com
Dave Chaffey (2016) – What are typical average add-to-cart conversion rates?
www.smartinsights.com
Ecommerce Genome – Checkout Abandonment Rates in Ecommerce – 2016 Benchmarks
www.blog.compass.co
Graham Charlton (2016) – Infographic – Average cart abandonment rates for Q3 2016
www.clickz.com
Armando Roggio (2016) – 4 Things Add-to-cart tell an Ecommerce Business
www.practicalecommerce.com
Appendices:
Appendix 0: Selected Business Questions

Appendix 1: Acquisition Insights

Returning visitors and new visitors with more than 1 session represent the traffic with the highest quality in terms of sales/revenue

Direct is delivering the highest per session value for returning visitors. Paid search, organic search and social are underperforming.
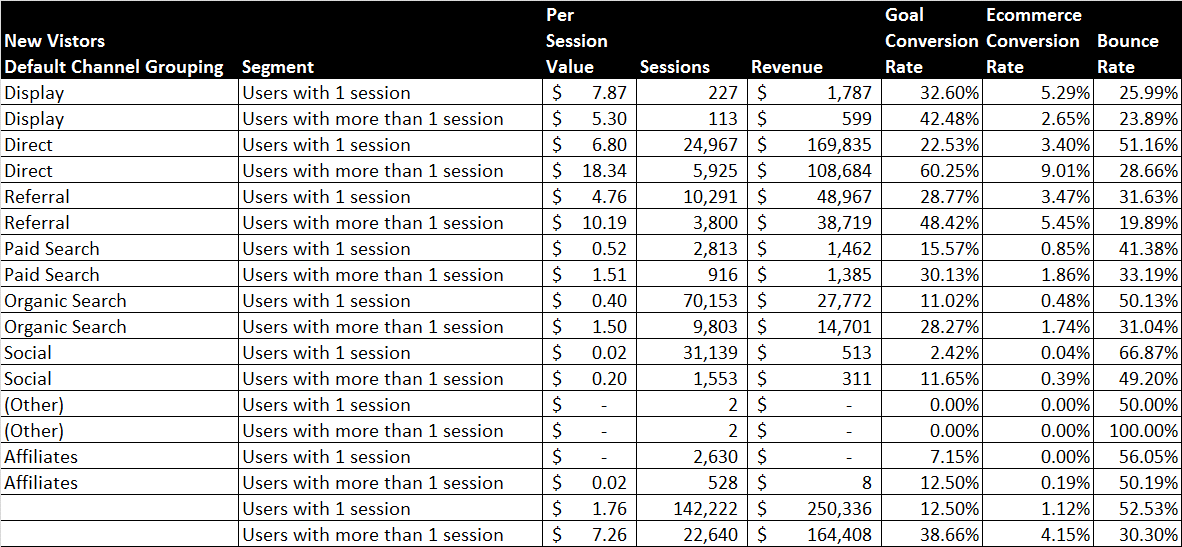
Direct, Display and Referral are also delivering the highest per session value for new visitors. The rest are underperforming
Appendix 1: Acquisition Insights (cont.)

Direct and referral are the channels driving the highest $ value in assisted conversions.
Appendix 2: Behavior Insights

All devices are underperforming in terms of conversion rate comparing to industry benchmarks. (4.31 Desktop, 1.50 Mobile, 3.55 Tablet). Source: Monetate Ecommerce Quarterly
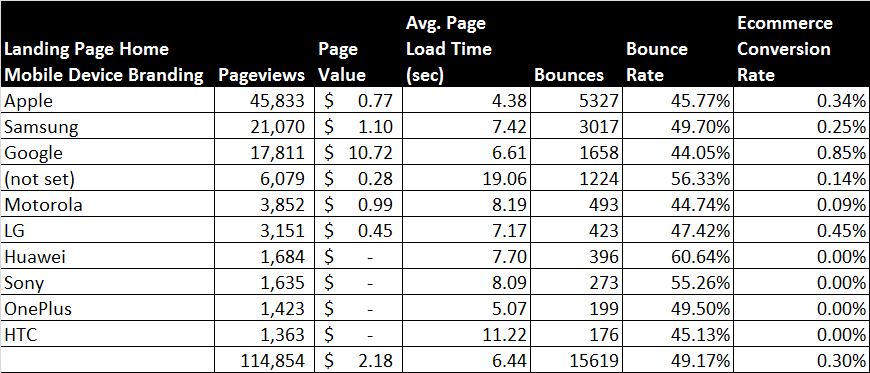
Looking at Landing Page/Home, Apple and Samsung, while driving more traffic, have significantly lower conversion rates. This pattern is observed across different landing pages. Bounce rates or avg. page load time do not seem to be the drivers (at least in the case of Apple)

Looking at Apple mobiles, Safari browsers require optimization given the significant traffic volume and the fact that conversion rates are half of apple devices with Chrome browser.
Appendix 2: Behavior Insights (cont.)
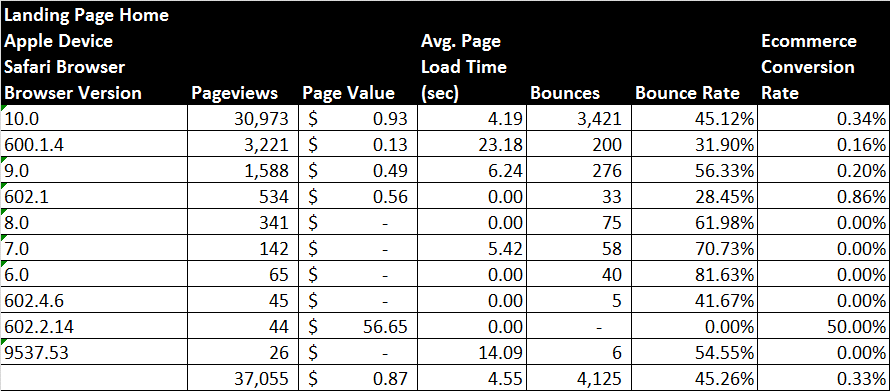
Apple devices with Safari 600.1.4 browser represent an opportunity as they drive material traffic volume with very low page value
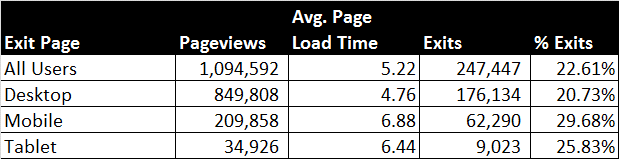
Mobile is driving the highest exit rates

Top ten exit pages by % Exit. Apparel headgear with 107 seconds clearly requires optimization

Samsung mobiles offer opportunity for improvement in terms of exit rates
Appendix 3: Conversion Insights
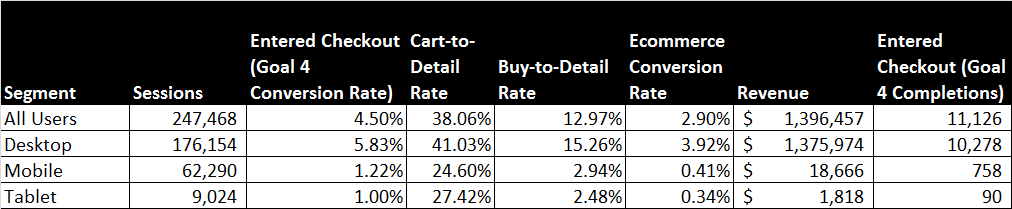
Low Ecommerce conversion rates are partially driven by very low add to cart rates with only 5.83% of visits adding to cart in desktop and 1.22% in mobile. (Significantly below industry benchmark)

Desktop windows users offer opportunity for improvement with very significant traffic volume and very low add to cart rate (2.38%)

Mobile devices using Safari pose an opportunity with very significant traffic volume and add to cart rates lower than Chrome users
Appendix 3: Conversion Insights (Cont.)
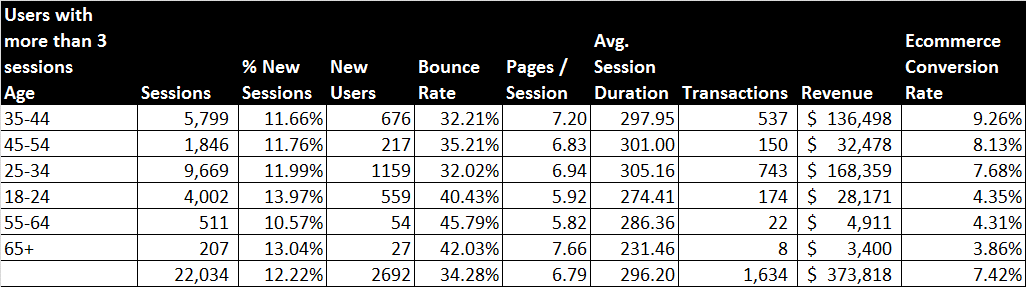
Users with more than 3 sessions do 2.5 times as many transactions as users with 3 or less transactions. Segment below 25 years poses significant opportunity
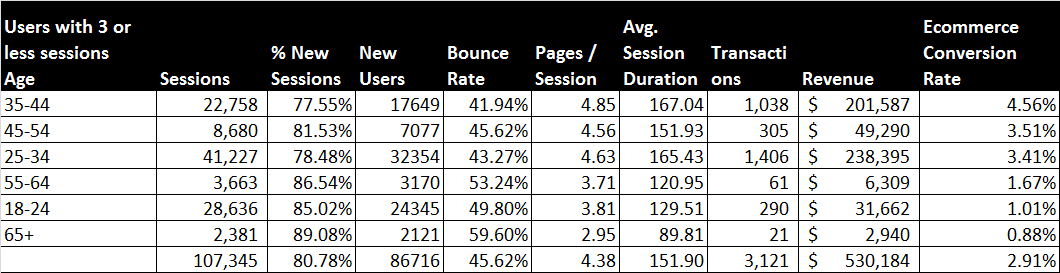
Segment below 25 years poses significant opportunity for users with 3 or less sessions. They are mainly “browsers” that can be activated as buyers with the right marketing campaigns
Appendix 4: KPI’s Definitions, Dimensions, Segments and Goals
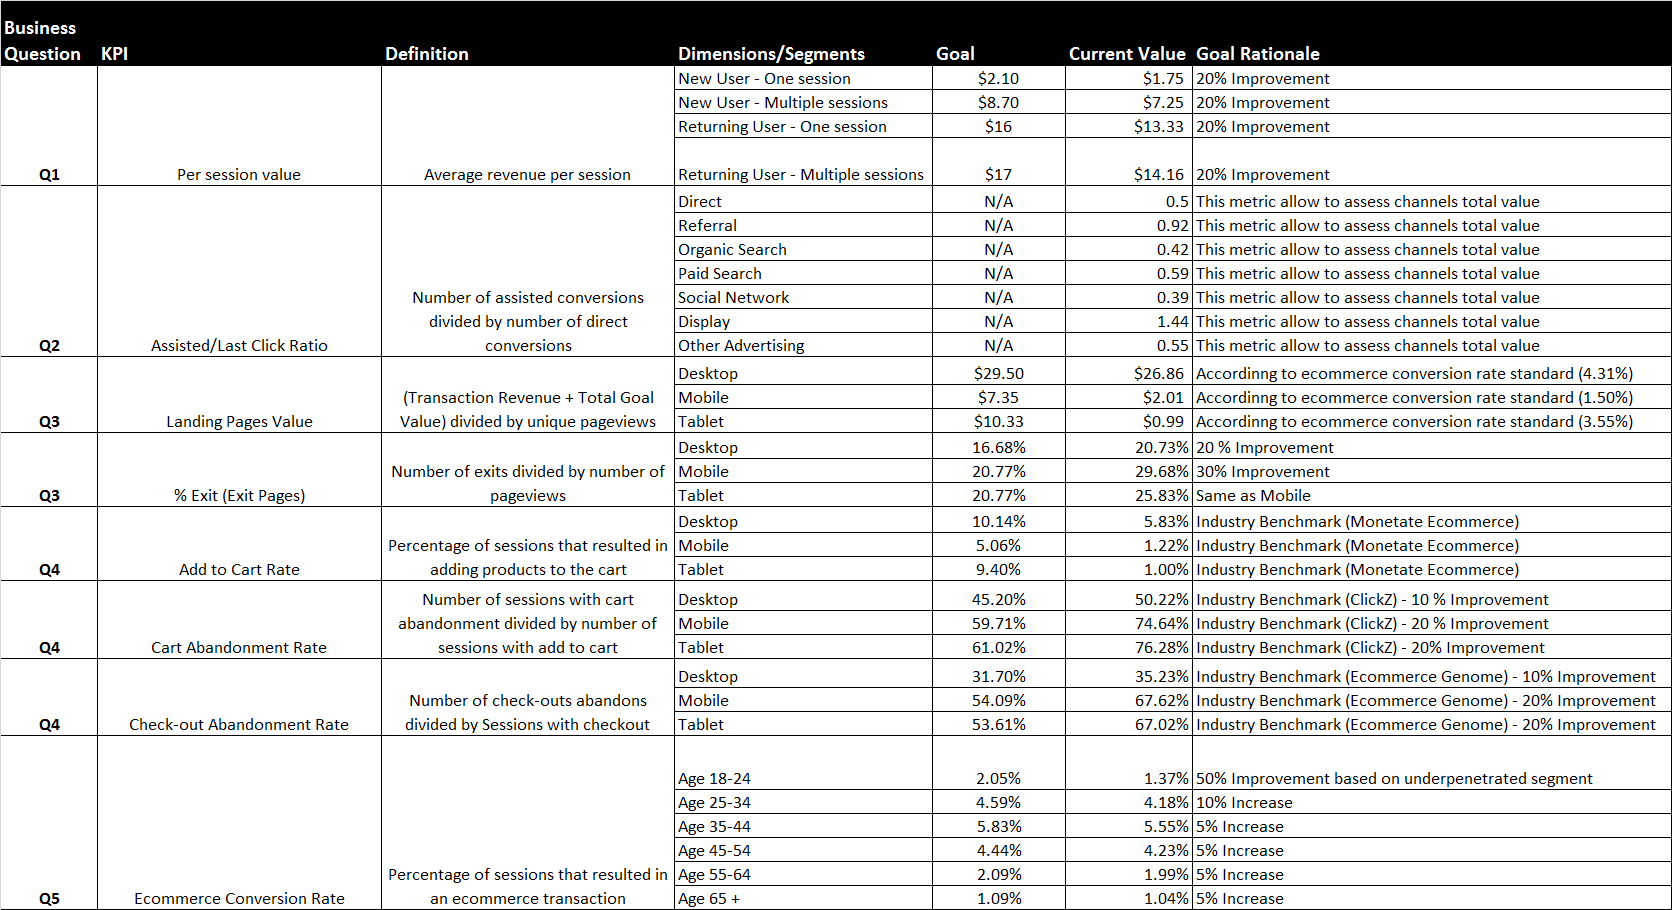
Goals defined based on Industry benchmarks and Google Merchandise Store Data
Appendix 5: Expectations on Key Stakeholders Behavior
Appendix 6: Expected Business Outcomes
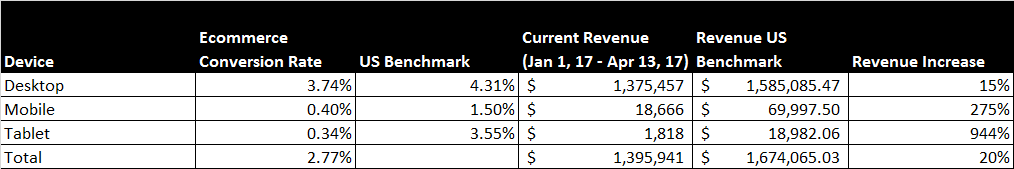
Revenue would increase 20% by converging ecommerce conversion rates with US benchmarks


