Unit 6 Assignment 1 Statistics
![]()
Note: This guide is an example of creating correlation output in SPSS with the grades.sav file. The variables shown in this guide do not correspond with the actual variables assigned in Unit 6 Assignment 1. Carefully follow the assignment instructions for a list of assigned variables. Screen shots were created with SPSS 21.0.
Assumptions of CorrelationTo complete Section 2 of the DAA, you will generate SPSS output for histograms, descriptive statistics, and a scatter plot. Refer to the Unit 6 assignment instructions for a list of assigned variables. The example variables quiz1 and quiz2 are shown below.
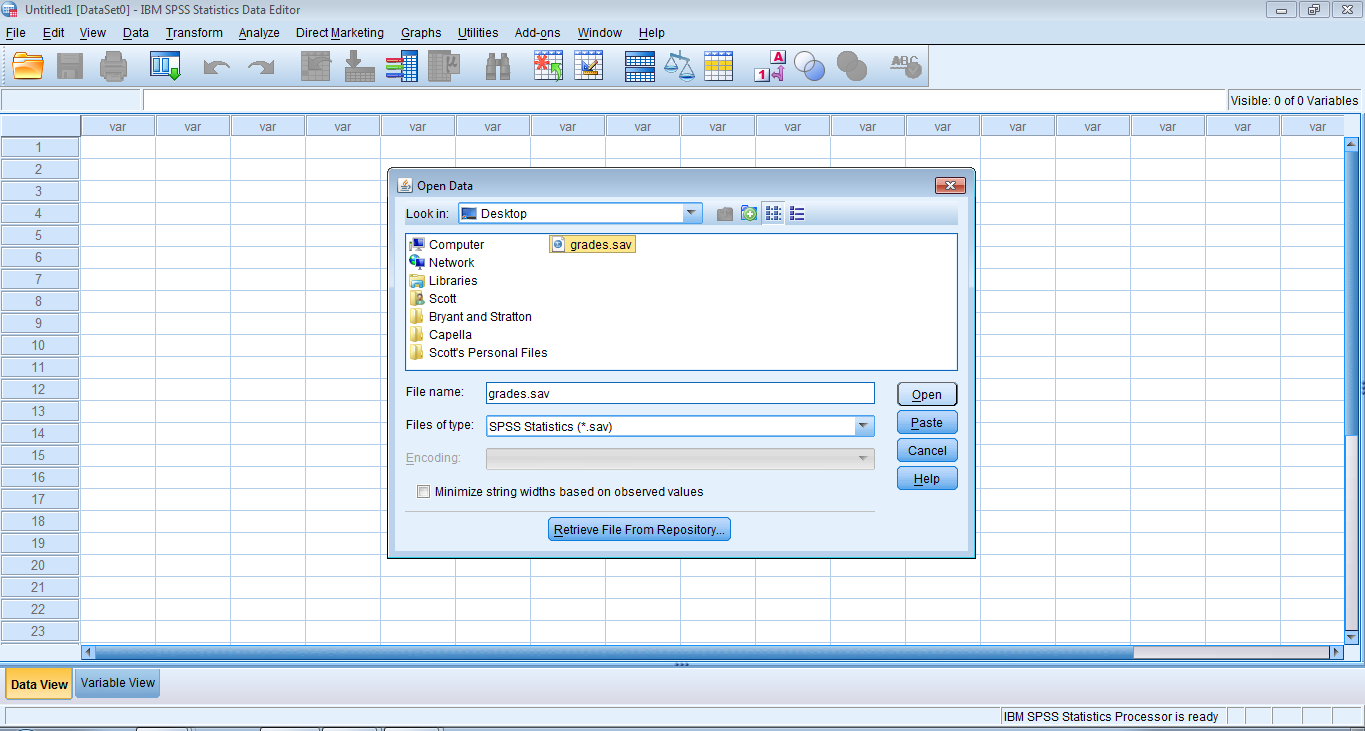
Step 1. Open grades.sav in SPSS.
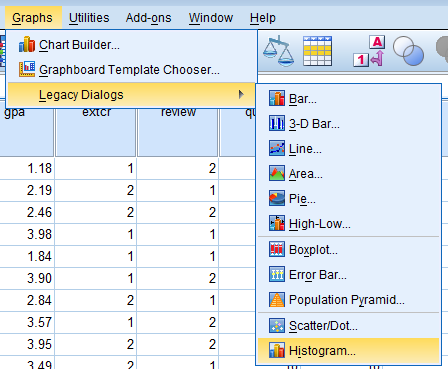
Step 2. Generate SPSS histogram output for the Unit 6 assignment variables. (See the step-by-step guide from Unit 3 for complete instructions on generating histograms.)
On the Graphs menu, point to Legacy Dialogs and click Histogram…
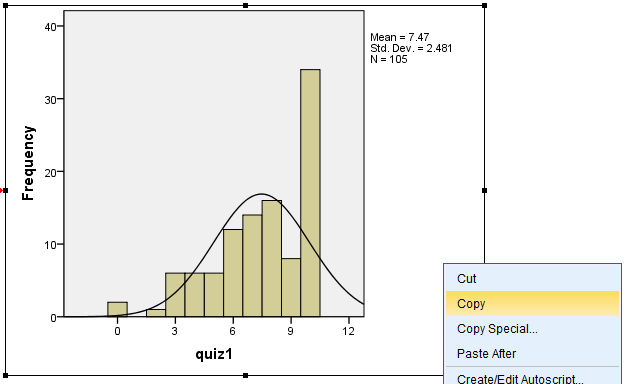
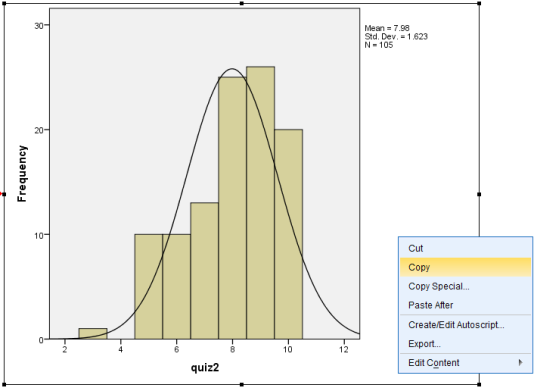
Create separate histograms for the two assigned variables for the Unit 6 assignment.
Copy the two histograms and paste them into Section 2 of the DAA template.
Provide a visual interpretation for each histogram. The examples of quiz1 and quiz2 are shown below.
Step 3. Next, you will generate descriptive statistics for your Unit 6 assignment variables. (See the step-by-step guide from Unit 3 for complete instructions on generating descriptive statistics output.)
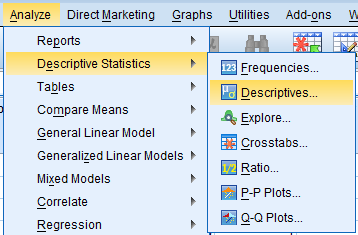
On the Analyze menu, point to Descriptive Statistics and click Descriptives…
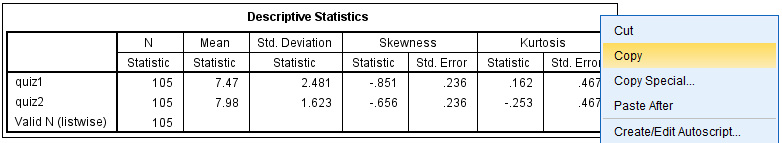
Copy the descriptive statistics output and paste it into the DAA Template.
Below the output, interpret the skewness and kurtosis values.
Step 4. Create the SPSS scatter plot for your assigned variables.
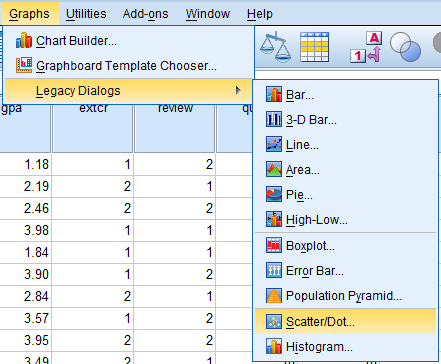
On the Graphs menu, point to Legacy Dialogs and click Scatter/Dot…
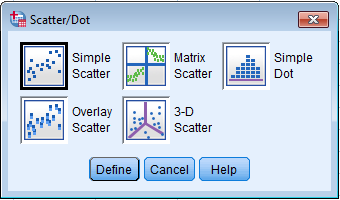
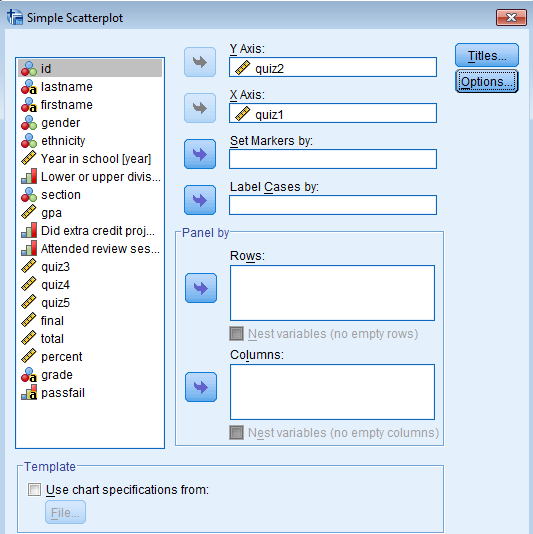
In the Scatter/Dot dialog box, select Simple Scatter and then click the Define button.
In the Simple Scatterplot dialog box, select the assigned variables for the X Axis (horizontal) and Y Axis (vertical) as required in the Unit 6 Assignment 1 instructions. (The examples of quiz1 and quiz2 are shown below.) Click OK.
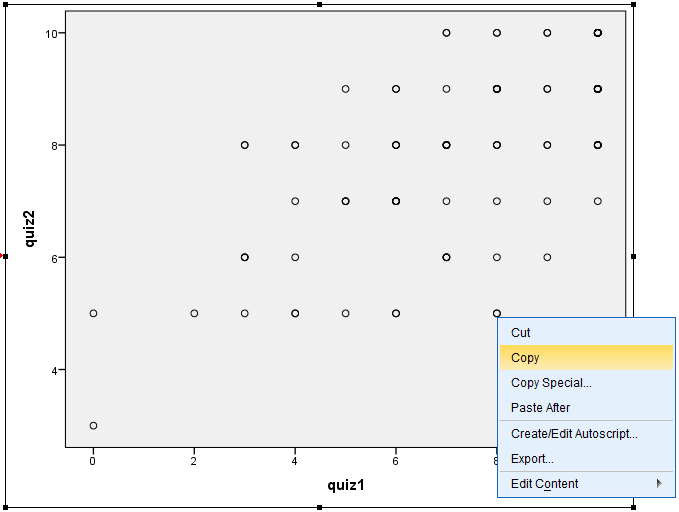
Copy the scatter plot and paste it into the DAA Template.
Then provide an interpretation of the scatter plot.
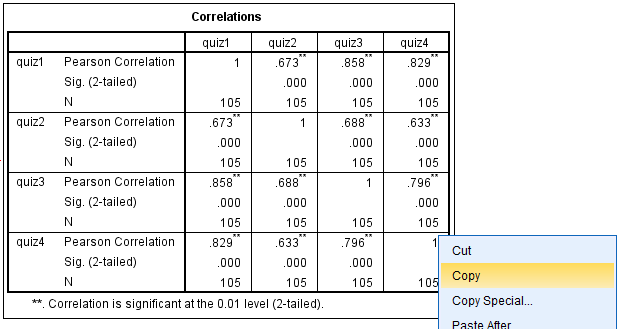
To complete DAA Section 4, generate the SPSS intercorrelation matrix of all assigned Unit 6 Assignment 1 variables. The example variables of quiz1, quiz2, quiz3, and quiz4 are shown below.
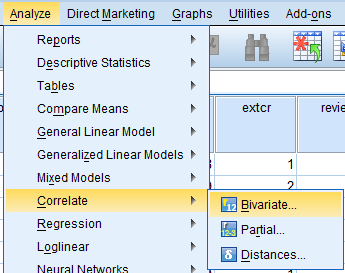
Step 1. On the Analyze menu, point to Correlate and click Bivariate…
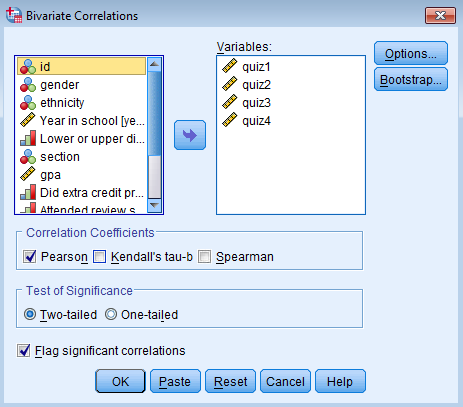
Step 2. In the Bivariate Correlations dialog box:
Move the Unit 6 assignment variables into the Variables box.
Select the Pearson option, the Two-tailed option, and the Flag significant correlations option.
Click OK.
Step 3. Copy the intercorrelation matrix and paste it into Section 4 of the DAA Template. Then interpret it as instructed in the assignment instructions.
8


