Create a 10- to 11-slide presentation that addresses each question within the Comparative Analysis Case. The Coca-Cola Company and PepsiCo, Inc. The financial statements of Coca-Cola and PepsiCo are presented in Appendices C and D, respectively. The co
The Coca-Cola Company is the world's largest beverage company. It owns or licenses and markets more than 500 nonalcoholic beverage brands, primarily sparkling beverages, but also a variety of still beverages such as waters, enhanced waters, juices and juice drinks, ready-to-drink teas and coffees, and energy and sports drinks. Finished beverage products bearing Coca-Cola trademarks, sold in the United States since 1886, are now available in more than 200 countries. To access Coca-Cola's complete annual report, including notes to the financial statements, follow these steps:
Go to http://www.coca-colacompany.com/investors/.
Select Financial Reports and Information and then click on 2014 Annual Report on Form 10-K.
The Notes to Consolidated Financial Statements begin on page 78.
| THE COCA-COLA COMPANY AND SUBSIDIARIES CONSOLIDATED STATEMENTS OF INCOME | |||
| Year Ended December 31, | 2014 | 2013 | 2012 |
| (In millions except per share data) |
|
|
|
| NET OPERATING REVENUES | $ 45,998 | $ 46,854 | $ 48,017 |
| Cost of goods sold | 17,889 | 18,421 | 19,053 |
| GROSS PROFIT | 28,109 | 28,433 | 28,964 |
| Selling, general and administrative expenses | 17,218 | 17,310 | 17,738 |
| Other operating charges | 1,183 | 895 | 447 |
| OPERATING INCOME | 9,708 | 10,228 | 10,779 |
| Interest income | 594 | 534 | 471 |
| Interest expense | 483 | 463 | 397 |
| Equity income (loss) — net | 769 | 602 | 819 |
| Other income (loss) — net | (1,263) | 576 | 137 |
| INCOME BEFORE INCOME TAXES | 9,325 | 11,477 | 11,809 |
| Income taxes | 2,201 | 2,851 | 2,723 |
| CONSOLIDATED NET INCOME | 7,124 | 8,626 | 9,086 |
| Less: Net income attributable to noncontrolling interests | 26 | 42 | 67 |
| NET INCOME ATTRIBUTABLE TO SHAREOWNERS OF THE COCA-COLA COMPANY | $ 7,098 | $ 8,584 | $ 9,019 |
| BASIC NET INCOME PER SHARE1 | $ 1.62 | $ 1.94 | $ 2.00 |
| DILUTED NET INCOME PER SHARE1 | $ 1.60 | $ 1.90 | $ 1.97 |
| AVERAGE SHARES OUTSTANDING | 4,387 | 4,434 | 4,504 |
| Effect of dilutive securities | 63 | 75 | 80 |
| AVERAGE SHARES OUTSTANDING ASSUMING DILUTION | 4,450 | 4,509 | 4,584 |
1Calculated based on net income attributable to shareowners of The Coca-Cola Company.
| THE COCA-COLA COMPANY AND SUBSIDIARIES CONSOLIDATED STATEMENTS OF COMPREHENSIVE INCOME | |||
| Year Ended December 31, | 2014 | 2013 | 2012 |
| (In millions) |
|
|
|
| CONSOLIDATED NET INCOME | $ 7,124 | $ 8,626 | $ 9,086 |
| Other comprehensive income: |
|
|
|
| Net foreign currency translation adjustment | (2,382) | (1,187) | (182) |
| Net gain (loss) on derivatives | 357 | 151 | 99 |
| Net unrealized gain (loss) on available-for-sale securities | 714 | (80) | 178 |
| Net change in pension and other benefit liabilities | (1,039) | 1,066 | (668) |
| TOTAL COMPREHENSIVE INCOME | 4,774 | 8,576 | 8,513 |
| Less: Comprehensive income (loss) attributable to noncontrolling interests | 21 | 39 | 105 |
| TOTAL COMPREHENSIVE INCOME ATTRIBUTABLE TO SHAREOWNERS OF THE COCA-COLA COMPANY | $ 4,753 | $ 8,537 | $ 8,408 |
| THE COCA-COLA COMPANY AND SUBSIDIARIES CONSOLIDATED BALANCE SHEETS | ||
| December 31, | 2014 | 2013 |
| (In millions except par value) |
|
|
| ASSETS |
|
|
| CURRENT ASSETS |
|
|
| Cash and cash equivalents | $ 8,958 | $ 10,414 |
| Short-term investments | 9,052 | 6,707 |
| TOTAL CASH, CASH EQUIVALENTS AND SHORT-TERM INVESTMENTS | 18,010 | 17,121 |
| Marketable securities | 3,665 | 3,147 |
| Trade accounts receivable, less allowances of $331 and $61, respectively | 4,466 | 4,873 |
| Inventories | 3,100 | 3,277 |
| Prepaid expenses and other assets | 3,066 | 2,886 |
| Assets held for sale | 679 | — |
| TOTAL CURRENT ASSETS | 32,986 | 31,304 |
| EQUITY METHOD INVESTMENTS | 9,947 | 10,393 |
| OTHER INVESTMENTS | 3,678 | 1,119 |
| OTHER ASSETS | 4,407 | 4,661 |
| PROPERTY, PLANT AND EQUIPMENT — net | 14,633 | 14,967 |
| TRADEMARKS WITH INDEFINITE LIVES | 6,533 | 6,744 |
| BOTTLERS' FRANCHISE RIGHTS WITH INDEFINITE LIVES | 6,689 | 7,415 |
| GOODWILL | 12,100 | 12,312 |
| OTHER INTANGIBLE ASSETS | 1,050 | 1,140 |
| TOTAL ASSETS | $ 92,023 | $ 90,055 |
| LIABILITIES AND EQUITY |
|
|
| CURRENT LIABILITIES |
|
|
| Accounts payable and accrued expenses | $ 9,234 | $ 9,577 |
| Loans and notes payable | 19,130 | 16,901 |
| Current maturities of long-term debt | 3,552 | 1,024 |
| Accrued income taxes | 400 | 309 |
| Liabilities held for sale | 58 | — |
| TOTAL CURRENT LIABILITIES | 32,374 | 27,811 |
| LONG-TERM DEBT | 19,063 | 19,154 |
| OTHER LIABILITIES | 4,389 | 3,498 |
| DEFERRED INCOME TAXES | 5,636 | 6,152 |
| THE COCA-COLA COMPANY SHAREOWNERS' EQUITY |
|
|
| Common stock, $0.25 par value; Authorized — 11,200 shares; |
|
|
| Issued — 7,040 and 7,040 shares, respectively | 1,760 | 1,760 |
| Capital surplus | 13,154 | 12,276 |
| Reinvested earnings | 63,408 | 61,660 |
| Accumulated other comprehensive income (loss) | (5,777) | (3,432) |
| Treasury stock, at cost — 2,674 and 2,638 shares, respectively | (42,225) | (39,091) |
| EQUITY ATTRIBUTABLE TO SHAREOWNERS OF THE COCA-COLA COMPANY | 30,320 | 33,173 |
| EQUITY ATTRIBUTABLE TO NONCONTROLLING INTERESTS | 241 | 267 |
| TOTAL EQUITY | 30,561 | 33,440 |
| TOTAL LIABILITIES AND EQUITY | $ 92,023 | $ 90,055 |
| THE COCA-COLA COMPANY AND SUBSIDIARIES CONSOLIDATED STATEMENTS OF CASH FLOWS | |||
| Year Ended December 31, | 2014 | 2013 | 2012 |
| (In millions) |
|
|
|
| OPERATING ACTIVITIES |
|
|
|
| Consolidated net income | $ 7,124 | $ 8,626 | $ 9,086 |
| Depreciation and amortization | 1,976 | 1,977 | 1,982 |
| Stock-based compensation expense | 209 | 227 | 259 |
| Deferred income taxes | (40) | 648 | 632 |
| Equity (income) loss — net of dividends | (371) | (201) | (426) |
| Foreign currency adjustments | 415 | 168 | (130) |
| Significant (gains) losses on sales of assets — net | 831 | (670) | (98) |
| Other operating charges | 761 | 465 | 166 |
| Other items | 149 | 234 | 254 |
| Net change in operating assets and liabilities | (439) | (932) | (1,080) |
| Net cash provided by operating activities | 10,615 | 10,542 | 10,645 |
| INVESTING ACTIVITIES |
|
|
|
| Purchases of investments | (17,800) | (14,782) | (14,824) |
| Proceeds from disposals of investments | 12,986 | 12,791 | 7,791 |
| Acquisitions of businesses, equity method investments and nonmarketable securities | (389) | (353) | (1,486) |
| Proceeds from disposals of businesses, equity method investments and nonmarketable securities | 148 | 872 | 20 |
| Purchases of property, plant and equipment | (2,406) | (2,550) | (2,780) |
| Proceeds from disposals of property, plant and equipment | 223 | 111 | 143 |
| Other investing activities | (268) | (303) | (268) |
| Net cash provided by (used in) investing activities | (7,506) | (4,214) | (11,404) |
| FINANCING ACTIVITIES |
|
|
|
| Issuances of debt | 41,674 | 43,425 | 42,791 |
| Payments of debt | (36,962) | (38,714) | (38,573) |
| Issuances of stock | 1,532 | 1,328 | 1,489 |
| Purchases of stock for treasury | (4,162) | (4,832) | (4,559) |
| Dividends | (5,350) | (4,969) | (4,595) |
| Other financing activities | (363) | 17 | 100 |
| Net cash provided by (used in) financing activities | (3,631) | (3,745) | (3,347) |
| EFFECT OF EXCHANGE RATE CHANGES ON CASH AND CASH EQUIVALENTS | (934) | (611) | (255) |
| CASH AND CASH EQUIVALENTS |
|
|
|
| Net increase (decrease) during the year | (1,456) | 1,972 | (4,361) |
| Balance at beginning of year | 10,414 | 8,442 | 12,803 |
| Balance at end of year | $ 8,958 | $ 10,414 | $ 8,442 |
| THE COCA-COLA COMPANY AND SUBSIDIARIES CONSOLIDATED STATEMENTS OF SHAREOWNERS' EQUITY | |||
| Year Ended December 31, | 2014 | 2013 | 2012 |
| (In millions except per share data) |
|
|
|
| EQUITY ATTRIBUTABLE TO SHAREOWNERS OF THE COCA-COLA COMPANY NUMBER OF COMMON SHARES OUTSTANDING |
|
|
|
| Balance at beginning of year | 4,402 | 4,469 | 4,526 |
| Purchases of treasury stock | (98) | (121) | (121) |
| Treasury stock issued to employees related to stock compensation plans | 62 | 54 | 64 |
| Balance at end of year | 4,366 | 4,402 | 4,469 |
| COMMON STOCK | $ 1,760 | $ 1,760 | $ 1,760 |
| CAPITAL SURPLUS |
|
|
|
| Balance at beginning of year | 12,276 | 11,379 | 10,332 |
| Stock issued to employees related to stock compensation plans | 526 | 569 | 640 |
| Tax benefit (charge) from stock compensation plans | 169 | 144 | 144 |
| Stock-based compensation | 209 | 227 | 259 |
| Other activities | (26) | (43) | 4 |
| Balance at end of year | 13,154 | 12,276 | 11,379 |
| REINVESTED EARNINGS |
|
|
|
| Balance at beginning of year | 61,660 | 58,045 | 53,621 |
| Net income attributable to shareowners of The Coca-Cola Company | 7,098 | 8,584 | 9,019 |
| Dividends (per share — $1.22, $1.12 and $1.02 in 2014, 2013 and 2012, respectively) | (5,350) | (4,969) | (4,595) |
| Balance at end of year | 63,408 | 61,660 | 58,045 |
| ACCUMULATED OTHER COMPREHENSIVE INCOME (LOSS) |
|
|
|
| Balance at beginning of year | (3,432) | (3,385) | (2,774) |
| Net other comprehensive income (loss) | (2,345) | (47) | (611) |
| Balance at end of year | (5,777) | (3,432) | (3,385) |
| TREASURY STOCK |
|
|
|
| Balance at beginning of year | (39,091) | (35,009) | (31,304) |
| Stock issued to employees related to stock compensation plans | 891 | 745 | 786 |
| Purchases of treasury stock | (4,025) | (4,827) | (4,491) |
| Balance at end of year | (42,225) | (39,091) | (35,009) |
| TOTAL EQUITY ATTRIBUTABLE TO SHAREOWNERS OF THE COCA-COLA COMPANY | $ 30,320 | $ 33,173 | $ 32,790 |
| EQUITY ATTRIBUTABLE TO NONCONTROLLING INTERESTS |
|
|
|
| Balance at beginning of year | $ 267 | $ 378 | $ 286 |
| Net income attributable to noncontrolling interests | 26 | 42 | 67 |
| Net foreign currency translation adjustment | (5) | (3) | 38 |
| Dividends paid to noncontrolling interests | (25) | (58) | (48) |
| Acquisition of interests held by noncontrolling owners | — | (34) | (15) |
| Contributions by noncontrolling interests | — | 6 | — |
| Business combinations | (22) | 25 | 50 |
| Deconsolidation of certain entities | — | (89) | — |
| TOTAL EQUITY ATTRIBUTABLE TO NONCONTROLLING INTERESTS | $ 241 | $ 267 | $ 378 |
Pepsico, Inc. is a leading global food and beverage company with a complementary portfolio of enjoyable brands, including Frito-Lay, Gatorade, Pepsi-Cola, Quaker, and Tropicana. Through its operations, authorized bottlers, contract manufacturers, and other third parties, PepsiCo makes, markets, distributes, and sells a wide variety of convenient and enjoyable beverages, foods, and snacks, serving customers and consumers in more than 200 countries and territories. To access PepsiCo's complete annual report, including notes to the financial statements, follow these steps:
Go to http://www.pepsico.com/Investors.
Select SEC Filings and then the 10K, dated 2/12/2015 (select the pdf version).
Select Entire document.
The Notes to Consolidated Financial Statements begin on page 73.
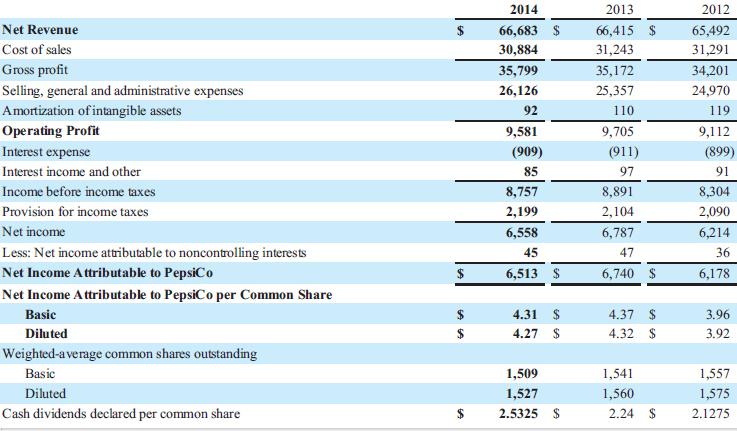
Consolidated Statement of Income
PepsiCo, Inc. and Subsidiaries
Fiscal years ended December 27, 2014, December 28, 2013 and December 29, 2012
(in millions except per share amounts
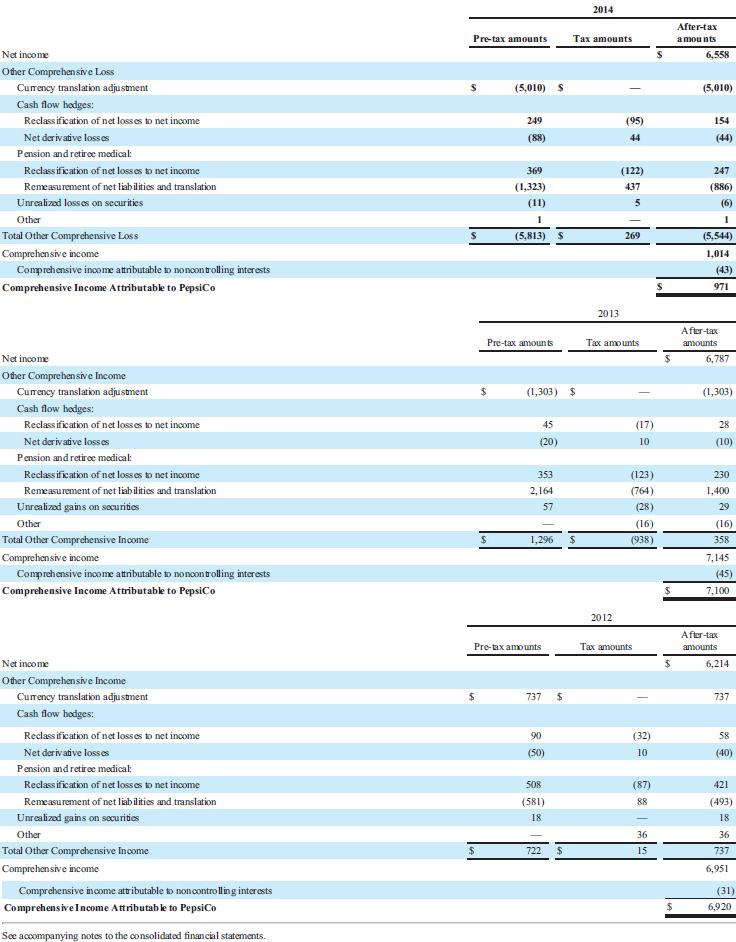
Consolidated Statement of Comprehensive Income
PepsiCo, Inc. and Subsidiaries
Fiscal years ended December 27, 2014, December 28, 2013 and December 29, 2012
(in millions)
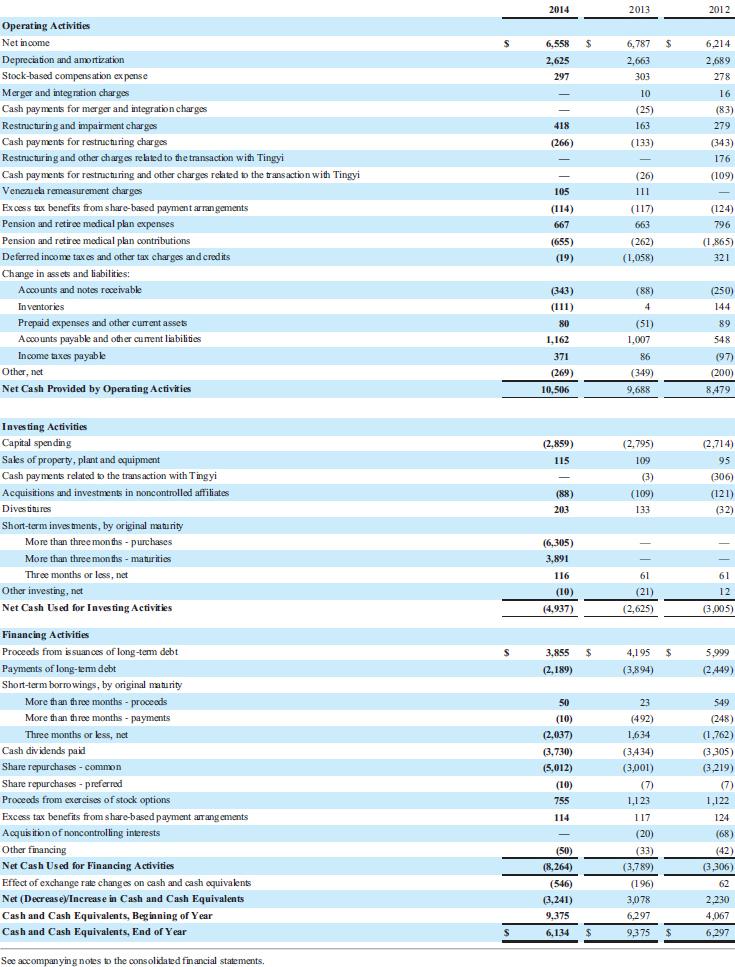
Consolidated Statement of Cash Flows
PepsiCo, Inc. and Subsidiaries
Fiscal years ended December 27, 2014, December 28, 2013 and December 29, 2012
(in millions)
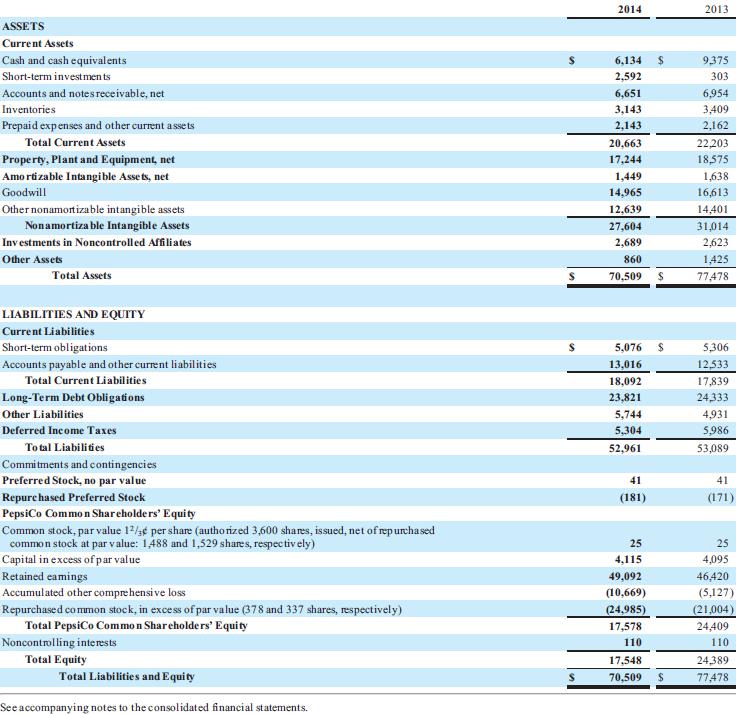
Consolidated Balance Sheet
PepsiCo, Inc. and Subsidiaries
December 27, 2014 and December 28, 2013
(in millions except per share amounts)
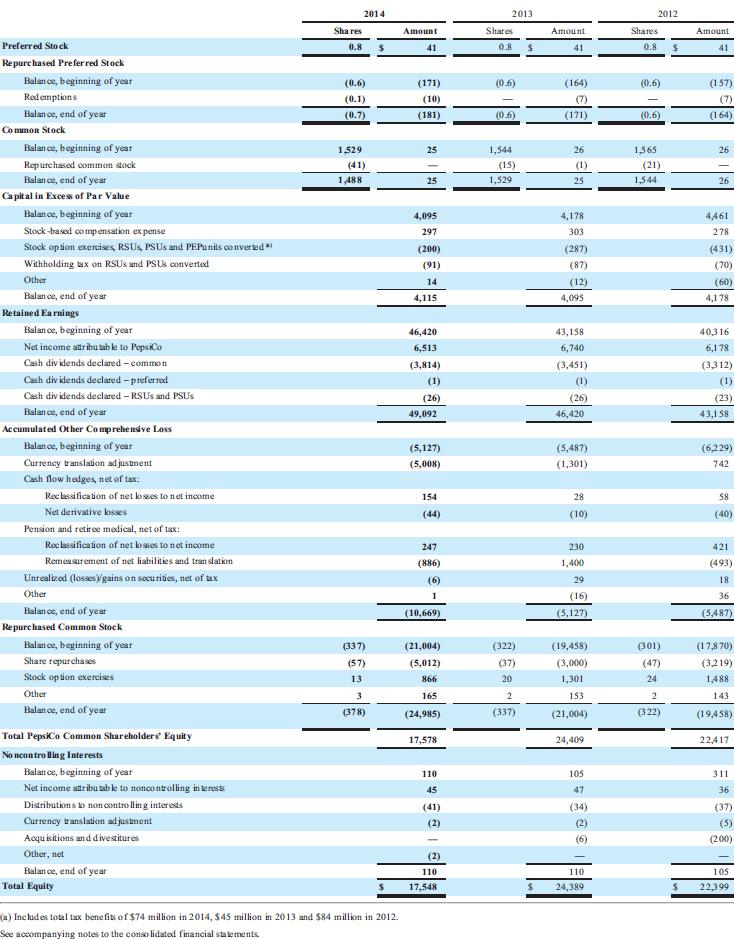
Consolidated Statement of Equity
PepsiCo, Inc. and Subsidiaries
Fiscal years ended December 27, 2014, December 28, 2013 and December 29, 2012
(in millions)