BusMgt 4232 Spring 2016 Forecasting INDIVIDUAL Practice Assignment All calculations should use two decimal places; solutions should be reported as...
BusMgt 4232 Spring 2016 Forecasting Individual Practice Assignment
All calculations should use two decimal places; solutions should be reported as appropriate for the data (think about what is appropriate to report, don’t just do math!!).
Problem 1 (24 pts)
The forecasting manager is responsible for generating forecasts and demand profiles to be used in the sales and operations planning (S&OP) process. You strive for low inventory levels, short delivery times, and high product availability, so an accurate forecast is critical for meeting these competitive priorities. The actual demand from customers for the previous fiscal year is detailed below (in 10,000 units). Use this information to answer the following questions to provide a comprehensive forecast analysis to the management team:
| Month | 1 | 2 | 3 | 4 | 5 | 6 | 7 | 8 | 9 | 10 | 11 | 12 |
| Demand | 31 | 29 | 32 | 36 | 33 | 35 | 39 | 40 | 38 | 44 | 46 | 50 |
You are to create forecasts of future demand, but you are also given the actual data so that you can compute error metrics. If you actually knew future demand, you would not create a forecast. A forecast, in reality, is created without any actual knowledge of future demand, and only after the time period has passed can you determine how well your forecast predicted demand. When you don’t have actual data, you must extend your forecast data into the future. Your first step should always be to plot your data.
a) Use regression analysis (from BM2320) to estimate the month-in-advance forecast for 15 months, starting with month 5 (your forecast will take you into the next year, from month 5 to 19). Use the actual data given to determine errors for months 5-12 of the forecast you generated. (4 pts)
b) Use a two-month moving average to estimate the forecast for months 3-19. Use the actual data given to determine errors for months 3-12 of your forecast. (4 pts)
c) Use a four-month weighted moving average (weights of 0.45, 0.30, 0.15, 0.10) to estimate the forecast for months 5-19. Use the actual data as given to determine the errors of months 5-12 of the forecast you generated. (4pts)
d) Use exponential smoothing (with α = 0.60 and Month 2 forecast of 33 units) to estimate the forecast for months 3-19. Use the actual data as given to determine the error of months 3-12 of the forecast you generated. (4pts)
e) Compare the accuracy of the forecasts generated above using the different techniques. Make a comprehensive but concise managerial recommendation of the forecasting method you would select from the data given and what you generated above. Beyond the error metrics, why are some methods better or worse in this particular situation? (4pts)
f) Provide an alternative forecast (use a different technique than used above or a method above with different values) that you think is a better option and justify your recommendation (this will likely require you to try more than one alternative to determine which is best). (4pts)
Problem 2 (8 pts)
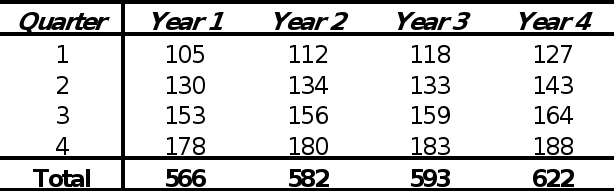
As the demand manager, you have noticed a seasonal pattern for demand over the past four years, and would like to use this knowledge to better predict demand for the coming year. Given the following demand information for one of your products and a prediction that aggregate demand in Year 5 will be 650 units, prepare a forecast for quarters 1-4 of Year 5.
Problem 3 (6 pts)
The VP of Sales has received the forecast by unit in both market regions for two items the firm sells, although you also use a well-known economist to forecast revenue. There is concern that the two forecasts may not be equivalent, and you have been asked to undertake the analysis of the two forecasts. Below is information for the demand by product type and region, and the sales price per unit.
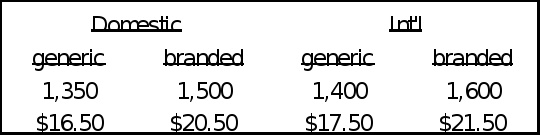
a) The economist has predicted total revenue from the two products in all regions of $108,000 for next year. Given a ‘roll-up’ (aggregation) of the forecast generated by the sales team that you have been given, what is the delta between these two forecasts? (2 pts)
b) If through the S&OP process, the team decides that they are targeting total revenue of $115,000. What would be the ‘force down’ (disaggregated) forecast by product in each region in units and revenue? (4pts)
Problem 4 (10 pts)
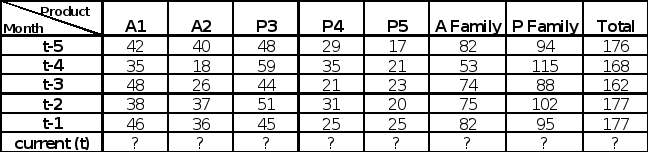
Using your knowledge of how different forecasting methods can be used, determine the best forecast given the data above. You may try the methods used above (likely you will need to try different variable values) or you can use alternate methods.
What is the BEST TOTAL AGGREGATE forecast for this firm for the next 12 months, if the business is also expected to grow by 20% in the next year; month 12 will be 120% of the current month (t)?
How and why did you determine that the method you selected generates the best forecast considering all the options you tried?
Of the total demand, what percentage is made up of each of the 5 products?
| A1% | A2% | P3% | P4% | P5% |
|
|
|
|
|
|


