This is a sample of what is attched1.Researchers often enter a lot of data into statistical software programs. The probability of making zero to two errors per 1,000 keystrokes is 0.56, and the probab
1.Researchers often enter a lot of data into statistical software programs. The probability of making zero to two errors per 1,000 keystrokes is 0.56, and the probability of making three to five errors per 1,000 keystrokes is 0.26. Find the probabilities (per 1,000 keystrokes) associated with each of the following.
(a) at most two errors
.56
Correct: Your answer is correct.
(b) at least three errors
.70
Incorrect: Your answer is incorrect.
(c) at most five errors
.78
Incorrect: Your answer is incorrect.
(d) more than five errors
.70
Incorrect: Your answer is incorrect.
+Organize the probabilities into a frequency table before answering each item.
2.The relative frequency distribution of the number of phobias reported by a hypothetical sample of 500 college students is given as follows.
0–2 0.54
3–5 0.25
6–8 0.11
9–11 0.07
12–14 0.03
(a) What is the probability that a college student expresses fewer than three phobias?
.54
Correct: Your answer is correct.
(b) What is the probability that a college student expresses more than eight phobias?
.10
Correct: Your answer is correct.
(c) What is the probability that a college student has between 3 and 11 phobias?
.54
Incorrect: Your answer is incorrect.
+Use addition to sum probabilities if necessary.
3.Using the unit normal table, find the proportion under the standard normal curve that lies to the right of the following values. (Round your answers to four decimal places.)
(a)
z = 1.00
.1587
Correct: Your answer is correct.
(b)
z = −1.75
.09295
Incorrect: Your answer is incorrect.
(c)
z = 0
.5
Correct: Your answer is correct.
(d)
z = −2.30
.9871
Correct: Your answer is correct.
(e)
z = 1.96
.0250
Correct: Your answer is correct.
+Note that the z-scores are given. Look each score up directly in the unit normal table.
4.A sample of final exam scores is normally distributed with a mean equal to 30 and a variance equal to 16.
Part (a)
What percentage of scores are between 26 and 34? (Round your answer to two decimal places.)
68 %
Correct: Your answer is correct.
Part (b)
What raw score is the cutoff for the top 10% of scores? (Round your answer to one decimal place.)
3.0
Incorrect: Your answer is incorrect.
Part (c)
What is the proportion below 23? (Round your answer to four decimal places.)
0
Incorrect: Your answer is incorrect.
Part (d)
What is the probability of a score less than 37? (Round your answer to four decimal places.)
?
+You may need to use the appropriate table in Appendix B to answer this question.
+Compute the z-transformation, then look up the z-scores in the unit normal table.
5.A normal distribution has a mean equal to 51. What is the standard deviation of this normal distribution if 2.5% of the proportion under the curve lies to the right of x = 68.64? (Round your answer to two decimal places.)
?
+You may need to use the appropriate table in Appendix B to answer this question
6.A normal distribution has a standard deviation equal to 33. What is the mean of this normal distribution if the probability of scoring above x = 199 is 0.0228? (Round your answer to one decimal place.)
?
+You may need to use the appropriate table in Appendix B to answer this question.
7.According to national data, about 10% of American college students earn a graduate degree. Using this estimate, what is the probability that exactly 16 undergraduates in a random sample of 200 students will earn a college degree? Hint: Use the normal approximation to the binomial distribution, where p = 0.1 and q = 0.9. (Round your answer to four decimal places.)
?
+You may need to use the appropriate table in Appendix B to answer this question.
8.A clinical psychologist is the primary therapist for 12 patients. She randomly selects a sample of 3 patients to be in her study. How many different samples of this size can be selected from this population of 12 patients using theoretical sampling and experimental sampling?
(a) theoretical sampling
3 samples
Incorrect: Your answer is incorrect.
(b) experimental sampling
3 samples
Incorrect: Your answer is incorrect.
samples
Refer to the formula's given in Section 7.2 for finding the number of samples that can be selected using experimental and theoretical sampling.
Additional Materials
A population is normally distributed with a mean of 53 and a standard deviation of 12.
(a) What is the mean of the sampling distribution (μM) for this population?
μM =  Incorrect
(b) If a sample of 16 participants is selected from this population, what is the standard error of the mean (σM)?
σM =  correct
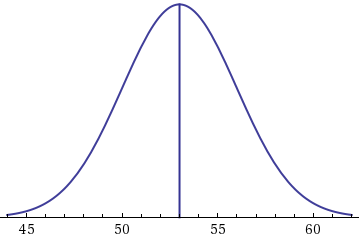
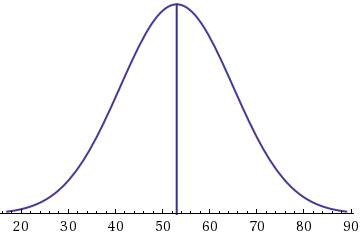
(c) Pick the shape of this distribution with
M ± 3 SEM.
|
|
|
|
|
|