These are the things that have not been completed:Classify each variable as independent or dependent.In 3-5 paragraphs, explain your work. Include the name of the statistical tool you used to calculat
Module 5: Module Notes: The Affordable Care Act & Demand Analysis
As a result of the Affordable Care Act (ACA), beginning in January 2014, individuals without health insurance were able to purchase health insurance in the Affordable Insurance Exchange. People scrambled to sign up for insurance on the website but faced many problems accessing the site. One reason for the inability to access the site was an excessive number of users attempting to access the site at the same time. If this explanation were true, the problem might have been avoided using a demand analysis.
Let us look at some of the important concepts related to this situation.
Demand Analysis
A demand analysis is used to determine if resources are being used most efficiently. In the case of the ACA, administrators underestimated the number of people who would attempt to access the site at one time. If administrators had used demand analysis effectively, they might have acquired the software that could accommodate the number of people expected to access the website. In other words, administrators might have had a more accurate calculation of the correlation between the demand for the service and the capacity of the website itself.
Measure of Association
Calculating the correlation comprises measuring the extent to which one variable is related to another. To do this, a measure of association is obtained, which determines how one variable increases or decreases in relation to or as it interacts with another variable. In the case of the ACA, the number of users is the independent variable, meaning that it can change. The dependent variable would be the ACA website. The dependent variable (the ACA website) responds to the independent variable (the number of users). Thus, when the number of users exceeded the number that the website had the capacity to manage, the website essentially malfunctioned such that no one was able to access it. A demand analysis might have assisted administrators to measure how closely these variables were related, thereby providing useful information for the website and software design.
5: Module Notes: Comparing Correlation & Demand Analysis
The term “demand analysis” is commonly used in practice. However, in statistics, the term correlation is more common. There are numerous statistical tests that can be used to determine correlation; determining which of the tests is most appropriate depends on the type of data (qualitative or quantitative), the scale of measurement (nominal, ordinal, interval, and ratio), and the number and/or combination of variables (independent and dependent). For quantitative data, there are essentially two types of tests, parametric or nonparametric, with numerous possible tests under each category. However, because qualitative data is not numeric, it can be handled in one of two ways: either it is coded so that it can be quantitatively analyzed or it can be analyzed using the text alone. Unlike quantitative data, there is no formula for analyzing qualitative data based on the text alone.
Let us look at the charts that present information about various quantitative statistical tests and when to use them.
Tests to Assess Relationships Between Two Variables
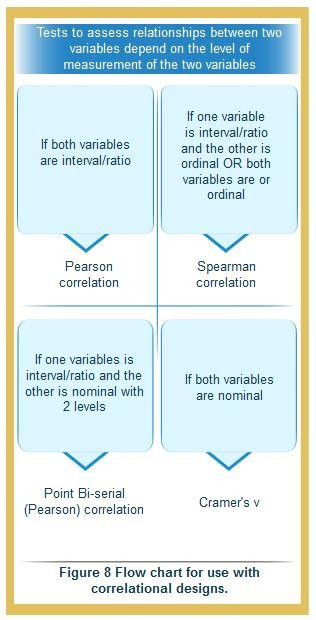

Source: Bettany-Saltikov, J., & Whittaker, V. J. (2014). Selecting the most appropriate inferential statistical test for your quantitative research study (Links to an external site.)Links to an external site.. Journal of Clinical Nursing, 23(11/12), pp. 1520-1531. Retrieved from http://vlib.excelsior.edu/login?url=http://search.ebscohost.com/login.aspx?direct=true&db=rzh&AN=103937909&site=eds-live&scope=site
These are only a few types of quantitative statistical analyses you can choose from. There are a number of tests that you may select, and selecting the appropriate test depends on your dataset and population.
Qualitative Analysis
Qualitative analysis comprises more of an exploration of the data. Researchers are looking to discover what is actually in the text or to find patterns in the text. This process is very time consuming because it involves reading, transcribing data, coding data, and interpreting data. To do so successfully, a keen attention to detail is required.
Here are a few qualitative analysis tools:
| Analysis Tools | Function of the Tool |
| Content analysis | Describes and interprets data |
| Narrative Analysis | Transcribes experiences |
| Discourse Analysis | Focuses on how language is used in everyday situations |
| Grounded Theory | Useful for analytic problems that can be solved with a general statement |
| Framework Analysis | Uses numerical or text coding to identify patterns in the data |
Like quantitative tools, there are times when one of these options is better than the others. In addition, there is software available that performs the verbal and content text analysis.
Appropriate Questioning in Survey Design
In the example of the ACA, it is very likely that the Department of Health & Human Services (DHHS) had a good estimate of how many people needed to apply using the Affordable Insurance Exchange. What the DHHS likely did not anticipate was that everyone would do it at the same time. If the DHHS had used a survey or other data to arrive at the number of those who need access, they might have avoided the problem by considering a single question:
"When do you plan to register on the Insurance Exchange"?
This question could be rewritten to generate data using any scale of measurement and can be evaluated qualitatively or quantitatively. Either way, a single question in the survey design could have prevented the problem and the outcomes of that problem.


